Bitcoin smells like 'Brexit to the NORTH Pole!'🚀📈 Bitcoin smells like 'Brexit to the NORTH Pole!' 💥🇬🇧
Hi everyone! Let’s break down what’s brewing with Bitcoin — and why it feels eerily like the Brexit moment of 2016 all over again.
I’ve been closely tracking BTCUSD inside a clear parallel channel. These channels often get noisy with fakeouts and temporary breaches, but this one has remained valid due to its multiple touches and midline confirmations. We're now seeing massive manipulation — not once or twice, but four times. This exact pattern took me back to the British Pound's behavior during the Brexit referendum on June 23, 2016. 🎯
Back then, despite media narratives claiming “Bremain,” real traders on the street saw Brexit coming — and so did the charts. GBP/USD mirrored today's BTC structure: a valid channel, several manipulative moves, and then an explosive breakout once the truth surfaced.
Fast forward to today — Bitcoin’s chart screams volatility. We’ve got a channel that still holds structure. As long as we stay within or reclaim the bounds of this channel, I’m aiming for a move toward:
📍 107,305 as resistance
📍 113,800–114,000 as the breakout trigger
📍 119,000 and beyond for a new all-time high 🚀
If price dips to the 104,469 area or even the 102,700–102,400 dual support, I’ll be watching for reclaims to go long. But remember, this is a volatile setup, not for the faint-hearted or the underfunded. Spot trading is safer; leverage requires deep pockets and tight risk controls.
🛑 A break below 102K changes the picture — that’s where the bears take over, potentially dragging BTC to 74K. I give that scenario only a 10–15% probability, but in this market, we prepare for everything.
The resemblance to Brexit isn’t just visual — it’s psychological. Media narratives, manipulative institutions, and a channel that's begging for a breakout.
I’m ultra-bullish and ready for a sharp upside move. Are you?
📌 Full analysis and key levels charted here.
One Love,
The FXPROFESSOR 💙
Disclosure: I am happy to be part of the Trade Nation's Influencer program and receive a monthly fee for using their TradingView charts in my analysis. Awesome broker, where the trader really comes first! 💙💙💙
GBPUSD

Bearish drop off pullback resistance?GBP/USD is reacting off the resistance level which is a pullback resistance that aligns with the 138.2% Fibonacci extension and could drop from this level to our take profit.
Entry: 1.3590
Why we like it:
There is a pullback resistance that aligns with the 138.2% Fibonacci extension.
Stop loss: 1.3629
Why we like it:
There is a resistance level at the 100% Fibonacci projection.
Take profit: 1.3535
Why we like it:
There is an overlap support level that aligns with the 61.8% Fibonacci retracement.
Enjoying your TradingView experience? Review us!
Please be advised that the information presented on TradingView is provided to Vantage (‘Vantage Global Limited’, ‘we’) by a third-party provider (‘Everest Fortune Group’). Please be reminded that you are solely responsible for the trading decisions on your account. There is a very high degree of risk involved in trading. Any information and/or content is intended entirely for research, educational and informational purposes only and does not constitute investment or consultation advice or investment strategy. The information is not tailored to the investment needs of any specific person and therefore does not involve a consideration of any of the investment objectives, financial situation or needs of any viewer that may receive it. Kindly also note that past performance is not a reliable indicator of future results. Actual results may differ materially from those anticipated in forward-looking or past performance statements. We assume no liability as to the accuracy or completeness of any of the information and/or content provided herein and the Company cannot be held responsible for any omission, mistake nor for any loss or damage including without limitation to any loss of profit which may arise from reliance on any information supplied by Everest Fortune Group.

GBPUSD(20250605)Today's AnalysisMarket news:
U.S. economic data-① ADP employment increased by 37,000 in May, far below the expected 110,000 and the previous value of 62,000. ② The U.S. ISM non-manufacturing index in May fell to 49.9, shrinking for the first time in nearly a year, and the expected increase was from 51.6 to 52.
Technical analysis:
Today's buying and selling boundaries:
1.3543
Support and resistance levels:
1.3622
1.3593
1.3574
1.3513
1.3494
1.3465
Trading strategy:
If the price breaks through 1.3574, consider buying, and the first target price is 1.3593
If the price breaks through 1.3543, consider selling, and the first target price is 1.3513

Gold Hits All Targets with 500+ Pips – Eyes Now on $3420By examining the gold chart on the 4-hour timeframe, we can see that after our previous analysis, the price moved exactly as expected and successfully hit all four targets — $3367, $3380, $3391, and $3400 — reaching as high as $3403 and delivering over 500 pips of return.
After sweeping the liquidity above $3400, the price corrected back to around $3370. Currently, gold is trading around $3380. If the price can hold above the $3370 level, we can expect a continuation of the bullish move toward the $3420 area.
Please support me with your likes and comments to motivate me to share more analysis with you and share your opinion about the possible trend of this chart with me !
Best Regards , Arman Shaban

London Take 1 - 5/6/2025 - GBPUSDInitial comments ...updates will follow as usual.
London Setup for GBPUSD.

GBPUSD M15 Support & Resistance Levels🚀 Here are some key zones I've identified on the 15m timeframe.
These zones are based on real-time data analysis performed by a custom software I personally developed.
The tool is designed to scan the market continuously and highlight potential areas of interest based on price action behavior and volume dynamics.
Your feedback is welcome!

GBPUSD Set To Grow! BUY!
My dear followers,
This is my opinion on the GBPUSD next move:
The asset is approaching an important pivot point 1.3459
Bias - Bullish
Technical Indicators: Supper Trend generates a clear long signal while Pivot Point HL is currently determining the overall Bullish trend of the market.
Goal - 1.3513
About Used Indicators:
For more efficient signals, super-trend is used in combination with other indicators like Pivot Points.
Disclosure: I am part of Trade Nation's Influencer program and receive a monthly fee for using their TradingView charts in my analysis.
———————————
WISH YOU ALL LUCK

GBPUSD: Bearish Continuation is Expected! Here is Why:
The price of GBPUSD will most likely collapse soon enough, due to the supply beginning to exceed demand which we can see by looking at the chart of the pair.
Disclosure: I am part of Trade Nation's Influencer program and receive a monthly fee for using their TradingView charts in my analysis.
❤️ Please, support our work with like & comment! ❤️

GBPUSD 4H MAJOR REVERSAL SETUP – WATCH FOR THE BREAK!Hey There;
The Head & Shoulders (H&S) pattern in GBPUSD is becoming more defined, approaching a critical neckline level. If a breakout occurs, it could trigger a strong downward move, pushing the price toward new support levels.
Right now, sellers are gaining strength while buyers attempt to defend key support zones. A confirmed close below the neckline could accelerate the sell-off.
📌 If the breakout happens, I’ll share target levels with you—stay tuned for updates
I meticulously prepare these analyses for you, and I sincerely appreciate your support through likes. Every like from you is my biggest motivation to continue sharing my analyses.
I’m truly grateful for each of you—love to all my followers💙💙💙

GBPUSD: Potential Reversal After Strong RallyThe British Pound has shown strong gains against the US Dollar, approaching a key resistance area. After such an extended move, a correction or reversal would be a logical expectation.
Technical Setup
There is a clear series of bearish divergences on the CCI (14) indicator. Price is forming a narrowing rising wedge, which often signals trend exhaustion.
Trade Plan
Sell limit orders: 1.3690 and 1.3850
Market entry: Only after confirmation — either a trendline break or a moving average crossover
Conclusion
GBPUSD shows signs of weakening at the top. I remain focused on short setups from resistance areas, waiting for confirmation to act.

GBPUSD buy As i can see on 15m chart i'm looking for buy setup. entry base on 3 minit chart liquidity grab & market structure shift with in 15m FVG.
Senario:
1. 15m fvg
2. 3m liquidity grab
3;. 3m market structure shift

GBPUSD(20250604)Today's AnalysisMarket news:
Fed Logan: We should focus on achieving the 2% inflation target rather than trying to make up for past inflation shortfalls; Bostic: We still think there may be a rate cut this year.
Technical analysis:
Today's buying and selling boundaries:
1.3521
Support and resistance levels:
1.3588
1.3563
1.3547
1.3496
1.3480
1.3455
Trading strategy:
If the price breaks through 1.3547, consider buying, with the first target price at 1.3563
If the price breaks through 1.3521, consider selling, with the first target price at 1.3496

GBPUSD | 30.05.2025SELL 1.34900 | STOP 1.35700 | TAKE 1.34100 | Downward movement in the local range.

Bullish bounce off 50% Fibonacci support?GBP/USD is falling towards the support level which is a pullback support that aligns with the 50% Fibonacci retracement and could bounce from this level to our take profit.
Entry: 1.3536
Why we like it:
There is a pullback support level that lines up with the 50% Fibonacci retracement.
Stop loss: 1.3510
Why we like it:
There is a pullback support level that is slightly below the 78.6% Fibonacci retracement.
Take profit: 1.3590
Why we like it:
There is a pullback resistance level that aligns with the 138.2% Fibonacci extension.
Enjoying your TradingView experience? Review us!
Please be advised that the information presented on TradingView is provided to Vantage (‘Vantage Global Limited’, ‘we’) by a third-party provider (‘Everest Fortune Group’). Please be reminded that you are solely responsible for the trading decisions on your account. There is a very high degree of risk involved in trading. Any information and/or content is intended entirely for research, educational and informational purposes only and does not constitute investment or consultation advice or investment strategy. The information is not tailored to the investment needs of any specific person and therefore does not involve a consideration of any of the investment objectives, financial situation or needs of any viewer that may receive it. Kindly also note that past performance is not a reliable indicator of future results. Actual results may differ materially from those anticipated in forward-looking or past performance statements. We assume no liability as to the accuracy or completeness of any of the information and/or content provided herein and the Company cannot be held responsible for any omission, mistake nor for any loss or damage including without limitation to any loss of profit which may arise from reliance on any information supplied by Everest Fortune Group.

GBP-USD Local Short! Sell!
Hello,Traders!
GBP-USD made a retest
Of the horizontal resistance
Of 1.3590 and we are already
Seeing a local pullback so
Despite a counter-trend
Direction of the trade
We will be expecting a
Local move down
Sell!
Comment and subscribe to help us grow!
Check out other forecasts below too!
Disclosure: I am part of Trade Nation's Influencer program and receive a monthly fee for using their TradingView charts in my analysis.

THE FLEX SETUP (EURGBP)Good day traders, I'm back with another setup and it’s only an update that I believe can really provide insight into what to expect from price in the upcoming weeks.
Like I always say that I always want to see price take out a previous week high/low as I use that as a confirmation in term of the power of 3 that I use to try and avoid manipulation, but this doesn't mean I don't get on the wrong side of price moves. Looking at the HTF's overall structure we can see that we in a very bullish structure but... There's a bearish flow in price!! On the weekly TF price left a large FVG(BISI), showing how strong the bullish structure is and now that price is trading on top of this BISI I'm mentioning. If we go one TF lower to the daily TF than on the daily the weekly BISI is a balanced price range and normally how I look at Gaps after been balanced, I treat them like classic support/resistance, but they have to confluence with another PD array first than for me the rules of 'support/resistance' come into play. If you look close into the daily TF, we have relative equal highs inside the volume imbalance created on the 12th of May.
Let's look at how price delivered since opening with a gap lower on the 12th, on that same day price repriced that gap but did not close above it. Why do we want it to close above it? Well ICT teaches more on volume imbalances and the rules or pros and cons. If price closes above the volume imbalance than it becomes balanced once price retests the closure above/below obviously depending on the gap opening. On the 4HTF we saw price shift structure higher and the first thing I see is the candle that had a broken lower high because it also became our breaker. And a FVG inside it making that zone stronger again we can use all the PD arrays together.

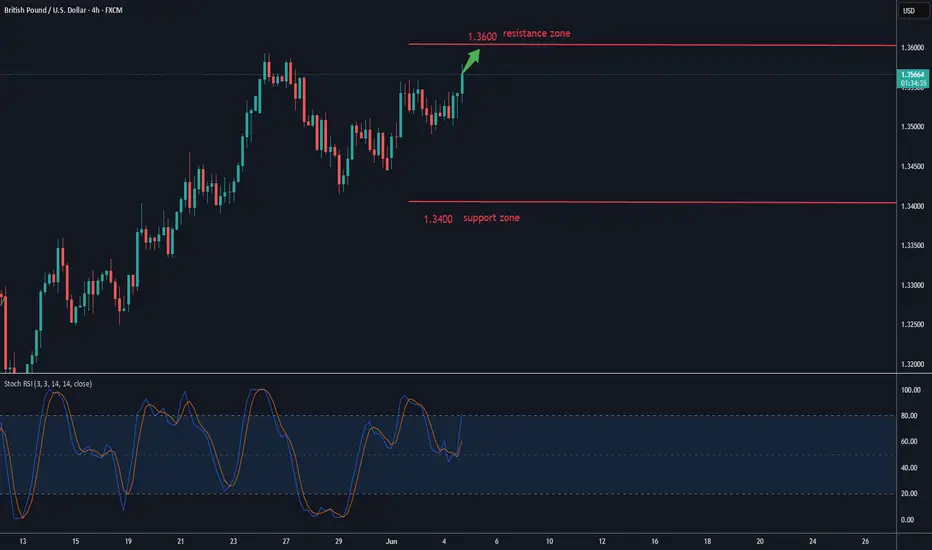
Can it break through 1.36?The GBP/USD exchange rate continued to trade in a high-range consolidation during the North American session, currently hovering near the 1.353 level with a slight intraday rebound. The US Dollar Index turned lower following the release of weak ADP employment data, providing some support for the British Pound. The US added only 37,000 jobs in the private sector in May, far below the market expectation of 115,000, reinforcing market bets on future Federal Reserve rate cuts. In the short term, the exchange rate may continue to consolidate within the range of 1.3450 to 1.3600. If the US non-farm payroll data remains weak, the exchange rate is expected to break above the 1.3600 level, opening up further upside potential.
Humans need to breathe, and perfect trading is like breathing—maintaining flexibility without needing to trade every market swing. The secret to profitable trading lies in implementing simple rules: repeating simple tasks consistently and enforcing them strictly over the long term.
GBP/USD : Ready for Fall (READ THE CAPTION)By examining the GBP/USD chart on the 4-hour timeframe, we can see that the price is currently trading within the 1.35 supply zone. If a strong rejection occurs from this level, we can expect further downside movement. The potential bearish targets are 1.34915 and 1.34500. Other key supply zones are located at 1.35520, 1.35730, and 1.35930.
Please support me with your likes and comments to motivate me to share more analysis with you and share your opinion about the possible trend of this chart with me !
Best Regards , Arman Shaban

First GU analysis, GU is heading towards resistanceGBPUSD has hit the old breakout support zone and is bouncing in today's US session. When GU closed above 1.351 on h1, it confirmed a nice BUY signal. Target is towards 1.355. In case it closes below 1.351, we have to wait for further confirmation to have a trading strategy.
Do you agree with me?

EURUSD and GBPUSD Breakout?Hello traders, this is a complete multiple timeframe analysis of this pair. We see could find significant trading opportunities as per analysis upon price action confirmation we may take this trade. Smash the like button if you find value in this analysis and drop a comment if you have any questions or let me know which pair to cover in my next analysis.

GU Bulls Raise "Flag" Eyeing Higher PricesFX:GBPUSD has formed a Bull Flag and we could be getting ready to see the Bulls take the spotlight!
After Price broke through the Previous Level of Structure, Price retraces the High of 1.35589 to the 50% Fibonacci Level @ 1.35022 and is supported pushing Price back up from the Previous Level of Structure.
-The 50% retracement signals the end of the Consolidation Phase of the Pattern.
Now with a Bull Flag being a Continuation Pattern, we can suspect that Price will give us a Bullish Breakout of the Descending Channel and Retest before moving higher Confirming the Pattern and once the Breakout is Validated!
Based off the "Flagpole" of the Pattern, if a Bullish Breakout is Validated and the Retest is Successful, the extension of the Set-up would place the Price Target @ 1.3640 which is at the next big level of Resistance.

Skeptic | GBP/USD Analysis: Breakout Triggers in the Box!Hey everyone, Skeptic here! FX:GBPUSD has been killing it with a solid uptrend but now it’s chilling in a correction phase, trapped in a box range. A break above or below this box could light up some epic triggers, so let’s dive into a multi-timeframe analysis to get the full picture.
🧠 Starting with the Daily Timeframe
we’re riding a powerful upward channel where price has been dancing perfectly with the ceiling, floor, and midline. We’ve nabbed some sweet trades from this setup before! After hitting resistance at 1.35576 , we slipped into a time-based correction.
Here’s the daily breakdown:
If the box floor at 1.35002 cracks, we could slide to 1.34173 , hitting the 0.382 Fibonacci retracement— a legit first support zone. 🎯
If we bust through the ceiling, the channel’s midline is our next target. But with lower highs forming, I’m betting on a deeper correction for now. 📉
With that intel, let’s zoom into the 4-Hour Timeframe for our main long and short triggers. 🔥
For longs, a break above 1.35576 is our golden ticket, with a stop loss below the box. Want a quicker R/R and early profits? Set a tighter stop below the 1H or 15-minute floor that forms. 💸 For shorts, we can play with a smaller stop loss. I’d jump in after breaking support at 1.35002 , with a stop loss at 1.35464 if we go bearish from here. If we test the box ceiling again before breaking the floor, the stop loss sits above the box. 🚨 Heads-up: longs are riskier based on the daily clues. As always, do your own research, steer clear of FOMO, and never forget—capital management and stop losses are your market lifelines. Nobody shouts about those enough! A single trade, good or bad, won’t make or break your long-term game, so skip the emotional drama and grind on your strategy and psychology.
💬 Let’s Talk!
If this recap got your gears turning, smash that boost—it means a lot! 😊 Got a pair or setup you want me to tackle next? Drop it in the comments. Thanks for vibing with me—keep trading sharp! ✌️

XAU/USD Weekly Forecast : First LONG, then SHORT! (READ CAPTION)By examining the gold chart on the 4-hour timeframe, we can see that after dropping to $3270, the price faced strong buying pressure and opened today’s session with a 100-pip gap at $3298, continuing its rally up to $3370. This bullish move could potentially extend toward $3400, but keep in mind that gold is likely to retrace soon to fill this price gap — so this scenario should definitely be considered!
