Final BTCUSD update..Good day traders, here is my final update on BTCUSD and I like how price has been respecting our PD arrays. Keep in mind traders price moving in waves and what again😂😂🏃🏾♂️, point is today is the last trading day for the week and my thoughts is that we can expect BTCUSD to start going higher today and tomorrow maybe till Tuesday …sorry I’m being too sure but if you focus on time and price you start to KNOW(ledge) things or maybe I should say secrets?!🤨🤔
I always expect price to manipulate higher if my bias is shorts, ICT’s power of 3 works wonders when it come to this thought process.
Watch how price reacts to the FVG where price is trading now, it’s not a signal just watch out price moves always from it for the rest of today.
We only going high to shoot lower…keep that in mind!!🤯
GBPUSD

GBPJPY update!!Good day traders, I’m back with yet another beautiful setup on GJ and I really wish we can all monitor how price plays out and learn more about price signature.
For this setup I’ll explain more about it after the fact because it’ll help me make my point clearer and easily understandable.
Yet another gift..🎁🧧

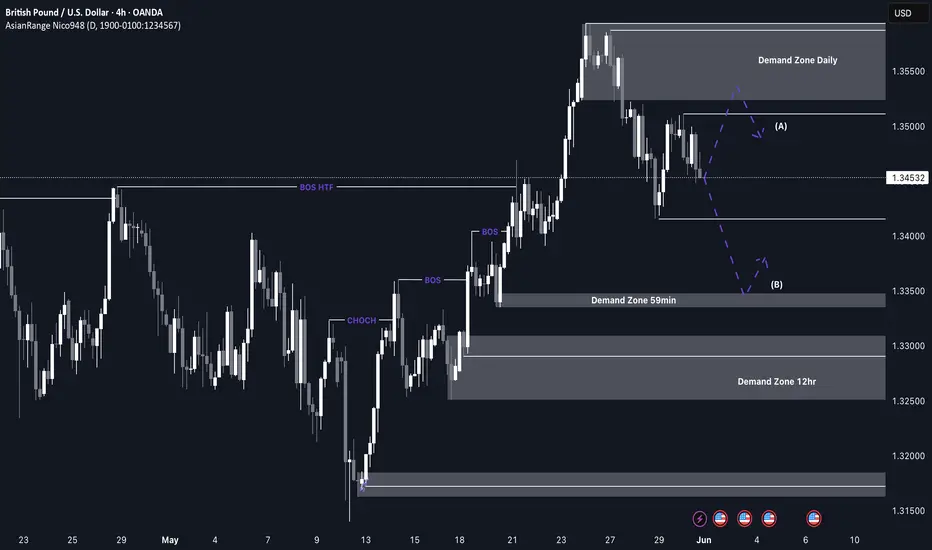
GBP/USD Shorts from the daily supplyI’m anticipating a potential retracement as price has been heavily bullish and is now beginning to show signs of being overbought. After recently breaking major structure to the upside, there’s room for a temporary sell-off as price corrects before continuing higher.
I’ll be watching for possible reactions from the 59-minute demand zone for a minor bounce, but the more ideal long opportunity would be at the 12H demand zone around 1.3300, where structure is cleaner and confluences align.
Confluences for Short-Term Sells:
- A recent change of character (CHOCH) to the downside signals a shift in momentum
- A clean daily supply zone has been left behind that could initiate a deeper pullback
- Significant liquidity below, including the Asia low, ready to be swept
- For price to maintain long-term bullish movement, it must first correct, fill imbalances, and mitigate valid demand levels
P.S. If price drops further and breaks structure, we’ll likely see a new supply zone form. This will provide a closer and more refined opportunity to participate in the move.
Stay sharp and trade safe! 📉📈
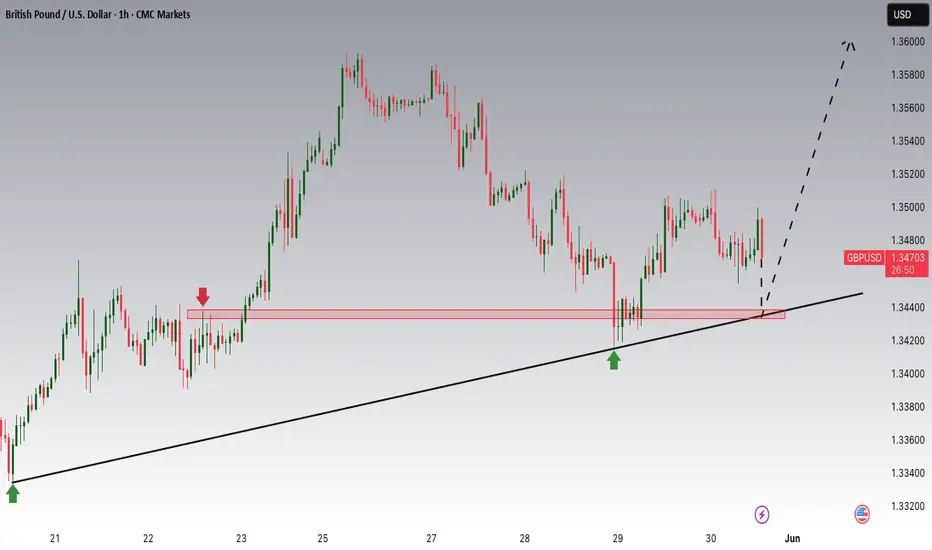
GBPUSD is Nearing an Important Support!!Hey Traders, in today's trading session we are monitoring GBPUSD for a buying opportunity around 1.34400 zone, GBPUSD is trading in an uptrend and currently is in a correction phase in which it is approaching the trend at 1.34400 support and resistance area.
Trade safe, Joe.
Gold at Key Rejection Zone: Will the Drop Resume from $3310?By examining the gold chart on the 4-hour timeframe, we can see that after some consolidation between $3294 and $3302, the price finally began a sharp drop, correcting down to $3245. This area was a key demand zone on lower timeframes, which triggered a rebound, and gold is now trading around $3310. If the price gets rejected from the $3310–$3313 zone, we can expect another potential decline.
Please support me with your likes and comments to motivate me to share more analysis with you and share your opinion about the possible trend of this chart with me !
Best Regards , Arman Shaban

Long term vision on Pound, seems bullish.Not muc to say, graph is so clear.
If we look at the long term chart - which starts in 2008 crisis, trend broken in 2024 summer.
We can see a clean breakout from the fallen wedge, also there is a cup % handle breakout in the last candle.
As a supporting point, my power indicators are also supporting a long signal.
So it's a clear bullish signal on my side.
Be aware that each candle represents 3 months.
Wondering about your thoughts!

GBPUSD Is Bearish! Short!
Here is our detailed technical review for GBPUSD.
Time Frame: 12h
Current Trend: Bearish
Sentiment: Overbought (based on 7-period RSI)
Forecast: Bearish
The market is trading around a solid horizontal structure 1.347.
The above observations make me that the market will inevitably achieve 1.325 level.
P.S
Please, note that an oversold/overbought condition can last for a long time, and therefore being oversold/overbought doesn't mean a price rally will come soon, or at all.
Disclosure: I am part of Trade Nation's Influencer program and receive a monthly fee for using their TradingView charts in my analysis.
Like and subscribe and comment my ideas if you enjoy them!

GBPUSD BULLISH OR BEARISH DETAILED ANALYSIS ??GBPUSD has successfully completed its retest of the 1.34300–1.34500 support zone and is now showing strong signs of resuming its bullish momentum. The recent structure confirms a classic bullish continuation pattern, as price bounced cleanly off a critical support level that previously acted as resistance. This level has now flipped into a solid demand zone, giving buyers confidence to push toward the 1.40000 psychological target. Price action continues to respect the uptrend with higher lows forming since mid-April, suggesting strength and institutional accumulation.
From a macroeconomic perspective, the British pound remains fundamentally supported. Recent UK inflation data surprised to the upside, causing the market to delay rate cut expectations from the Bank of England. In contrast, the US dollar is weakening due to rising expectations that the Federal Reserve could initiate rate cuts later this year as inflation cools and labor market data softens. This divergence in policy outlooks between the BoE and the Fed is fueling bullish pressure on GBPUSD, making the 1.40000 level a realistic and high-probability target.
Technical confluence also supports this bullish wave. Fibonacci retracement levels drawn from the recent swing low to the high align closely with the support zone at 1.34300, which acted as a perfect retest before the next leg higher. Additionally, the bullish engulfing candles and consistent daily closes above the support level add further confirmation to the upside bias. As long as the pair holds above 1.34300, the structure favors bulls with strong momentum to test and potentially break the 1.38000 intermediate level on the way to 1.40000.
GBPUSD remains a high-confidence bullish opportunity, aligning both technically and fundamentally. The recent breakout and retest phase is complete, and the pair now appears poised for a sustained rally. With bullish market sentiment, favorable UK data, and USD softness across the board, this setup offers an excellent risk-to-reward ratio for medium-term swing traders targeting the 1.40000 zone.

GBPUSD - Predictive Analysis & ForecastingGBPUSD
Scales
- S: 1.3169 activation triggers 1.3347 (unless falls to 1.3100)
- M1: 1.3426 activation triggers 1.3131 pivot
- M2: 13555 activation triggers 1.3109
- L: pending at 1.3664
Forecast & Targets
- ST: bearish risk down to 1.3100
- MT: bullish, up to 1.3664
#GBPUSD #Forex #CROW2.0
4xForecaster
------
Originally published on BlueSky

EURUSD,GBPUSD and AUDUSD Analysis todayHello traders, this is a complete multiple timeframe analysis of this pair. We see could find significant trading opportunities as per analysis upon price action confirmation we may take this trade. Smash the like button if you find value in this analysis and drop a comment if you have any questions or let me know which pair to cover in my next analysis.

Falling towards 61.8% Fibonacci support?The Cable (GBP/USD) is falling towards the pivot, which serves as pullback support and could bounce to the 1st resistance, which acts as pullback resistance.
Pivot: 1.3315
1st Support: 1.3159
1st Resistance: 1.3586
Risk Warning:
Trading Forex and CFDs carries a high level of risk to your capital and you should only trade with money you can afford to lose. Trading Forex and CFDs may not be suitable for all investors, so please ensure that you fully understand the risks involved and seek independent advice if necessary.
Disclaimer:
The above opinions given constitute general market commentary, and do not constitute the opinion or advice of IC Markets or any form of personal or investment advice.
Any opinions, news, research, analyses, prices, other information, or links to third-party sites contained on this website are provided on an "as-is" basis, are intended only to be informative, is not an advice nor a recommendation, nor research, or a record of our trading prices, or an offer of, or solicitation for a transaction in any financial instrument and thus should not be treated as such. The information provided does not involve any specific investment objectives, financial situation and needs of any specific person who may receive it. Please be aware, that past performance is not a reliable indicator of future performance and/or results. Past Performance or Forward-looking scenarios based upon the reasonable beliefs of the third-party provider are not a guarantee of future performance. Actual results may differ materially from those anticipated in forward-looking or past performance statements. IC Markets makes no representation or warranty and assumes no liability as to the accuracy or completeness of the information provided, nor any loss arising from any investment based on a recommendation, forecast or any information supplied by any third-party.

GBPUSD M15 | Bearish Drop Based on the M15 chart, the price is approaching our sell entry level at 1.3486, a pullback resistance that aligns close to the 50% Fibo retracement.
Our take profit is set at 1.3448, a pullback support.
The stop loss is set at 1.3520, an overlap resistance.
High Risk Investment Warning
Trading Forex/CFDs on margin carries a high level of risk and may not be suitable for all investors. Leverage can work against you.
Stratos Markets Limited (tradu.com ):
CFDs are complex instruments and come with a high risk of losing money rapidly due to leverage. 63% of retail investor accounts lose money when trading CFDs with this provider. You should consider whether you understand how CFDs work and whether you can afford to take the high risk of losing your money.
Stratos Europe Ltd (tradu.com ):
CFDs are complex instruments and come with a high risk of losing money rapidly due to leverage. 63% of retail investor accounts lose money when trading CFDs with this provider. You should consider whether you understand how CFDs work and whether you can afford to take the high risk of losing your money.
Stratos Global LLC (tradu.com ):
Losses can exceed deposits.
Please be advised that the information presented on TradingView is provided to Tradu (‘Company’, ‘we’) by a third-party provider (‘TFA Global Pte Ltd’). Please be reminded that you are solely responsible for the trading decisions on your account. There is a very high degree of risk involved in trading. Any information and/or content is intended entirely for research, educational and informational purposes only and does not constitute investment or consultation advice or investment strategy. The information is not tailored to the investment needs of any specific person and therefore does not involve a consideration of any of the investment objectives, financial situation or needs of any viewer that may receive it. Kindly also note that past performance is not a reliable indicator of future results. Actual results may differ materially from those anticipated in forward-looking or past performance statements. We assume no liability as to the accuracy or completeness of any of the information and/or content provided herein and the Company cannot be held responsible for any omission, mistake nor for any loss or damage including without limitation to any loss of profit which may arise from reliance on any information supplied by TFA Global Pte Ltd.
The speaker(s) is neither an employee, agent nor representative of Tradu and is therefore acting independently. The opinions given are their own, constitute general market commentary, and do not constitute the opinion or advice of Tradu or any form of personal or investment advice. Tradu neither endorses nor guarantees offerings of third-party speakers, nor is Tradu responsible for the content, veracity or opinions of third-party speakers, presenters or participants.

Euraud final forecast!!Good day traders, I’m back with yet another update on EurAud and this time we wanna see price shoots!!

Smart Money waits for the retracement, not the breakout.” TradingView chart for EUR/USD (30-minute )
🧠 Smart Money Concepts (SMC) Breakdown:
🟨 Bullish Zone (Demand)
Marked in yellow, this is the strong demand zone where price recently reversed.
This zone aligns with a potential order block or a liquidity grab.
🟩 Green Box (Potential Re-entry Zone)
This is your optimal trade entry (OTE) zone.
Price is expected to retrace to this zone after facing resistance at the red supply zone.
It aligns with the discount level (below 50% of recent move).
🟥 Red Box (Supply Zone / POI)
Price is currently reacting to this zone.
This may be a short-term rejection point leading to the expected retracement.
🟦 Blue Box (Higher-Timeframe POI / Supply)
A major target zone likely acting as liquidity above swing highs.
If price breaks and holds above red zone, this is the next target for longs.
🟩 Light Green Box (Final Target / Weekly Level)
Likely a weekly supply level or final target for a full bullish expansion.
---
📈 Projection (Dashed Arrows):
1. Short-Term Bearish Move: Price dips into green demand zone.
2. Long Entry from Demand: Potential bullish continuation from green zone to break above red.
3. Target Blue Supply: If red is broken, price will head to the blue zone next.
---
Highlight entry point near green box for 1:3+ RR.
Show retracement plan instead of immediate breakout.
Emphasize liquidity hunt at red zone before continuation.
“
---
Would you like me to do analysis of. Other pair , mention in comments,🖇️

GBP-USD Swing Long! Buy!
Hello,Traders!
GBP-USD is trading in an
Uptrend and the pair made
A retest of the horizontal
Support of 1.3419 from where
We are already seeing a
Bullish rebound so we will be
Expecting a further
Bullish move up
Buy!
Comment and subscribe to help us grow!
Check out other forecasts below too!
Disclosure: I am part of Trade Nation's Influencer program and receive a monthly fee for using their TradingView charts in my analysis.

Sterling Holds Ahead of U.S. GDPGBP/USD trades near 1.3435 on Thursday, pressured by a stronger US Dollar after a court blocked Trump’s “Liberation Day” tariffs, ruling he lacked authority to impose them. Markets now await preliminary US Q1 GDP data. Fed minutes showed rising uncertainty, with policymakers favoring a cautious, steady rate path. In the UK, food inflation rose for a fourth month, prompting Barclays to delay its rate cut forecast to February 2026, which may support the Pound.
The first critical support for gold is seen at 1.3425 and the first resistance is located at 1.3600.

GBP/USD – Correction in Progress - Where to buy?A few days ago, I pointed out that GBP/USD broke above key resistance from above 1.34, and even cleared the psychological barrier at 1.35.
That breakout opened the door for a potential move toward 1.4000, and I suggested that traders should look for buying opportunities on pullbacks.
Well — we’re in that pullback now.
So, where do we buy?
📍 The most obvious area is the old resistance around 1.3430. But here’s the catch:
GBP/USD is notorious for fakeouts and spikes.
If price tests that level, it could easily dip under 1.34, take out stops, and only then reverse to the upside.
🛡️ Bottom line: If you’re buying the dip, set your stop-loss wisely
Disclosure: I am part of Trade Nation's Influencer program and receive a monthly fee for using their TradingView charts in my analyses and educational articles.

GBPUSD corrective pullback supported at 1.3400The GBP/USD currency pair maintains a bullish sentiment, supported by a rising trendline and sustained higher lows. The recent intraday price action suggests a corrective pullback within an overall uptrend, indicative of a consolidation phase rather than a reversal.
Key Support Level: 1.3400
This level aligns with a previous consolidation zone and is acting as a pivotal support. A pullback toward this level could offer a potential buying opportunity, especially if bullish momentum returns.
Upside Targets (on bullish continuation from 1.3400):
1.3515 – Initial resistance from prior swing high
1.3580 – Intermediate resistance level
1.3630 – Long-term target and potential top of the current bullish channel
Bearish Scenario (if 1.3400 fails):
A daily close below 1.3400 would invalidate the current bullish setup, signaling a potential shift in trend. In that case:
Immediate support at 1.3360
Deeper retracement could extend to 1.3310
Conclusion
The broader trend in GBP/USD remains bullish, with the current consolidation viewed as a potential pullback rather than a reversal. The 1.3400 level is critical — a bounce from here could resume the uptrend toward 1.3630 over time. However, a break and close below 1.3400 would weaken the bullish case and open the door to further downside. Traders should monitor price action closely around this key level for confirmation.
This communication is for informational purposes only and should not be viewed as any form of recommendation as to a particular course of action or as investment advice. It is not intended as an offer or solicitation for the purchase or sale of any financial instrument or as an official confirmation of any transaction. Opinions, estimates and assumptions expressed herein are made as of the date of this communication and are subject to change without notice. This communication has been prepared based upon information, including market prices, data and other information, believed to be reliable; however, Trade Nation does not warrant its completeness or accuracy. All market prices and market data contained in or attached to this communication are indicative and subject to change without notice.

GBPUSD Pulls Back from July 2023 - Sep 2024 TrendlineThe GBP/USD pair is currently pulling back from a key resistance zone and trendline stretching from the peaks of July 2023 to September 2024. These levels coincide with previously oversold RSI readings seen during the same periods, raising the likelihood of a pullback.
This resistance aligns with the 1.3590 level, which also corresponds to the 1.272 Fibonacci extension of the long-term downtrend from the 2008 highs to the 2022 lows.
A clean break and sustained move above this level could open the way for further gains, targeting the 0.382 retracement zone and the previous highs from 2021 and 2016, between 1.42 and 1.47.
On the downside, if a pullback emerges—driven by overbought conditions or renewed dollar strength—a clear break below 1.3460 could extend selling pressure toward 1.33, 1.3240, and 1.3140.
- Razan Hilal, CMT

Fundamental Market Analysis for May 29, 2025 GBPUSDEvent to pay attention today:
15:30 EET. USD - Initial jobless claims
22:00 EET. USD - Bank of England Governor Andrew Bailey will deliver a speech.
GBPUSD:
GBP/USD pared further gains on Wednesday, stumbling for the second session in a row and falling below 1.3500 after failing to regain 1.3600 earlier this week. Sterling markets are retreating from the upper limit of the bullish trend that lifted GBPUSD to multi-year highs, but the momentum remains favourable for sterling buyers.
The latest minutes of the Federal Reserve (Fed) interest rate meeting held on 6-7 May showed that the Fed's wait-and-see stance has deep roots. At the last Fed meeting, policymakers noted that the US dollar's (USD) status as a safe haven has suffered recently. They warned that a more ‘durable change’ in the dollar's status could have long-term consequences for the US economy.
Almost all FOMC members at the May rate meeting agreed that inflation risks could prove to be more ‘persistent than expected.’ Fed officials directly pointed to tariffs as a key factor in the FOMC's downgrade of its outlook for the US economy, and the FOMC blamed the Trump administration and its inconsistent tariff policy for the deterioration in the US economic situation and uncertain outlook for inflation and growth.
The rest of the trading week remains tense for the US. On Thursday, US gross domestic product (GDP) growth for the first quarter will be released. On Friday, the trading week will end with the release of US personal consumption expenditure (PCE) inflation data for April. Markets are hoping for a continued easing of key inflation indicators before the effects of the Trump administration's tariff policy begin to be reflected in the core data.
Trading recommendation: BUY 1.3450, SL 1.3430, TP 1.3540

CONFLUENCE KEY GBPUSD SHORT FORECAST Q2 W22 D29 Y25GBPUSD SHORT FORECAST Q2 W22 D29 Y25
🔥👀QUICK SCOPE TECHNICAL REVERSAL HOT PICK
Professional Risk Managers👋
Welcome back to another FRGNT chart update📈
Diving into some Forex setups using predominantly higher time frame order blocks alongside confirmation breaks of structure.
Let’s see what price action is telling us today!
💡Here are some trade confluences📝
✅Weekly order block
✅15' order block
✅1 hour order block
✅Tokyo ranges to be filled
🔑 Remember, to participate in trading comes always with a degree of risk, therefore as professional risk managers it remains vital that we stick to our risk management plan as well as our trading strategies.
📈The rest, we leave to the balance of probabilities.
💡Fail to plan. Plan to fail.
🏆It has always been that simple.
❤️Good luck with your trading journey, I shall see you at the very top.
🎯Trade consistent, FRGNT X

GBPUSD | 27.05.2025SELL 1.35500 | STOP 1.36300 | TAKE 1.34440 | We expect a corrective movement downward from these levels, after the strong growth last week.

GBPUSD Decision Point | Will the Order Block Hold or Fold?GBPUSD | Smart Money Liquidity Trap or Bullish Breakout?
Here’s a high-probability play based on Order Blocks, Fair Value Gaps, and channel structure—one of the cleanest SMC setups on cable this week.
📊 1. Market Overview
GBPUSD is currently pulling back after a sharp drop, retesting the premium zone Order Block on the H1 timeframe.
Structure remains bullish inside the ascending channel, but there’s major indecision here—will it break above the OB, or retrace deeper into the Fair Value Gap zone?
🧠 2. Dual Bias Logic
You’ve mapped out two valid SMC scenarios (marked in red & blue arrows):
🔻 Scenario 1: Bearish Trap + Deep Liquidity Grab
Price reacts from the Order Block (purple zone)
Rejects and breaks down into the Fair Value Gap (FVG) zone near 1.33300
Targets liquidity resting below prior structure
🔺 Scenario 2: Order Block Respect + Long Continuation
OB holds, price flips bullish
Pushes above 1.35260 for bullish continuation
Final target near channel top @ 1.35920–1.36000 zone
Both scenarios are textbook Smart Money setups — based on how price reacts at this OB, we’ll get the direction.
🧱 3. Key Zones
🔵 Order Block: 1.3445 – 1.3526
🔴 Fair Value Gap (FVG): 1.3330 – 1.3283
🟢 Target (Bullish): 1.3600
🔻 Target (Bearish): 1.3280
⚖️ 4. Risk-Reward Potential
Whether you go long from the FVG or short from the OB, both have:
✅ Clean entries
✅ Clear invalidation zones
✅ Strong RRR potential (1:3 to 1:4+)
📌 5. Watchlist Note
💡 If price taps into the OB and shows weak momentum, prepare for shorts targeting the FVG
💡 If it holds the OB cleanly with bullish engulfing or BOS (break of structure), ride the long back to channel highs
💬 Call to Action:
📈 Add GBPUSD to your SMC sniper list this week
💬 Comment “OB or FVG? 🤔” if you're waiting to catch the bounce
📌 Save this post for Smart Money reference setups
