GBPUSD Decision Point | Will the Order Block Hold or Fold?GBPUSD | Smart Money Liquidity Trap or Bullish Breakout?
Here’s a high-probability play based on Order Blocks, Fair Value Gaps, and channel structure—one of the cleanest SMC setups on cable this week.
📊 1. Market Overview
GBPUSD is currently pulling back after a sharp drop, retesting the premium zone Order Block on the H1 timeframe.
Structure remains bullish inside the ascending channel, but there’s major indecision here—will it break above the OB, or retrace deeper into the Fair Value Gap zone?
🧠 2. Dual Bias Logic
You’ve mapped out two valid SMC scenarios (marked in red & blue arrows):
🔻 Scenario 1: Bearish Trap + Deep Liquidity Grab
Price reacts from the Order Block (purple zone)
Rejects and breaks down into the Fair Value Gap (FVG) zone near 1.33300
Targets liquidity resting below prior structure
🔺 Scenario 2: Order Block Respect + Long Continuation
OB holds, price flips bullish
Pushes above 1.35260 for bullish continuation
Final target near channel top @ 1.35920–1.36000 zone
Both scenarios are textbook Smart Money setups — based on how price reacts at this OB, we’ll get the direction.
🧱 3. Key Zones
🔵 Order Block: 1.3445 – 1.3526
🔴 Fair Value Gap (FVG): 1.3330 – 1.3283
🟢 Target (Bullish): 1.3600
🔻 Target (Bearish): 1.3280
⚖️ 4. Risk-Reward Potential
Whether you go long from the FVG or short from the OB, both have:
✅ Clean entries
✅ Clear invalidation zones
✅ Strong RRR potential (1:3 to 1:4+)
📌 5. Watchlist Note
💡 If price taps into the OB and shows weak momentum, prepare for shorts targeting the FVG
💡 If it holds the OB cleanly with bullish engulfing or BOS (break of structure), ride the long back to channel highs
💬 Call to Action:
📈 Add GBPUSD to your SMC sniper list this week
💬 Comment “OB or FVG? 🤔” if you're waiting to catch the bounce
📌 Save this post for Smart Money reference setups
GBPUSD

GBPUSD H1 | Bearish ContinuationBased on the H1 chart, the price is trading near our sell entry level at 1.3445, a pullback resistance.
Our take profit is set at 1.3360, a pullback support.
The stop loss is set at 1.3550, a pullback resistance.
High Risk Investment Warning
Trading Forex/CFDs on margin carries a high level of risk and may not be suitable for all investors. Leverage can work against you.
Stratos Markets Limited (tradu.com ):
CFDs are complex instruments and come with a high risk of losing money rapidly due to leverage. 63% of retail investor accounts lose money when trading CFDs with this provider. You should consider whether you understand how CFDs work and whether you can afford to take the high risk of losing your money.
Stratos Europe Ltd (tradu.com ):
CFDs are complex instruments and come with a high risk of losing money rapidly due to leverage. 63% of retail investor accounts lose money when trading CFDs with this provider. You should consider whether you understand how CFDs work and whether you can afford to take the high risk of losing your money.
Stratos Global LLC (tradu.com ):
Losses can exceed deposits.
Please be advised that the information presented on TradingView is provided to Tradu (‘Company’, ‘we’) by a third-party provider (‘TFA Global Pte Ltd’). Please be reminded that you are solely responsible for the trading decisions on your account. There is a very high degree of risk involved in trading. Any information and/or content is intended entirely for research, educational and informational purposes only and does not constitute investment or consultation advice or investment strategy. The information is not tailored to the investment needs of any specific person and therefore does not involve a consideration of any of the investment objectives, financial situation or needs of any viewer that may receive it. Kindly also note that past performance is not a reliable indicator of future results. Actual results may differ materially from those anticipated in forward-looking or past performance statements. We assume no liability as to the accuracy or completeness of any of the information and/or content provided herein and the Company cannot be held responsible for any omission, mistake nor for any loss or damage including without limitation to any loss of profit which may arise from reliance on any information supplied by TFA Global Pte Ltd.
The speaker(s) is neither an employee, agent nor representative of Tradu and is therefore acting independently. The opinions given are their own, constitute general market commentary, and do not constitute the opinion or advice of Tradu or any form of personal or investment advice. Tradu neither endorses nor guarantees offerings of third-party speakers, nor is Tradu responsible for the content, veracity or opinions of third-party speakers, presenters or participants.

GBP/USD Breakout (28.05.2025)The GBP/USD Pair on the M30 timeframe presents a Potential Selling Opportunity due to a recent Formation of a Breakout Pattern. This suggests a shift in momentum towards the downside in the coming hours.
Possible Short Trade:
Entry: Consider Entering A Short Position around Trendline Of The Pattern.
Target Levels:
1st Support – 1.3424
2nd Support – 1.3380
🎁 Please hit the like button and
🎁 Leave a comment to support for My Post !
Your likes and comments are incredibly motivating and will encourage me to share more analysis with you.
Best Regards, KABHI_TA_TRADING
Thank you.
Disclosure: I am part of Trade Nation's Influencer program and receive a monthly fee for using their TradingView charts in my analysis.

GBP/USD Got the Breakout - Can Bulls Hold the Higher-Low? GBP/USD has broken out to a fresh three-year-high, finally pushing above the Fibonacci level of 1.3414. That pushed directly into a test above the 1.3500 handle, and prices have since pulled back.
Given dynamics in the USD, that bullish trend in Cable remains of attraction if we do see USD-weakness continue. But, if strength remains in DXY and USD, there's greater pullback potential for GBP/USD, with supports at 1.3250 and 1.3000 of interest for longer-term strategies. And if looking for that USD-strength backdrop, EUR/USD can be a more attractive venue given the context of a lower-high there even as GBP/USD has ripped up to a three-year-high.
For short-term pullback scenarios, traders would likely want to see support retained at prior Fibonacci resistance, around 1.3414. - js

LONG GBP/USD — Trade IdeaLONG GBP/USD — Three Talking Points
Macro & Central-Bank Divergence
UK growth beats, retail sales jump and service-CPI re-accelerates to 5.4 % y/y. Markets have pushed BoE-cut odds to near-zero for June and just one 25 bp trim by year-end, while the Fed is still priced for two cuts in 2025.
IMF nudges 2025 UK GDP up to 1.2 %. In contrast, the dollar narrative is hampered by ballooning U.S. deficit worries and tariff-policy whiplash. Net policy path favours sterling over the dollar.
Technical Structure Remains Bullish
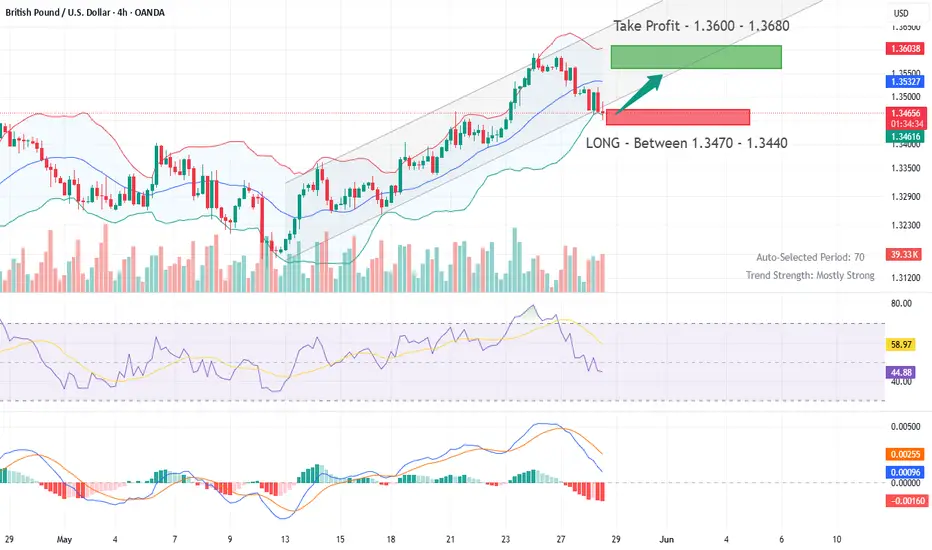
Price action is riding a January-origin ascending channel; Monday’s spike to 1.3600 set a new three-year high, but the pull-back stalled exactly where the 21-DMA, prior breakout shelf and channel floor cluster (mid-1.34s).
14-day RSI ≥ 60 yet still shy of overbought, signalling bullish momentum with room to run.
Holding the 1.3440/70 zone keeps the next leg toward 1.3600/1.3750 in play; only a daily close below 1.3370 would break the channel and negate the setup.
Event Risk Favouring Upside Skew
BoE speakers (Pill today, Bailey tomorrow) are likely to echo the “cautious & gradual” line—supportive, not dovish.
FOMC minutes may sound hawkish, but the market has largely heard it; any dovish nuance quickly re-ignites dollar selling.
Friday’s PCE vs. Tokyo CPI: a soft U.S. core PCE print alongside sticky Japan inflation would weigh on USDJPY and bleed into broader USD softness, lifting cable toward our T1/T2 objectives.
GBP/USD Correction Potentially Complete – Key Breakout LevelsHi everyone,
GBP/USD has been undergoing a short-term correction since the start of the week. Our view is that this correction may now be complete, with the bullish trend potentially resuming.
For confirmation, we’re watching for a break above the 1.35195 level, followed by a move through 1.35934.
If these levels are cleared, we anticipate further upside. We’ll continue to share updates on the projected path for GBP/USD should price action reach our key zone.
The longer-term outlook remains bullish, and we expect the rally to extend further from the 1.20991 January low.
We’ll be keeping you updated throughout the week with how we’re managing our active ideas. Thanks again for all the likes/boosts, comments and follows — we appreciate the support!
All the best for the week ahead. Trade safe.
BluetonaFX

GBP/USD Bearish Signal | Technical + Custom AlgoSmart Sell Signal | GBP/USD – Powered by Custom Algorithm & Technical Precision
This sell signal is generated by a proprietary trading system I’ve developed, combining pure technical trend logic with automated decision-making.
The algorithm:
Confirms reversal signals through layered filter logic
Defines clean entry, stop-loss, and target zones — all fully automated
No human judgment, no discretionary trades — just objective data turned into actionable analysis.
🧠 Built on precision. Backed by testing.
📉 Current outlook: Bearish sentiment confirmed on multi-timeframe structure.
📌 Disclaimer: This is not financial advice. For educational and analytical purposes only.

XAU/USD: Ready for another Decline? (READ THE CAPTION)By examining the #EURUSD chart on the 3-day timeframe, we can see that the price is currently trading around 1.132. If it manages to hold below 1.14, I expect further downside. The bearish targets are 1.12790, 1.11800, 1.10700, and 1.096 respectively.
Please support me with your likes and comments to motivate me to share more analysis with you and share your opinion about the possible trend of this chart with me !
Best Regards , Arman Shaban

GBP/USD Analysis: Price Searching for SupportGBP/USD Analysis: Price Searching for Support
In the second half of May, the British pound showed notable strength: from its 12 May low, GBP/USD climbed to a peak on 26 May — marking its highest level in over three years.
Demand for the pound has been driven by several factors:
→ A surge in inflation. CPI data released last Wednesday came in above expectations. As a result, market participants interpreted this as a reason for the Bank of England to remain cautious about cutting interest rates. Holding rates at elevated levels is generally considered bullish for the pound.
→ The pound’s relative resilience amid trade tensions, particularly following a newly signed agreement with the US, as well as strengthening trade ties between the UK and the EU.
Can the pound continue to rise? The GBP/USD chart offers reasons for doubt.
Technical Analysis of the GBP/USD Chart
Recent price movements have formed an ascending channel (outlined in blue), and earlier this week, demand was so strong that the pair briefly moved above the upper boundary. But what happened next?
That strong buying momentum appears to have faded — resulting in a sequence of lower highs (A→B→C→D), suggesting that the market may be searching for a foothold. Today’s bounce (highlighted by the arrow) hints that such a foothold may have been found. But how reliable is it? And can the uptrend be resumed?
→ From a bullish perspective: Support may be provided by the lower boundary of the channel, reinforced by the 1.345 level.
→ From a bearish perspective: The 1.352 level is acting as resistance, further strengthened by the median line.
It is possible that the area marked by lower highs (A→B→C→D) could ultimately prove to be an insurmountable barrier for the developing uptrend on the GBP/USD chart.
This article represents the opinion of the Companies operating under the FXOpen brand only. It is not to be construed as an offer, solicitation, or recommendation with respect to products and services provided by the Companies operating under the FXOpen brand, nor is it to be considered financial advice.

GBP/USD BEST PLACE TO SELL FROM|SHORT
Hello, Friends!
The BB upper band is nearby so GBP-USD is in the overbought territory. Thus, despite the uptrend on the 1W timeframe I think that we will see a bearish reaction from the resistance line above and a move down towards the target at around 1.334.
Disclosure: I am part of Trade Nation's Influencer program and receive a monthly fee for using their TradingView charts in my analysis.
✅LIKE AND COMMENT MY IDEAS✅

NZDCAD BULLISH OR BEARISH DETAILED ANALYSIS ??NZDCAD is currently coiling within a textbook bullish flag formation after an aggressive impulsive leg to the upside. Price action remains tight inside this consolidation structure, respecting both trendline resistance and support. As we approach the apex of this flag, I’m closely watching for a breakout confirmation to trigger the next bullish continuation leg toward the 0.8600 target.
From a macro perspective, the New Zealand dollar is gaining strength following the RBNZ’s firm stance on keeping rates elevated due to persistent inflation risks, particularly in housing and services. On the flip side, the Canadian dollar is showing relative weakness as oil prices stall and the Bank of Canada shifts toward a more dovish tone amid weaker economic data and slowing consumer spending. This divergence in central bank policy and economic outlook is building a strong fundamental case for NZDCAD upside.
Technically, the structure remains clean. The market formed a strong bullish engulfing rally earlier in April, and since then has entered a symmetrical correction with higher lows forming under compression. This is a classic continuation setup with strong momentum buildup underneath. A breakout above the 0.8280–0.8300 zone with volume would likely trigger institutional interest and drive price rapidly toward the 0.8600 level, which aligns with the measured move of the flag.
This is a high-probability trade idea supported by both technical and fundamental convergence. With risk well-defined below 0.8135 and momentum favoring the bulls, NZDCAD is one of my top setups going into June. Breakout traders and swing traders alike should keep this pair on the radar as the next bullish expansion looks imminent.

GBPUSD|SHORT"I’m sharing this analysis with you based on Fibonacci tools, a retraced descending channel, and key supply and demand zones."
its just my idea so use m/m

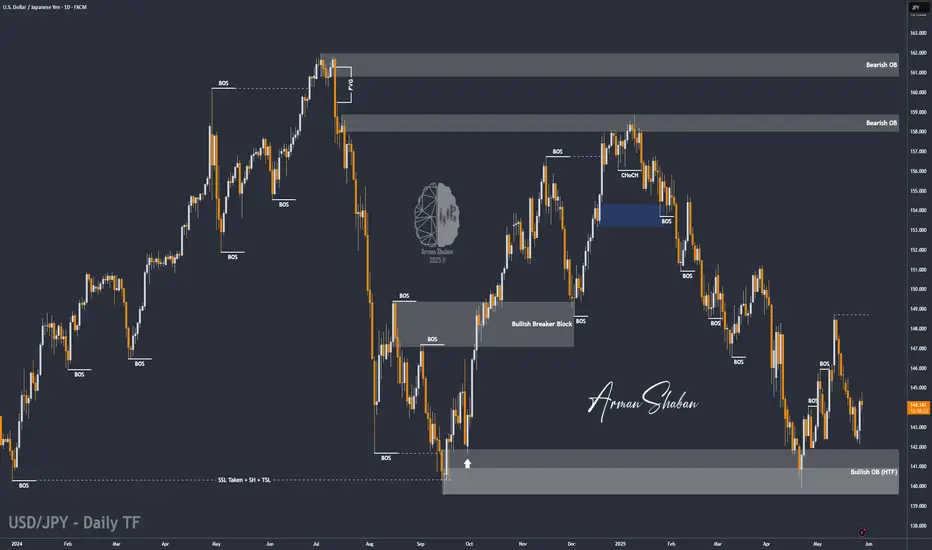
USD/JPY Poised for Upside: Momentum Building Toward Key TargetsBy examining the USD/JPY chart on the daily timeframe, we can see that the price is currently trading around 144. Given the momentum, I expect this pair to rise soon. The potential bullish targets are 145.5, 147.35, and 148.65 respectively.
Please support me with your likes and comments to motivate me to share more analysis with you and share your opinion about the possible trend of this chart with me !
Best Regards , Arman Shaban
GBPUSD H4 I Bearish Reversal Based on the H4 chart, the price is rising toward our sell entry level at 1.3547, a pullback resistance that aligns with the 61.8% Fibo retracement.
Our take profit is set at 1.3447, a pullback support.
The stop loss is set at 1.3611, above a swing high resistance.
High Risk Investment Warning
Trading Forex/CFDs on margin carries a high level of risk and may not be suitable for all investors. Leverage can work against you.
Stratos Markets Limited (tradu.com ):
CFDs are complex instruments and come with a high risk of losing money rapidly due to leverage. 63% of retail investor accounts lose money when trading CFDs with this provider. You should consider whether you understand how CFDs work and whether you can afford to take the high risk of losing your money.
Stratos Europe Ltd (tradu.com ):
CFDs are complex instruments and come with a high risk of losing money rapidly due to leverage. 63% of retail investor accounts lose money when trading CFDs with this provider. You should consider whether you understand how CFDs work and whether you can afford to take the high risk of losing your money.
Stratos Global LLC (tradu.com ):
Losses can exceed deposits.
Please be advised that the information presented on TradingView is provided to Tradu (‘Company’, ‘we’) by a third-party provider (‘TFA Global Pte Ltd’). Please be reminded that you are solely responsible for the trading decisions on your account. There is a very high degree of risk involved in trading. Any information and/or content is intended entirely for research, educational and informational purposes only and does not constitute investment or consultation advice or investment strategy. The information is not tailored to the investment needs of any specific person and therefore does not involve a consideration of any of the investment objectives, financial situation or needs of any viewer that may receive it. Kindly also note that past performance is not a reliable indicator of future results. Actual results may differ materially from those anticipated in forward-looking or past performance statements. We assume no liability as to the accuracy or completeness of any of the information and/or content provided herein and the Company cannot be held responsible for any omission, mistake nor for any loss or damage including without limitation to any loss of profit which may arise from reliance on any information supplied by TFA Global Pte Ltd.
The speaker(s) is neither an employee, agent nor representative of Tradu and is therefore acting independently. The opinions given are their own, constitute general market commentary, and do not constitute the opinion or advice of Tradu or any form of personal or investment advice. Tradu neither endorses nor guarantees offerings of third-party speakers, nor is Tradu responsible for the content, veracity or opinions of third-party speakers, presenters or participants.

GBPUSD potential longMulti-Timeframe Market Outlook
3-Month (3M) Timeframe
• Price broke below key psychological/liquidity level at 1.2100 in Q3 2022, reaching 1.0500, where significant bullish order flow was triggered.
• Bullish momentum brought price back above 1.2100, but lacked strength to reach next liquidity zone at 1.3900.
• After retracing to collect orders at 1.2100 again, price advanced to 1.3400, met resistance, and returned to 1.2100.
• Recent price action shows a break above 1.3400, signaling renewed bullish intent and momentum toward higher targets.
Monthly Timeframe
• Fully aligned with the 3M structure; no additional significant divergences to note.
• Continuation of higher timeframe bullish structure remains intact.
Weekly Timeframe
• Last week, price broke and closed above major resistance at 1.3400 with strong bullish momentum.
• Next liquidity target: 1.3650.
• Price consolidated below 1.3400 for 4 weeks, suggesting accumulation of bullish orders.
• Current retracement likely a pause to collect more orders before resuming towards 1.3650.
Daily Timeframe
• Strong order flow observed at 1.3150, followed by consolidation between 1.3250 – 1.3300 before breaking 1.3400.
• Price has retraced ~100 pips since yesterday, likely seeking a liquidity zone.
• 1.3400 remains the key level to monitor for renewed bullish interest and continuation toward 1.3650.
4H Timeframe
• Notable bullish order block formed at 1.3400, resulting in nearly 200-pip upside.
• Price appears to be retracing to this region, likely to collect more buy-side liquidity before another leg up.
• Confluence across timeframes suggests strong bullish bias if price holds above or reclaims 1.3400.
My thesis is long but I am very mindful of FOMC minutes today and I am waiting to see the impact that it will have on price action.

GBPUSD SHORT FORECAST Q2 W22 D28 Y25GBPUSD SHORT FORECAST Q2 W22 D28 Y25
🔥👀QUICK SCOPE TECHNICAL REVERSAL HOT PICK
Professional Risk Managers👋
Welcome back to another FRGNT chart update📈
Diving into some Forex setups using predominantly higher time frame order blocks alongside confirmation breaks of structure.
Let’s see what price action is telling us today!
💡Here are some trade confluences📝
✅Weekly order block
✅15' order block
✅Intraday bearish breaks of structure
✅Tokyo ranges to be filled
🔑 Remember, to participate in trading comes always with a degree of risk, therefore as professional risk managers it remains vital that we stick to our risk management plan as well as our trading strategies.
📈The rest, we leave to the balance of probabilities.
💡Fail to plan. Plan to fail.
🏆It has always been that simple.
❤️Good luck with your trading journey, I shall see you at the very top.
🎯Trade consistent, FRGNT X

Bullish continuation?GBP/USD is falling towards the support level which is an overlap support that is slightly above the 50% Fibonacci retracement and could bounce from this level to our take profit.
Entry: 1.3395
Why we like it:
There is an overlap support level that is slightly above the 50% Fibonacci retracement.
Stop loss: 1.3304
Why we like it:
There is a pullback support level that aligns with the 61.8% Fibonacci retracement.
Take profit: 1.3581
Why we like it:
There is a pullback support level.
Enjoying your TradingView experience? Review us!
Please be advised that the information presented on TradingView is provided to Vantage (‘Vantage Global Limited’, ‘we’) by a third-party provider (‘Everest Fortune Group’). Please be reminded that you are solely responsible for the trading decisions on your account. There is a very high degree of risk involved in trading. Any information and/or content is intended entirely for research, educational and informational purposes only and does not constitute investment or consultation advice or investment strategy. The information is not tailored to the investment needs of any specific person and therefore does not involve a consideration of any of the investment objectives, financial situation or needs of any viewer that may receive it. Kindly also note that past performance is not a reliable indicator of future results. Actual results may differ materially from those anticipated in forward-looking or past performance statements. We assume no liability as to the accuracy or completeness of any of the information and/or content provided herein and the Company cannot be held responsible for any omission, mistake nor for any loss or damage including without limitation to any loss of profit which may arise from reliance on any information supplied by Everest Fortune Group.

Bullish bounce?The Cable (GBP/USD) is falling towards the pivot which is an overlap support and could bounce to the 1st resistance.
Pivot: 1.3395
1st Support: 1.3317
1st Resistance: 1.3583
Risk Warning:
Trading Forex and CFDs carries a high level of risk to your capital and you should only trade with money you can afford to lose. Trading Forex and CFDs may not be suitable for all investors, so please ensure that you fully understand the risks involved and seek independent advice if necessary.
Disclaimer:
The above opinions given constitute general market commentary, and do not constitute the opinion or advice of IC Markets or any form of personal or investment advice.
Any opinions, news, research, analyses, prices, other information, or links to third-party sites contained on this website are provided on an "as-is" basis, are intended only to be informative, is not an advice nor a recommendation, nor research, or a record of our trading prices, or an offer of, or solicitation for a transaction in any financial instrument and thus should not be treated as such. The information provided does not involve any specific investment objectives, financial situation and needs of any specific person who may receive it. Please be aware, that past performance is not a reliable indicator of future performance and/or results. Past Performance or Forward-looking scenarios based upon the reasonable beliefs of the third-party provider are not a guarantee of future performance. Actual results may differ materially from those anticipated in forward-looking or past performance statements. IC Markets makes no representation or warranty and assumes no liability as to the accuracy or completeness of the information provided, nor any loss arising from any investment based on a recommendation, forecast or any information supplied by any third-party.

GBPUSD Near Key Resistance – Watching for PullbackGBPUSD has surged to test the 1.3538 resistance, forming a strong impulsive rally supported by higher lows and tight bullish consolidation patterns. However, price is now pressing into a major horizontal resistance and rising trendline, setting up for either continuation or correction.
Key Levels:
Major Resistance: 1.35389 (previous high, potential double top)
Trendline Support: ~1.3440 (ascending structure)
Downside Target (if break occurs): 1.3140 (range floor)
Scenarios to Watch:
🔹 Bearish Scenario (Primary Watch)
Price reacts to 1.3538 and forms a rejection candle
Break of the ascending trendline may trigger a retracement
Downside target zones:
1.3440 (initial structure)
1.3140 (major support zone)
🔹 Bullish Breakout (Alternate Scenario)
Clean break and close above 1.3538
Would invalidate short-term correction and open path to new highs
Momentum continuation possible toward 1.3600–1.3700
Pattern Notes:
Bullish structure with minor flags and wedges in the uptrend
But rally is extended and hitting overbought territory near resistance
RSI divergence or reversal patterns around this level would strengthen short case
Conclusion:
📌 GBPUSD is at a major resistance. Watch for rejection or breakout.
📌 If it holds below 1.3538 and breaks trendline, short setup is favored.
📌 If it breaks out above 1.3538 with volume, stay out of shorts and wait for retest.

GBPUSD: Bearish Trend Double Top/ M Formation has appeared on the peak of this uptrend. Maybe this could be used to start the downtrend for the next several days.

XAU/USD: Bull or Bear? Let's Find Out! (READ THE CAPTION)By examining the gold chart on the 4-hour timeframe, we can see that after our previous analysis, the price first corrected to the $3323 area and is currently trading around $3336. As mentioned in the previous analysis, as long as the price remains above $3313, we can expect further upside for gold. Based on the prior analysis, the next bullish targets are $3342, $3358, $3366, and $3394.
Please support me with your likes and comments to motivate me to share more analysis with you and share your opinion about the possible trend of this chart with me !
Best Regards , Arman Shaban

GBPUSD Will Fall! Short!
Please, check our technical outlook for GBPUSD.
Time Frame: 12h
Current Trend: Bearish
Sentiment: Overbought (based on 7-period RSI)
Forecast: Bearish
The market is approaching a key horizontal level 1.355.
Considering the today's price action, probabilities will be high to see a movement to 1.336.
P.S
Overbought describes a period of time where there has been a significant and consistent upward move in price over a period of time without much pullback.
Disclosure: I am part of Trade Nation's Influencer program and receive a monthly fee for using their TradingView charts in my analysis.
Like and subscribe and comment my ideas if you enjoy them!

Double Top Alert: Key Resistance at 1.3570 Before US PCE DataGBPUSD PLAN – MAY 27 | Double Top Alert: Key Resistance at 1.3570 Before US PCE Data
GBPUSD is currently testing a critical resistance zone near 1.3570, forming a potential Double Top pattern. As markets await this week’s US Core PCE inflation release, the pair may be at risk of a short-term pullback.
🌍 MACRO FUNDAMENTALS
USD Rebounds Slightly ahead of April’s PCE inflation report – a key Fed inflation gauge due this Friday.
GBP Under Pressure as dovish tones from Bank of England (BoE) officials signal a potential pause in rate hikes.
UK Political Uncertainty and sluggish EU-UK trade talks continue to dampen investor confidence in the pound.
📊 TECHNICAL ANALYSIS
Price Structure: GBPUSD surged from 1.3446 support but is now facing resistance near 1.3570, where a Double Top formation is emerging.
Key Levels:
Resistance: 1.3570 – 1.3580 (previous high and psychological barrier)
Support 1: 1.3496 (confluence of EMA89 and 38.2% Fibonacci retracement)
Support 2: 1.3446
Indicators:
EMA13, EMA34 show early signs of bearish crossover on the 30-minute chart.
RSI approaches overbought territory, hinting at potential bearish divergence.
🎯 TRADE SETUP (IF PRICE REJECTS 1.3570)
🔻 SELL SETUP
Entry: 1.3570 – 1.3550
Stop-Loss: 1.3595
Take-Profit Targets:
TP1: 1.3496
TP2: 1.3446
📌 A bullish breakout only becomes valid if price closes strongly above 1.3590 on the H1 chart.
🧠 STRATEGIC NOTES
Wait for a clear reaction or bearish confirmation near 1.3570 before entering trades.
Avoid chasing trades mid-range; focus on clean breakouts or rejections.
PCE data may trigger volatility — manage risk tightly and prepare for directional momentum.
👉 What do you think of this Double Top scenario? Will GBPUSD reject or break through resistance? Drop your analysis below and follow for daily structured plans!
