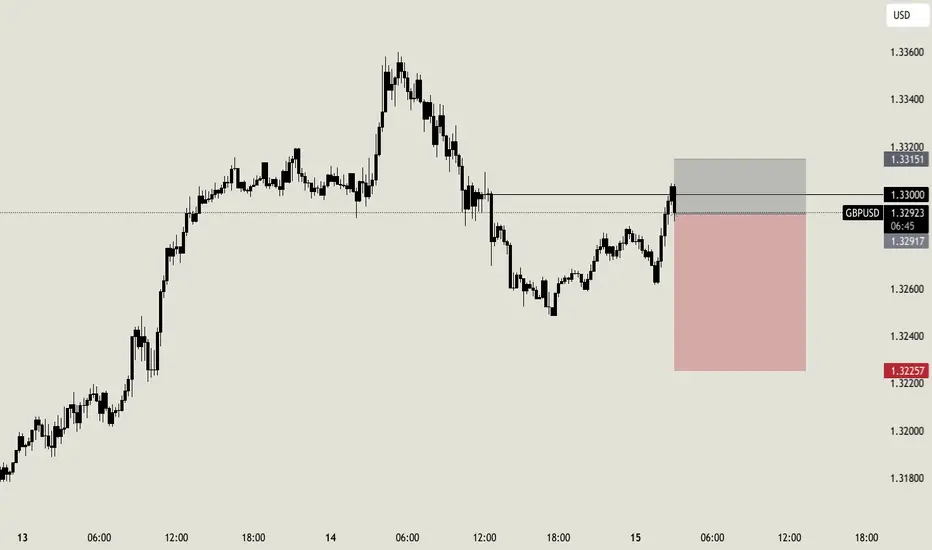
GBPUSD: Bearish Move Confirmed?! 🇬🇧🇺🇸
GBPUSD looks bearish after a release of UK GDP this morning.
I see a strong bearish imbalance after a test of a key horizontal resistance
and a confirmed Change of Character CHoCH as a confirmation.
I expect a bearish continuation at least to 1.3224
❤️Please, support my work with like, thank you!❤️
I am part of Trade Nation's Influencer program and receive a monthly fee for using their TradingView charts in my analysis.
GBPUSD

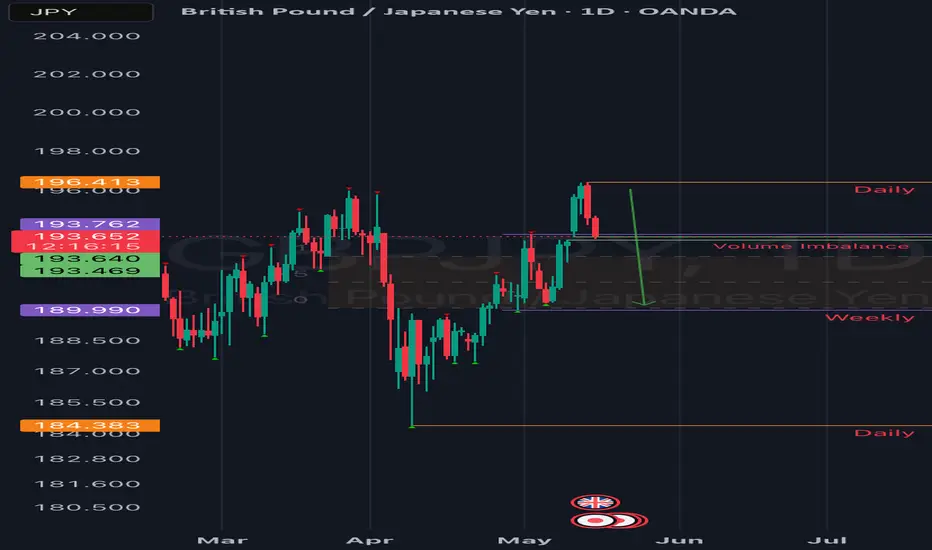
GBPJPY( British pound my banker!)Good day traders, I’m back with another idea on GbPJPY but this one is based on the strength and weakness of the pound itself. Before you ask what I mean…on this respective TF we had a break of structure higher(strength) but we saw price immediately move lower showing some weakness in price.
For the rest of the London session we can expect price to move higher on that volume imbalance to start the New York session. The rectangle is a balanced price range.
GBPUSD INTRADAY sideways consolidation support at 1.3200The GBP/USD pair continues to exhibit a bullish longer-term trend, underpinned by a series of higher highs and higher lows. However, recent price action shows consolidation within a sideways trading range, suggesting a pause or potential accumulation before the next directional move.
The key technical level to monitor is 1.3200, which aligns with a prior consolidation zone and serves as a critical support area. A corrective pullback towards this level could present a buying opportunity, particularly if price action forms a bullish reversal pattern around this zone. A successful rebound from 1.3200 would likely target resistance levels at 1.3400, followed by 1.3445 and 1.3500 on a longer-term basis.
Conversely, a daily close below 1.3200 would invalidate the current bullish bias and suggest a shift in sentiment. This scenario opens the door for further downside towards the next support at 1.3160, with extended losses potentially reaching 1.3116.
Conclusion:
While the broader trend remains bullish, GBP/USD is currently range-bound. Traders should watch for a reaction around the 1.3200 level. A bounce would reinforce bullish momentum towards 1.3400 and beyond, whereas a confirmed break below this level would signal further weakness and a possible trend shift in the near term.
This communication is for informational purposes only and should not be viewed as any form of recommendation as to a particular course of action or as investment advice. It is not intended as an offer or solicitation for the purchase or sale of any financial instrument or as an official confirmation of any transaction. Opinions, estimates and assumptions expressed herein are made as of the date of this communication and are subject to change without notice. This communication has been prepared based upon information, including market prices, data and other information, believed to be reliable; however, Trade Nation does not warrant its completeness or accuracy. All market prices and market data contained in or attached to this communication are indicative and subject to change without notice.

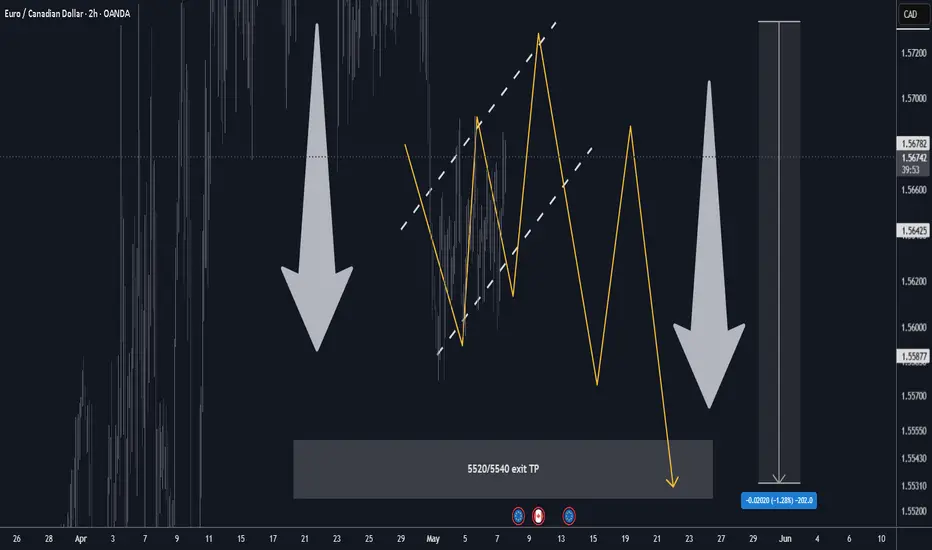
EURCAD H2 Best Level to SHORT/HOLD +100/+200 pips🏆 EURCAD Market Update H2 chart
📊 Technical Outlook
🔸broke down on high vol
🔸compression BEAR FLAG
🔸Mid-term: BEARS 5500
🔸Status: compression/dump
🔸5710/5720 heavy S/R BEARS
🔸5520/5540 key s/r zones below
🔸Price Target Bears: 5520
🔸final pump possible
🔸strategy: SHORT SELL 5710/5720
🔸SL 40 pips TP1 +100 pips TP2 +200 pips
🔸swing trade setup for patient traders
📊 Forex Market Update (May 7, 2025)
🇪🇺 EUR/USD
📉 Price: \~1.1370
USD strength ahead of Fed dampens Euro
German HCOB Services PMI fell in April; ECB rate-cut bets rising
Key Levels: Support 1.1320 | Resistance 1.1380
🇬🇧 GBP/USD
📉 Price: \~1.3320 (slid from recent highs)
Modest USD buying ahead of Fed decision
BoE policy caution keeps Pound in check
Key Levels: Support 1.3300 | Resistance 1.3400
🇺🇸 DXY (US Dollar Index)
📈 Price: \~99.39
Supported by rising U.S. yields and Fed rate-cut delays
Pressured by strategic uncertainty and trade tensions
Key Levels: Support 98.00 | Resistance 100.00
DXY Analysis (Updated)Here is an updated DXY and Forex analysis as per my last one. Let me know what you think!
- R2F Trading

Cable H1 | Falling toward a 50% Fibonacci supportCable (GBP/USD) is falling towards a multi-swing-low support and could potentially bounce off this level to climb higher.
Buy entry is at 1.3254 which is a multi-swing-low support that aligns with the 50.0% Fibonacci retracement.
Stop loss is at 1.3200 which is a level that lies underneath an overlap support and the 61.8% Fibonacci retracement.
Take profit is at 1.3349 which is a swing-high resistance.
High Risk Investment Warning
Trading Forex/CFDs on margin carries a high level of risk and may not be suitable for all investors. Leverage can work against you.
Stratos Markets Limited (tradu.com):
CFDs are complex instruments and come with a high risk of losing money rapidly due to leverage. 63% of retail investor accounts lose money when trading CFDs with this provider. You should consider whether you understand how CFDs work and whether you can afford to take the high risk of losing your money.
Stratos Europe Ltd (tradu.com):
CFDs are complex instruments and come with a high risk of losing money rapidly due to leverage. 63% of retail investor accounts lose money when trading CFDs with this provider. You should consider whether you understand how CFDs work and whether you can afford to take the high risk of losing your money.
Stratos Global LLC (tradu.com):
Losses can exceed deposits.
Please be advised that the information presented on TradingView is provided to Tradu (‘Company’, ‘we’) by a third-party provider (‘TFA Global Pte Ltd’). Please be reminded that you are solely responsible for the trading decisions on your account. There is a very high degree of risk involved in trading. Any information and/or content is intended entirely for research, educational and informational purposes only and does not constitute investment or consultation advice or investment strategy. The information is not tailored to the investment needs of any specific person and therefore does not involve a consideration of any of the investment objectives, financial situation or needs of any viewer that may receive it. Kindly also note that past performance is not a reliable indicator of future results. Actual results may differ materially from those anticipated in forward-looking or past performance statements. We assume no liability as to the accuracy or completeness of any of the information and/or content provided herein and the Company cannot be held responsible for any omission, mistake nor for any loss or damage including without limitation to any loss of profit which may arise from reliance on any information supplied by TFA Global Pte Ltd.
The speaker(s) is neither an employee, agent nor representative of Tradu and is therefore acting independently. The opinions given are their own, constitute general market commentary, and do not constitute the opinion or advice of Tradu or any form of personal or investment advice. Tradu neither endorses nor guarantees offerings of third-party speakers, nor is Tradu responsible for the content, veracity or opinions of third-party speakers, presenters or participants.

GBPUSD Daily tradeGBPUSD showing us a nice scalp intraday trade. It's performing a nice reversal pattern with a double breakout. Current price is also on important level that will probably act as resistance.
GU-Thu-15/05/25 TDA-Tricky zone, open for both direction!Analysis done directly on the chart
Follow for more, possibly live trade updates!
Knowledge per se won't make you money, it is
applying the knowledge and in this case in trading
doing live trades will make you money.
What's your view on this? Comment down below!
Not financial advice, DYOR.
Market Flow Strategy
Mister Y

GBPUSD SHORT FORECAST Q2 W20 D15 Y25GBPUSD SHORT FORECAST Q2 W20 D15 Y25
Professional Risk Managers👋
Welcome back to another FRGNT chart update📈
Diving into some Forex setups using predominantly higher time frame order blocks alongside confirmation breaks of structure.
Let’s see what price action is telling us today!
💡Here are some trade confluences📝
✅Weekly order block rejection
✅Daily order block rejection
✅Intraday 15' order blocks
✅Tokyo ranges to be filled
🔑 Remember, to participate in trading comes always with a degree of risk, therefore as professional risk managers it remains vital that we stick to our risk management plan as well as our trading strategies.
📈The rest, we leave to the balance of probabilities.
💡Fail to plan. Plan to fail.
🏆It has always been that simple.
❤️Good luck with your trading journey, I shall see you at the very top.
🎯Trade consistent, FRGNT X

Bearish drop?The Cable (GBP/USD) is rising towards the pivot and could reverse to the 1st support.
Pivot: 1.3292
1st Support: 1.3223
1st Resistance: 1.3318
Risk Warning:
Trading Forex and CFDs carries a high level of risk to your capital and you should only trade with money you can afford to lose. Trading Forex and CFDs may not be suitable for all investors, so please ensure that you fully understand the risks involved and seek independent advice if necessary.
Disclaimer:
The above opinions given constitute general market commentary, and do not constitute the opinion or advice of IC Markets or any form of personal or investment advice.
Any opinions, news, research, analyses, prices, other information, or links to third-party sites contained on this website are provided on an "as-is" basis, are intended only to be informative, is not an advice nor a recommendation, nor research, or a record of our trading prices, or an offer of, or solicitation for a transaction in any financial instrument and thus should not be treated as such. The information provided does not involve any specific investment objectives, financial situation and needs of any specific person who may receive it. Please be aware, that past performance is not a reliable indicator of future performance and/or results. Past Performance or Forward-looking scenarios based upon the reasonable beliefs of the third-party provider are not a guarantee of future performance. Actual results may differ materially from those anticipated in forward-looking or past performance statements. IC Markets makes no representation or warranty and assumes no liability as to the accuracy or completeness of the information provided, nor any loss arising from any investment based on a recommendation, forecast or any information supplied by any third-party.

Could the Cable bounce from here?GBP/USD is falling towards the support level which is a pullback support that lines up with the 61.8% Fibonacci retracement and could bounce from this level to our take profit.
Entry: 1.3210
Why we like it:
There is a pullback support that lines up with the 61.8% Fibonacci retracement.
Stop loss: 1.3144
Why we like it:
There is a pullback support level that lines up with the 78.6% Fibonacci projection.
Take profit: 1.3345
Why we like it:
There is a pullback resistance level.
Enjoying your TradingView experience? Review us!
Please be advised that the information presented on TradingView is provided to Vantage (‘Vantage Global Limited’, ‘we’) by a third-party provider (‘Everest Fortune Group’). Please be reminded that you are solely responsible for the trading decisions on your account. There is a very high degree of risk involved in trading. Any information and/or content is intended entirely for research, educational and informational purposes only and does not constitute investment or consultation advice or investment strategy. The information is not tailored to the investment needs of any specific person and therefore does not involve a consideration of any of the investment objectives, financial situation or needs of any viewer that may receive it. Kindly also note that past performance is not a reliable indicator of future results. Actual results may differ materially from those anticipated in forward-looking or past performance statements. We assume no liability as to the accuracy or completeness of any of the information and/or content provided herein and the Company cannot be held responsible for any omission, mistake nor for any loss or damage including without limitation to any loss of profit which may arise from reliance on any information supplied by Everest Fortune Group.

GBPUSD 1H (BOS 1H + OB + 0.5 FIB level + volume)Hello traders!
As you can see we have BOS on 1H after LG. I expecting reversal and mitigation our OB + 0.5 Fib level + horizontal level
Have a profitable day and don't forget to subscribe for updates!

#GBPUSD: Risk Entry Vs Safe Entry, Which One Would You Chose? The GBPUSD currency pair presents two promising opportunities for entry, potentially generating gains exceeding 500 pips. However, entering these markets carries a substantial risk of stop-loss hunting during the commencement of the week. Conversely, adopting a safe entry strategy offers a favourable chance for a bullish position.
We encourage you to share your thoughts and feedback on our ideas. ❤️🚀
Team Setupsfx_

GBPUSD: Market Sentiment & Price Action
The price of GBPUSD will most likely collapse soon enough, due to the supply beginning to exceed demand which we can see by looking at the chart of the pair.
Disclosure: I am part of Trade Nation's Influencer program and receive a monthly fee for using their TradingView charts in my analysis.
❤️ Please, support our work with like & comment! ❤️

GBPUSD Rejected Key Resistance – Bearish Continuation in Play?
**Pair:** GBPUSD
**Current Price:** ~1.3340
**Bias:** Bearish
---
**Analysis:**
GBPUSD has rejected a key resistance level around **1.3340**, which has historically acted as a strong barrier. After multiple failed attempts to break above, price formed a **lower high** and is now pushing lower with bearish momentum.
The recent move suggests a shift in sentiment, with sellers likely aiming for the next key levels near **1.3000** and potentially **1.2800**, where prior support zones exist.
---
**Technical Highlights:**
- **Resistance Level:** 1.3340 (historical supply zone)
- **Market Structure:** Lower highs, early signs of bearish trend
- **Target Zone:** 1.3000 – 1.2800
- **Invalidation:** Sustained move above 1.3500
---
**Trade Idea (Not Financial Advice):**
Look for potential short opportunities on lower timeframes, ideally after a bearish retest near 1.3340 with confirmation.
---
> **Disclaimer:**
> This analysis is for educational purposes only and does not constitute financial advice. Trading involves significant risk, and you should always conduct your own research and use proper risk management. Past performance does not guarantee future results.

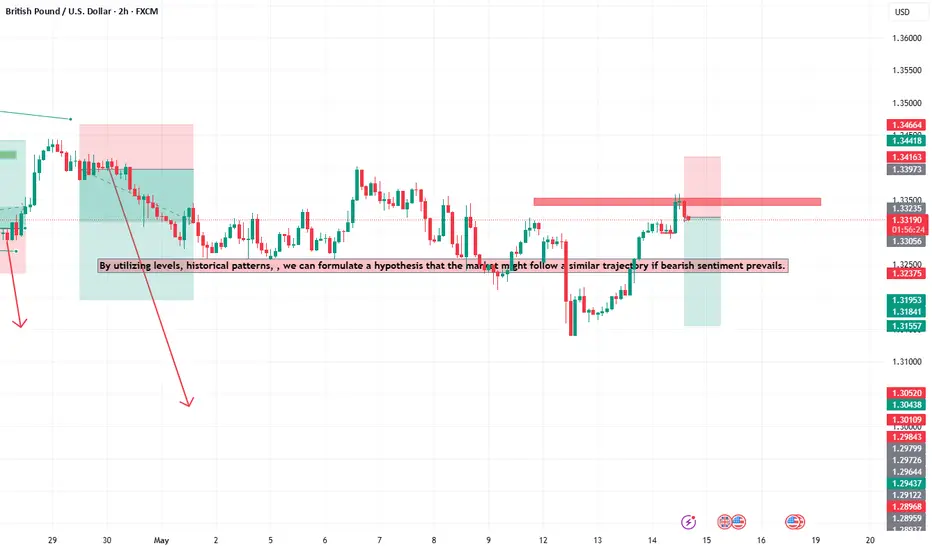
GBPUSD SELL/SHORTBy utilizing levels, historical patterns, , we can formulate a hypothesis that the market might follow a similar trajectory if bearish sentiment prevails.
GBPUSD Setup 14.05.2025GBPUSD – Long Setup Pending (May 14, 2025)
Price is approaching a 30m Fair Value Gap (FVG) created after a strong impulsive move. If price taps into the FVG zone at 1.33270–1.33160 and shows a bullish reaction (engulfing or strong rejection wick), it presents a high-probability long setup.
Entry: On bullish confirmation inside FVG (1.33270–1.33160)
Stop Loss: 1.33118 (below FVG)
Target: 1.33760
RR: ~1:3
Wait for clear bullish price action before entering. No entry if FVG fails or price drops through without reaction.
Support, follow, like and comment.

GBPUSD LIVE TRADE AND EDUCATIONAL BREAKDOWN FOR BEGINNERS 218PIPGBP/USD holds recovery gains near 1.3350 as US Dollar loses further ground
GBP/USD is trading near 1.3350 in Wednesday’s European session, extending Tuesday's 1% rally. The pair capitalizes on renewed US Dollar sell-off even as risk sentiment turns negative. Fedspeak and trade talks remain in focus.

GBPUSD Analysis🔁 GBPUSD update!
As our followers know,
we previously took a great profit from this level (see pinned idea below).💸
Now, that level is broken and we are patiently waiting for a pullback to enter a short trade.🔻
***If the price breaks above, we may switch to a buy setup — let’s wait for a clear signal!🕵️
For detailed entry points, trade management, and high-probability setups, follow the channel:
ForexCSP

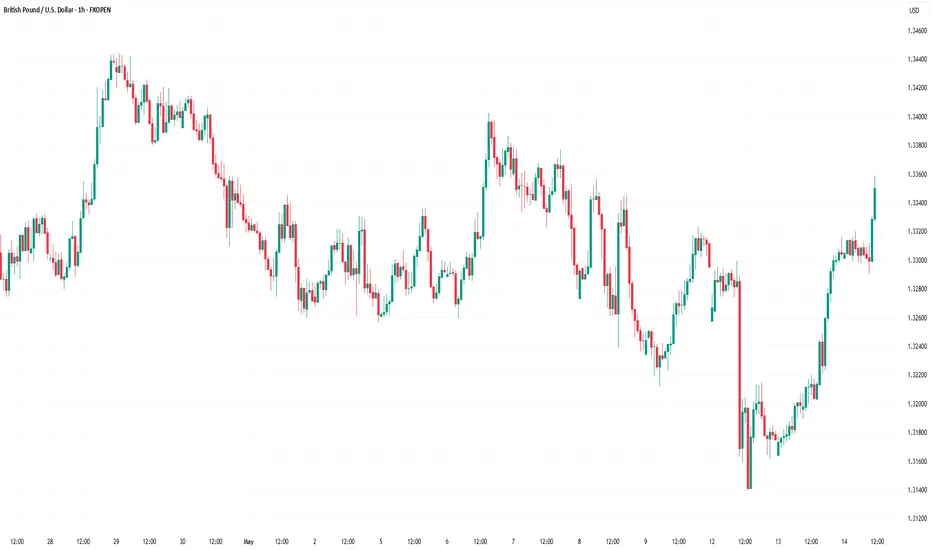
Market Analysis: GBP/USD Edges HigherMarket Analysis: GBP/USD Edges Higher
GBP/USD is attempting a fresh increase above the 1.3270 resistance.
Important Takeaways for GBP/USD Analysis Today
- The British Pound is attempting a fresh increase above 1.3250.
- There was a break above a key bearish trend line with resistance at 1.3270 on the hourly chart of GBP/USD at FXOpen.
GBP/USD Technical Analysis
On the hourly chart of GBP/USD at FXOpen, the pair declined after it failed to clear the 1.3440 resistance. As mentioned in the previous analysis, the British Pound traded below the 1.3200 support against the US Dollar.
Finally, the pair tested the 1.3140 zone and is currently attempting a fresh increase. The bulls were able to push the pair above the 50-hour simple moving average and 1.3215.
There was a break above a key bearish trend line with resistance at 1.3270. The pair surpassed the 50% Fib retracement level of the downward move from the 1.3402 swing high to the 1.3139 low. It is now showing positive signs above 1.3300.
On the upside, the GBP/USD chart indicates that the pair is facing resistance near 1.3340 and the 76.4% Fib retracement level of the downward move from the 1.3402 swing high to the 1.3139 low.
The next major resistance is near 1.3400. A close above the 1.3400 resistance zone could open the doors for a move toward 1.3440. Any more gains might send GBP/USD toward 1.3500.
On the downside, immediate support is near 1.3270. If there is a downside break below 1.3270, the pair could accelerate lower. The first major support is near the 1.3215 level and the 50-hour simple moving average.
The next key support is seen near 1.3140, below which the pair could test 1.3080. Any more losses could lead the pair toward the 1.3000 support.
This article represents the opinion of the Companies operating under the FXOpen brand only. It is not to be construed as an offer, solicitation, or recommendation with respect to products and services provided by the Companies operating under the FXOpen brand, nor is it to be considered financial advice.
GU-Mon-12/05/25 TDA-Bulls and bears fighting strong!Analysis done directly on the chart
Ahead of GBP claimant count change and
US CPI I'll be cautious and lower my risks or
preserve the capital for more clarity after
the news events.
Not financial advice, DYOR.
Market Flow Strategy
Mister Y

GU-Wed-14/05/25 TDA-US CPI softens slightly, GU is rallying up!Analysis done directly on the chart
Follow for more, possible live trade updates!
Post trade analysis opened on Mon:
-Mistake: setting too wide tp ahead of US CPI
-Lesson learned: 3 types of tp set
1) Strong fundamental back up, wide tp (relying to push through levels)
2) Medium fundamental back up, tp to next major resistances (1h+)
3) No fundamental back up, tight tp and no holding
Always doing post trade analysis is really good and super
useful. By understanding if it was a technical problem, emotional
problem, fundamentally not understanding problem etc.
I advise you to do the same for each trade!
Comment down below what do you think!
Not financial advice, DYOR.
Market Flow Strategy
Mister Y

GBP/USD Bulls Are Back? Institutions Are Loading Up1. Price Action & Zone Mapping
GBP/USD is consolidating above 1.3300 after a strong bullish reaction near the demand zone between 1.3040 and 1.3150 — an area that has already rejected price twice in recent months.
While the market structure still shows lower highs, the weekly candlestick formation signals a clear loss of bearish momentum. On the upside, the 1.3500–1.3600 zone remains the key supply area to break for a structural reversal to be confirmed.
2. COT Report – Institutional Positioning (as of May 6, 2025)
Non-Commercials (speculators) added +3,320 long positions and reduced -1,956 shorts, bringing the net long to +7,683 contracts — a strong bullish signal.
Commercials remain net short, but not with increasing aggression.
👉 The net positioning supports continued bullish bias, aligned with the recent technical rebound.
3. USD Index – Opposite Positioning
Non-Commercials increased both longs and shorts slightly on the US Dollar Index, but net positioning remains neutral with a slight bearish tilt.
This suggests a phase of indecision or mild retracement in the dollar, which indirectly supports GBP/USD upside.
4. GBP/USD Seasonality – Historical Behavior in May
According to MarketBulls data, May tends to be neutral-to-weak for the pair:
15-year avg: +0.0023
5-year avg: -0.016
2-year avg: +0.0069
Overall, this supports a ranging or corrective phase — not a high-conviction trending month. A breakout may need more confirmation.
5. Retail Sentiment
Currently, 60% of retail traders are short GBP/USD, with an average price of 1.2959, while only 40% are long from 1.3337.
👉 This imbalance favors a contrarian bullish narrative, especially if the market decides to run stops below 1.3300.
✅ Operational Outlook
GBP/USD is showing bullish consolidation signs, backed by:
Increasing institutional long interest
Contrarian retail sentiment (potential fuel for rallies)
Solid demand near 1.3040–1.3150
However, neutral seasonality and lack of structural breakout advise caution. A pullback towards 1.3200–1.3150 might come before any further upside move toward 1.3500.
🔍 Preferred Play: Wait for a retest of 1.3150 with price action confirmation before entering long. A strong breakout above 1.3350 would be early confirmation of renewed bullish pressure.
