GBP/USD Bulls Are Back? Institutions Are Loading Up1. Price Action & Zone Mapping
GBP/USD is consolidating above 1.3300 after a strong bullish reaction near the demand zone between 1.3040 and 1.3150 — an area that has already rejected price twice in recent months.
While the market structure still shows lower highs, the weekly candlestick formation signals a clear loss of bearish momentum. On the upside, the 1.3500–1.3600 zone remains the key supply area to break for a structural reversal to be confirmed.
2. COT Report – Institutional Positioning (as of May 6, 2025)
Non-Commercials (speculators) added +3,320 long positions and reduced -1,956 shorts, bringing the net long to +7,683 contracts — a strong bullish signal.
Commercials remain net short, but not with increasing aggression.
👉 The net positioning supports continued bullish bias, aligned with the recent technical rebound.
3. USD Index – Opposite Positioning
Non-Commercials increased both longs and shorts slightly on the US Dollar Index, but net positioning remains neutral with a slight bearish tilt.
This suggests a phase of indecision or mild retracement in the dollar, which indirectly supports GBP/USD upside.
4. GBP/USD Seasonality – Historical Behavior in May
According to MarketBulls data, May tends to be neutral-to-weak for the pair:
15-year avg: +0.0023
5-year avg: -0.016
2-year avg: +0.0069
Overall, this supports a ranging or corrective phase — not a high-conviction trending month. A breakout may need more confirmation.
5. Retail Sentiment
Currently, 60% of retail traders are short GBP/USD, with an average price of 1.2959, while only 40% are long from 1.3337.
👉 This imbalance favors a contrarian bullish narrative, especially if the market decides to run stops below 1.3300.
✅ Operational Outlook
GBP/USD is showing bullish consolidation signs, backed by:
Increasing institutional long interest
Contrarian retail sentiment (potential fuel for rallies)
Solid demand near 1.3040–1.3150
However, neutral seasonality and lack of structural breakout advise caution. A pullback towards 1.3200–1.3150 might come before any further upside move toward 1.3500.
🔍 Preferred Play: Wait for a retest of 1.3150 with price action confirmation before entering long. A strong breakout above 1.3350 would be early confirmation of renewed bullish pressure.
GBPUSD

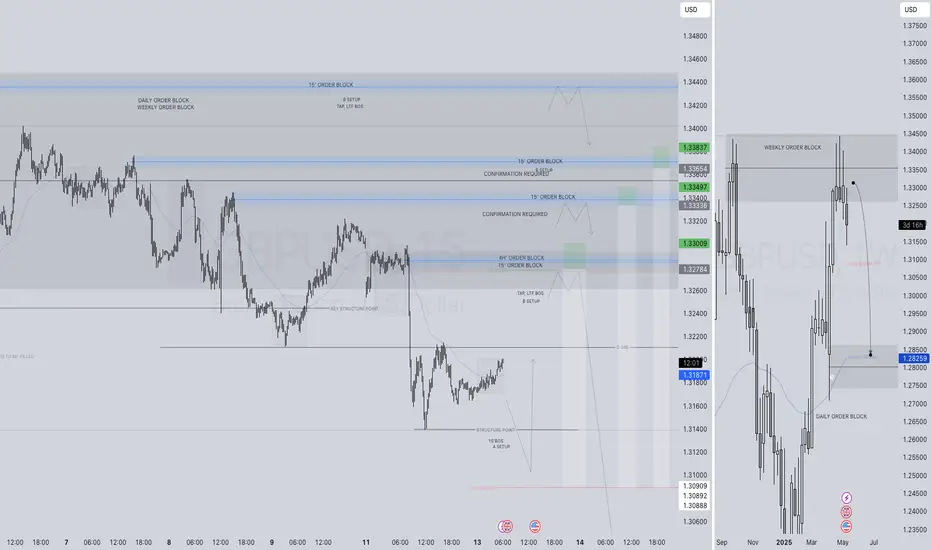
GBPUSD SHORT FORECAST Q2 W20 D14 Y25GBPUSD SHORT FORECAST Q2 W20 D14 Y25
Professional Risk Managers👋
Welcome back to another FRGNT chart update📈
Diving into some Forex setups using predominantly higher time frame order blocks alongside confirmation breaks of structure.
Let’s see what price action is telling us today!
💡Here are some trade confluences📝
✅Weekly order block rejection
✅Daily order block rejection
✅Intraday 15' order blocks
✅Tokyo ranges to be filled
🔑 Remember, to participate in trading comes always with a degree of risk, therefore as professional risk managers it remains vital that we stick to our risk management plan as well as our trading strategies.
📈The rest, we leave to the balance of probabilities.
💡Fail to plan. Plan to fail.
🏆It has always been that simple.
❤️Good luck with your trading journey, I shall see you at the very top.
🎯Trade consistent, FRGNT X

GBPUSD H4 I Bearish Reversal Based on the H4 chart, the price is trading near our sell entry level at 1.3333, a pullback resistance that aligns close to the 61.8% Fibo retracement.
Our take profit is set at 1.3207, a pullback support.
The stop loss is set at 1.3403, a swing high resistance.
High Risk Investment Warning
Trading Forex/CFDs on margin carries a high level of risk and may not be suitable for all investors. Leverage can work against you.
Stratos Markets Limited (tradu.com):
CFDs are complex instruments and come with a high risk of losing money rapidly due to leverage. 63% of retail investor accounts lose money when trading CFDs with this provider. You should consider whether you understand how CFDs work and whether you can afford to take the high risk of losing your money.
Stratos Europe Ltd (tradu.com):
CFDs are complex instruments and come with a high risk of losing money rapidly due to leverage. 63% of retail investor accounts lose money when trading CFDs with this provider. You should consider whether you understand how CFDs work and whether you can afford to take the high risk of losing your money.
Stratos Global LLC (tradu.com):
Losses can exceed deposits.
Please be advised that the information presented on TradingView is provided to Tradu (‘Company’, ‘we’) by a third-party provider (‘TFA Global Pte Ltd’). Please be reminded that you are solely responsible for the trading decisions on your account. There is a very high degree of risk involved in trading. Any information and/or content is intended entirely for research, educational and informational purposes only and does not constitute investment or consultation advice or investment strategy. The information is not tailored to the investment needs of any specific person and therefore does not involve a consideration of any of the investment objectives, financial situation or needs of any viewer that may receive it. Kindly also note that past performance is not a reliable indicator of future results. Actual results may differ materially from those anticipated in forward-looking or past performance statements. We assume no liability as to the accuracy or completeness of any of the information and/or content provided herein and the Company cannot be held responsible for any omission, mistake nor for any loss or damage including without limitation to any loss of profit which may arise from reliance on any information supplied by TFA Global Pte Ltd.
The speaker(s) is neither an employee, agent nor representative of Tradu and is therefore acting independently. The opinions given are their own, constitute general market commentary, and do not constitute the opinion or advice of Tradu or any form of personal or investment advice. Tradu neither endorses nor guarantees offerings of third-party speakers, nor is Tradu responsible for the content, veracity or opinions of third-party speakers, presenters or participants.

GBPUSD(20250514)Today's AnalysisMarket news:
The U.S. unadjusted CPI annual rate unexpectedly dropped to 2.3% in April, the lowest since February 2021.
Technical analysis:
Today's buying and selling boundaries:
1.3262
Support and resistance levels:
1.3408
1.3353
1.3318
1.3205
1.3170
1.3115
Trading strategy:
If the price breaks through 1.3318, consider buying, the first target price is 1.3353
If the price breaks through 1.3262, consider selling, the first target price is 1.3205

Bullish breakout?The Cable (GBP/USD) has broken out of the resistance level, which was a pullback resistance. A potential pullback to the pivot and a bounce could lead the price to rise toward the 1st resistance level.
Pivot: 1,3259
1st Support: 1.3223
1st Resistance: 1.3319
Risk Warning:
Trading Forex and CFDs carries a high level of risk to your capital and you should only trade with money you can afford to lose. Trading Forex and CFDs may not be suitable for all investors, so please ensure that you fully understand the risks involved and seek independent advice if necessary.
Disclaimer:
The above opinions given constitute general market commentary, and do not constitute the opinion or advice of IC Markets or any form of personal or investment advice.
Any opinions, news, research, analyses, prices, other information, or links to third-party sites contained on this website are provided on an "as-is" basis, are intended only to be informative, is not an advice nor a recommendation, nor research, or a record of our trading prices, or an offer of, or solicitation for a transaction in any financial instrument and thus should not be treated as such. The information provided does not involve any specific investment objectives, financial situation and needs of any specific person who may receive it. Please be aware, that past performance is not a reliable indicator of future performance and/or results. Past Performance or Forward-looking scenarios based upon the reasonable beliefs of the third-party provider are not a guarantee of future performance. Actual results may differ materially from those anticipated in forward-looking or past performance statements. IC Markets makes no representation or warranty and assumes no liability as to the accuracy or completeness of the information provided, nor any loss arising from any investment based on a recommendation, forecast or any information supplied by any third-party.

XAU/USD: Gold will fall ? (READ THE CAPTION)By analyzing the gold chart on the 2-hour timeframe, we can see that on Friday, after the price rose to $3248, it once again faced a correction and eventually closed at $3326. I expect that with the market opening, we’ll see further correction from gold, and the first potential target will likely be the $3213–$3216 area.
The key demand zones are $3253–$3274 and the $3313 level.
The key supply zones are $3355–$3369 and $3395–$3408.
Please support me with your likes and comments to motivate me to share more analysis with you and share your opinion about the possible trend of this chart with me !
Best Regards , Arman Shaban

GBPUSD Brace for a Sharp Drop to 1.3000! Free signal!Hello everyone.
I want share my idea about GBPUSD.
The U.S.-China trade deal breakthrough has fueled USD strength, pressuring GBP/USD after a surge to 1.3330. BoE’s dovish stance, with a potential 25 bps rate cut priced in, contrasts with a hawkish Fed, favoring USD. Upcoming UK CPI and U.S. CPI data this week could drive volatility—soft UK inflation may weaken GBP, while high U.S. inflation could bolster USD further. UK wage growth (5.9%) offers GBP support, but weak PMI and employer sentiment cap gains. Watch U.S.-UK trade deal news for potential GBP upside.
With technical we can see last week we had some consolidation and this week started with high volatility and brake support. at the moment price testing resistance + 4h FVG.
Scenario 1 (Bearish – Primary View): Price rejects the 1.3200–1.3275 FVG/resistance zone and resumes its downtrend, targeting the next major support at 1.3000—a psychological and structural level. This aligns with USD strength from the trade deal and BoE’s dovish stance . Trade Setup: Short below 1.3200, target 1.3000, stop above 1.3300 (above FVG).
Scenario 2 (Bullish – Less Likely): Buyers break above the FVG (1.3275) and 1.3300, targeting 1.3350–1.3400. This would require a catalyst like soft U.S. CPI data weakening USD, but current fundamentals favor bears.
Trade Setup:
Entry below - 1.3190 (current price 1.32048) ensures confirmation of rejection.
Stop above - 1.3280 (above FVG) protects against a bullish breakout.
Target - I will follow trend with trail stop.
For collaboration text me private!
Always make your own research!!!

GBPUSD: Strong Sell Momentum Built Up! What is next?GBPUSD is building strong sell momentum, increasing sell volume. At the same time, DXY is in correction mode, so keep that in mind. If DXY plummets again, it may invalidate our first entry. However, there’s a second entry that could be a safer zone for those looking for a stable entry.
There are three take profit targets that can be set according to your trading plan. This analysis doesn’t guarantee that the price will move as described.
Good luck and trade safely!
Thank you for your unwavering support! 😊
If you’d like to contribute, here are a few ways you can help us:
- Like our ideas
- Comment on our ideas
- Share our ideas
Team Setupsfx_
❤️🚀

Could GBP/USD resume lower from THIS resistance level?The GBP/USD sold off Monday on the back of the US-China trade truce, which lifted the dollar. Today, we saw a rebound in major currency pairs including the cable. But was Monday's price action following the weekend developments a game changer?
I think it was, and feel the US dollar has more room to the upside. For that reason, I am expecting the GBPUSD to hold below key resistance around 1.3245, which is shaded in orange on the chart. This area was old support, and may now turn into strong resistance. Let's see.
By Fawad Razaqzada, Market Analyst with FOREX.com

GBPUSDHello traders.
Today's first signal comes from GBPUSD. To be honest, I don’t feel entirely confident about this trade — but I’m still taking it, trusting my system and strategy.
🔍 Criteria:
✔️ Timeframe: 15M
✔️ Risk-to-Reward Ratio: 1:1.50
✔️ Trade Direction: Buy
✔️ Entry Price: 1.32022
✔️ Take Profit: 1.32320
✔️ Stop Loss: 1.31824
🔔 Disclaimer: This is not financial advice. It's a trade I’m taking based on my own system, shared purely for educational purposes.
📌 If you're also interested in systematic and data-driven trading strategies:
💡 Don’t forget to follow the page and subscribe to stay updated on future analyses.

GBPUSD Forecast: Watching 1.3000–1.3060 Zone for Bullish ReactioCurrently, GBPUSD is showing signs of weakness and may dip slightly towards the 1.3000 to 1.3060 area. A daily Fair Value Gap (FVG) exists in this zone on the lower timeframes, which could act as a strong support area. From that point, we may see a significant bullish move.
In summary:
Current Bias: Short-term bearish
Expected Retrace: To the 1.3000 – 1.3060 zone (daily FVG)
Expected Move: Strong bullish rally from that support
Please note that this is a technical outlook, not financial advice. Always do your own analysis and manage risk carefully in live market conditions.

CADCHF watch the drop!!Good day traders, I recently share an Idea on CADCHF and if you go back and see what was outlined and how I ended the description. I highlighted that price might manipulate higher but as long as the overall bias remains we still on!!
How I look at the markets is I like to cross reference different pairs and GBPCAD confirmed my bearish outlook and so did AUDCAD. Study this setup till Sellside liquidity 🙏🏽

GBPUSD's Upward Reaction from Point "D" Could Stay LimitedGBPUSD broke below the 1.3210 support level, confirming a newly formed short-term downtrend channel. The lower line of the channel and the projected point D of an extended ABCD formation have converged, and GBPUSD is now attempting an upward reaction from that area.
The 1.3210 level has now become the most immediate resistance. If it is broken, GBPUSD could make its way toward the upper boundary of the channel. However, momentum currently favors the bears, so any upward moves may present selling opportunities, whether from 1.3210 or the upper line of the channel.
If the downtrend channel fails, this strategy becomes invalid.

Fundamental Market Analysis for May 13, 2025 GBPUSDEvent to pay attention to today:
15:30 EET. USD - Consumer Price Index
18:00 EET. USD - BOE Governor Andrew Bailey Speaks
The GBP/USD pair is climbing towards 1.3195 in the early European session on Tuesday.
US President Donald Trump said last week that he would continue to impose new 10% tariffs on imports of most British goods, but would reduce higher tariffs on imports of British cars, steel and aluminium. These positive developments related to the US-UK trade deal are fuelling cable prices.
In addition, gradual and cautious policy easing by the Bank of England is helping to boost the Pound Sterling. The UK central bank cut interest rates by a quarter of a percentage point in a split decision last week and said the risks to growth posed by Trump's global trade war did not derail its plan for cautious policy easing. The Bank of England estimates the UK economy will grow by 1 per cent, up from the 0.75 per cent forecast at its February meeting.
Traders await the release of the US consumer price index (CPI) for April, due later on Tuesday.
Trading recommendation: BUY 1.3225, SL 1.3125, TP 1.3425

XAUUSD BULLISH OR BEARISH DETAILED ANALYSISXAUUSD is currently trading around 3250, consolidating within a well-defined bullish flag structure after a strong impulsive rally. This flag pattern on the 12-hour chart reflects healthy profit-taking and reaccumulation after a significant upward move. The current price action is respecting the lower boundary of the flag, and with growing volume on bullish candles, the setup suggests a high probability of a breakout to the upside, targeting the 3650 region.
From a macroeconomic perspective, gold remains in strong demand due to ongoing global uncertainties and persistent inflation concerns. The US CPI print remains sticky above 3%, keeping real yields under pressure and supporting gold's bullish bias. Furthermore, with the Fed expected to hold interest rates steady for longer, the market is starting to price in fewer rate cuts this year. This continues to undermine the USD and supports gold as a store of value. Additionally, rising central bank gold purchases and geopolitical risk premium are adding further tailwinds.
Technically, we are watching for a clean breakout above the upper flag resistance around 3280–3300. A breakout with volume confirmation would open the door toward the psychological 3400 level first, followed by a push toward the 3650 target area. Momentum indicators are turning up, and price is showing signs of basing just above previous support levels, adding confidence to the bullish continuation scenario.
Gold remains one of the strongest trending assets in 2025, and this consolidation is likely just a pause before the next leg higher. As global markets digest the impact of persistent inflation and macro volatility, precious metals like gold are likely to outperform. This flag formation provides a textbook continuation setup for traders looking to position with the broader trend.

GU-Tue-13/05/25 TDA-Flash news, bearish continuation before CPI!Analysis done directly on the chart
Sharing live trade updates!
Flash news yesterday to cause the price to continue
the bearish momentum breaking through strong
supports.
SOURCE: Financial Juice
If you are a daytrader (even if aren't) you should be
aware of flash news that can happen at any time and
cause price to move suddenly.
Not financial advice, DYOR.
Market Flow Strategy
Mister Y

AUDUSD BULLISH OR BEARISH DETAILED ANALYSISAUDUSD is currently trading at 0.6400 and forming a clear inverse head and shoulders pattern on the 12-hour timeframe, a well-known bullish reversal structure. The neckline breakout is nearing, and the recent price behavior shows strong bullish volume support, indicating growing confidence among buyers. With a projected target of 0.6700, this setup offers a favorable risk-to-reward ratio as we transition into a potential trend shift in favor of the Aussie.
On the fundamental front, the Australian dollar is benefiting from a more resilient macro backdrop. Recent Australian jobs data came in stronger than expected, and the RBA remains cautious on rate cuts, especially with inflation pressures still lingering. Meanwhile, US inflation remains sticky, but with the Fed leaning toward a “higher-for-longer” stance rather than aggressive tightening, the greenback has shown signs of exhaustion against risk-linked currencies like AUD.
Technically, the price has respected the 0.6350 support level and is now forming higher lows. The breakout of the neckline around 0.6450 could accelerate bullish momentum, especially if accompanied by a strong candle close and continued volume confirmation. The next resistance lies at 0.6550, with the larger structure aiming for a test of 0.6700. This aligns with broader market sentiment rotating into commodity currencies, particularly as China stimulus hopes and improving risk appetite lift AUD.
AUDUSD remains one of the more technically clean setups among the majors right now. With a bullish pattern forming, supportive fundamentals, and improving sentiment across risk assets, this is a setup that deserves close attention from traders looking to ride the next impulsive leg to the upside.

GBPUSD SHORT FORECAST Q2 W20 D13 Y25GBPUSD SHORT FORECAST Q2 W20 D13 Y25
Professional Risk Managers👋
Welcome back to another FRGNT chart update📈
Diving into some Forex setups using predominantly higher time frame order blocks alongside confirmation breaks of structure.
Let’s see what price action is telling us today!
💡Here are some trade confluences📝
✅Weekly order block rejection
✅Daily order block rejection
✅Intraday 15' order blocks
✅Tokyo ranges to be filled
🔑 Remember, to participate in trading comes always with a degree of risk, therefore as professional risk managers it remains vital that we stick to our risk management plan as well as our trading strategies.
📈The rest, we leave to the balance of probabilities.
💡Fail to plan. Plan to fail.
🏆It has always been that simple.
❤️Good luck with your trading journey, I shall see you at the very top.
🎯Trade consistent, FRGNT X
Sell Signal for GBPUSD!Hey Guys,
In the new analysis on GBPUSD, price is close to a potential resistance area and based on the latest trend, it can be another good opportunity to open a sell position (as I've defined) with a good risk/reward ratio(1/3)
You can consider different Take profits and partially close your position until to the latest target.
Good luck :)

GBP/USD Multi-Timeframe Summary (May 13–17):GBP/USD Multi-Timeframe Summary (May 13–17):
On the daily chart, GBP/USD faces strong resistance at 1.345–1.350 (double-top) and support near 1.280–1.290. The recent pullback to 1.320 aligns with the 61.8% retracement of the April–May rally.
On the hourly chart, price is consolidating in a falling channel between 1.318–1.336, with a bear trap on May 8 indicating demand near the lows. A clean hourly break above 1.336 suggests momentum toward 1.345, while a break below 1.318 targets the 1.300–1.290 daily demand zone.
The 15-minute chart shows a V-reversal from 1.314, followed by a tight flag between 1.318–1.322. This zone offers short-term breakout or fade trades.
Key levels:
Resistance: 1.336, 1.345
Support: 1.318, 1.312, 1.290
Trade triggers: Buy >1.322, Sell <1.318 (tight stops, 15–30 pip targets)
Strategy:
Scalp intraday flags on 15′, trade hourly range extremes, and watch for a breakout from the daily structure.

Bearish reversal?The Cable (GBP/USD) is rising towards the pivot, which is a pullback resistance and could reverse to the 1st support, which acts as a pullback support that lines up with the 50% Fibonacci retracement.
Pivot: 1.3250
1st Support: 1.3050
1st Resistance: 1.3331
Risk Warning:
Trading Forex and CFDs carries a high level of risk to your capital and you should only trade with money you can afford to lose. Trading Forex and CFDs may not be suitable for all investors, so please ensure that you fully understand the risks involved and seek independent advice if necessary.
Disclaimer:
The above opinions given constitute general market commentary, and do not constitute the opinion or advice of IC Markets or any form of personal or investment advice.
Any opinions, news, research, analyses, prices, other information, or links to third-party sites contained on this website are provided on an "as-is" basis, are intended only to be informative, is not an advice nor a recommendation, nor research, or a record of our trading prices, or an offer of, or solicitation for a transaction in any financial instrument and thus should not be treated as such. The information provided does not involve any specific investment objectives, financial situation and needs of any specific person who may receive it. Please be aware, that past performance is not a reliable indicator of future performance and/or results. Past Performance or Forward-looking scenarios based upon the reasonable beliefs of the third-party provider are not a guarantee of future performance. Actual results may differ materially from those anticipated in forward-looking or past performance statements. IC Markets makes no representation or warranty and assumes no liability as to the accuracy or completeness of the information provided, nor any loss arising from any investment based on a recommendation, forecast or any information supplied by any third-party.

GBPUSD H4 I Bearish Reversal Based on the H4 chart, the price is rising toward our sell entry level at 1.3250, a pullback resistance.
Our take profit is set at 1.3015, a pullback support that aligns close to the 61.8% Fibo retracement.
The stop loss is set at 1.3351, an overlap resistance.
High Risk Investment Warning
Trading Forex/CFDs on margin carries a high level of risk and may not be suitable for all investors. Leverage can work against you.
Stratos Markets Limited (tradu.com):
CFDs are complex instruments and come with a high risk of losing money rapidly due to leverage. 63% of retail investor accounts lose money when trading CFDs with this provider. You should consider whether you understand how CFDs work and whether you can afford to take the high risk of losing your money.
Stratos Europe Ltd (tradu.com):
CFDs are complex instruments and come with a high risk of losing money rapidly due to leverage. 63% of retail investor accounts lose money when trading CFDs with this provider. You should consider whether you understand how CFDs work and whether you can afford to take the high risk of losing your money.
Stratos Global LLC (tradu.com):
Losses can exceed deposits.
Please be advised that the information presented on TradingView is provided to Tradu (‘Company’, ‘we’) by a third-party provider (‘TFA Global Pte Ltd’). Please be reminded that you are solely responsible for the trading decisions on your account. There is a very high degree of risk involved in trading. Any information and/or content is intended entirely for research, educational and informational purposes only and does not constitute investment or consultation advice or investment strategy. The information is not tailored to the investment needs of any specific person and therefore does not involve a consideration of any of the investment objectives, financial situation or needs of any viewer that may receive it. Kindly also note that past performance is not a reliable indicator of future results. Actual results may differ materially from those anticipated in forward-looking or past performance statements. We assume no liability as to the accuracy or completeness of any of the information and/or content provided herein and the Company cannot be held responsible for any omission, mistake nor for any loss or damage including without limitation to any loss of profit which may arise from reliance on any information supplied by TFA Global Pte Ltd.
The speaker(s) is neither an employee, agent nor representative of Tradu and is therefore acting independently. The opinions given are their own, constitute general market commentary, and do not constitute the opinion or advice of Tradu or any form of personal or investment advice. Tradu neither endorses nor guarantees offerings of third-party speakers, nor is Tradu responsible for the content, veracity or opinions of third-party speakers, presenters or participants.

EurGbp….‘CE of a balanced FVG’Good day traders, EurGbp has been on my watchlist for sometime now and I was hesitant because of the strength shown on DXY and that made me think we’d have a quiet day here yesterday.
With that been said the balanced price range is the grey rectangle shown on the chart and we can see that price showed a rejection by failing to close below the midpoint(CE). On the daily TF we are very much still bullish and till we shift structure lower on the daily TF, my overall sentiment remains. On the 4H TF we have a very bearish leg and from what we know price moves in a trend not a line so that also makes part of our thought process as well.
