XAUUSD Bullish or bearish Detailed AnalysisXAUUSD is currently trading around 3380, continuing its bullish momentum as previously anticipated. The price action has followed the projected path, delivering substantial profits for those positioned early. The next key resistance level is at 3450, aligning with the upper boundary of the ascending channel.
Fundamentally, gold's rally is supported by heightened safe-haven demand amid ongoing geopolitical tensions and a weakening U.S. dollar. Investors are closely watching the upcoming Federal Reserve meeting, with expectations leaning toward a dovish stance, which could further bolster gold prices .
Technical indicators suggest that the bullish trend remains intact, with the price maintaining its position above key moving averages. However, traders should be cautious of potential pullbacks as the market approaches overbought conditions.
In summary, XAUUSD is on track toward the 3450 target, supported by both technical and fundamental factors. Traders should monitor key resistance levels and macroeconomic developments to manage their positions effectively.
GBPUSD

GBP Falls Ahead of Fed and BOE MeetingsSterling fell 0.24% to $1.3265 on Tuesday as the U.S. dollar firmed ahead of the Federal Reserve’s policy decision, with rates expected to remain unchanged. While the dollar recovered slightly, doubts over its safe-haven appeal and Trump’s tariff stance persist. Markets also await the Bank of England’s meeting, where a 25 bps rate cut is expected. Dovish signals or dollar softness may support GBP/USD.
If GBP/USD breaks above 1.3430, the next resistance levels are 1.3500 and 1.3550. Support levels are at 1.3200, followed by 1.3050 and 1.2960.

Bearish Shark Pattern with a Massive Profit FactorThis is how trading should be done . I've just spotted a Bearish Shark Pattern on the Weekly Chart and while it's not perfect, it's still a great trade worth keeping on the radar. The market has been hovering around the entry price for weeks, which tells me something is brewing.
The Smart Approach:
Now, I’m not entering based on the Weekly Chart alone , that would require a stop-loss that’s way too wide. Instead, I look for an execution timeframe within three levels down. That means the lowest timeframe I’d engage from this setup is the 4-hourly chart .
But here’s the twist...
The Trade Setup:
I spotted another Bearish Shark Pattern on the 15-minute chart.
What did I do?
> I traded what I saw. Simple as that.
It’s not always about having the "perfect" timeframe. It’s about:
Seeing a valid setup
Knowing your structure
And having a clear trade management plan.
Key Rule:
Once the market reaches a certain level, I’ll shift my stop to entry, securing a risk-free trade. That’s always the goal.
Golden Rule in Trading: “Don’t lose your capital.”
The Reward:
If this trade hits my final target, I’ll walk away with a Profit Factor of 27.45 .
That means for every dollar I risk, the projected return is $27.45. Let that sink in.
So now the question is - how much of your equity would you be risking on a trade like this? Would you go big, or stick to your usual risk percentage?
Let me know in the comments, how would you manage this kind of high-reward setup?
Stay sharp and happy trading, everyone! 🚀

GU-Tue-6/05/25 TDA-Tomorrow's Fed rate decision!Analysis done directly on the chart
Patience is key. Even when you're not
in a trade, have you ever asked why
price moved this way rather than other
ways at this specific time and period?
Knowing when not to trade or lower your
risks is as important as when you're placing
a trade simply because it can save you from
bad losses, mistakes.
Not financial advice, DYOR.
Market Flow Strategy
Mister Y

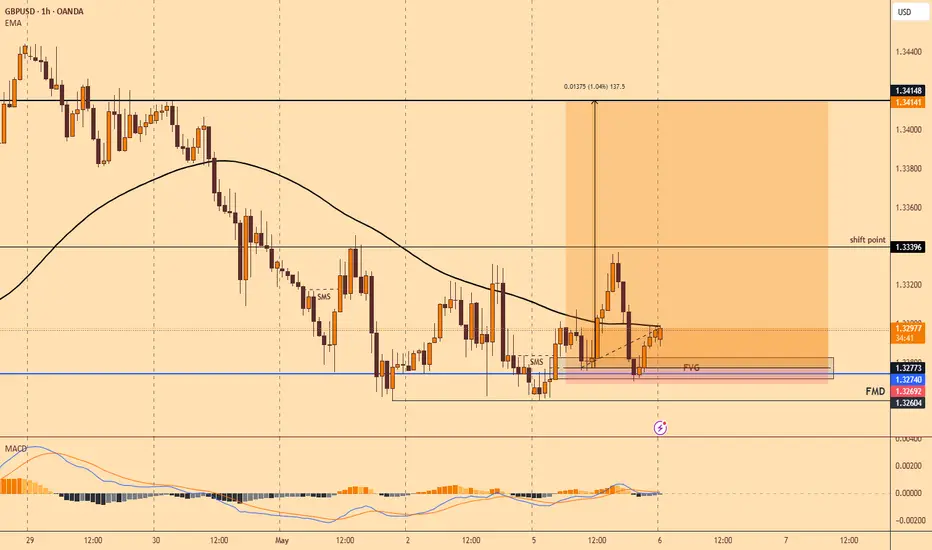
gbpusd 2025-5-6some level in the chart shows we can trade on this day .
on top fvg 1h , pdh . when price go up and reach to this level we wait to see sell setup then trade .
on bottom fvg 1h , pdl . when price go down and reach to this level we wait to see buy setup then trade .

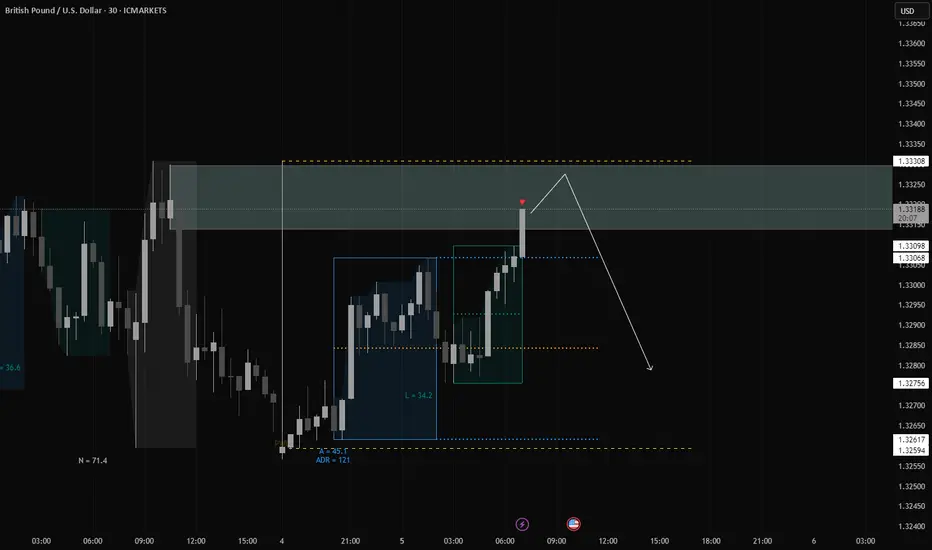
Bullish ScenarioH4 is bullish and on the m15 TF it made a shift is structure then a pullback to a FVG now we are expecting a rise in price up.
GBPUSD: Bearish Continuation is Highly Probable! Here is Why:
The analysis of the GBPUSD chart clearly shows us that the pair is finally about to tank due to the rising pressure from the sellers.
Disclosure: I am part of Trade Nation's Influencer program and receive a monthly fee for using their TradingView charts in my analysis.
❤️ Please, support our work with like & comment! ❤️

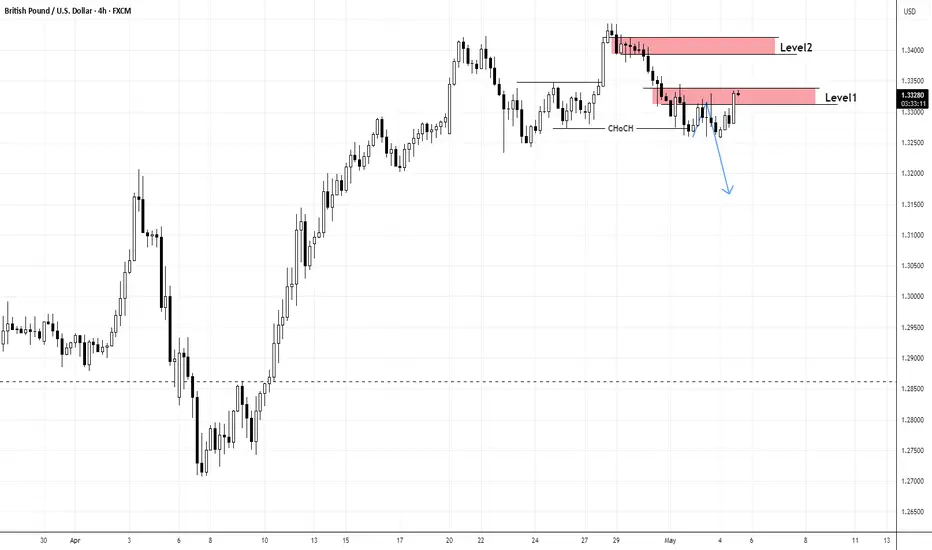
Level 1 Or Level 2, GBPUSD Is Likely Going DownGBPUSD!
N.B!
- GBPUSD price might not follow the drawn lines . Actual price movements may likely differ from the forecast.
- Let emotions and sentiments work for you
- ALWAYS Use Proper Risk Management In Your Trades
#gbpusd
GBPUSD Forecast: Double Top or Flat?In contrast to EURUSD, the GBPUSD chart reflects a double top or flat rather than a head-and-shoulders pattern. However, unlike DXY and EURUSD, GBPUSD hasn’t broken below its neckline, maintaining a bullish bias as RSI continues to show positive momentum.
• Upside Scenario : If the pair breaks above the 1.3345 high, the next targets are 1.3380, 1.3400, 1.3440, and 1.3500, in the direction of the duplicated channel confirming the possible consolidation as a flat.
• Downside Scenario : A break below the neckline and 1.3200 support could trigger a decline toward 1.3080, confirming a double top formation on the pair.
Volatility catalysts for this week range between the FOMC Outlook and BOE Meeting, between Wednesday and Thursday, following their respective rate decisions
Written by Razan Hilal, CMT

GBPUSD Sell AreaHello everyone, we got a potential sell zone around this zone for GBPUSD.
HTF Trends (D & W) indicate a bearish trend and it does seem like GBPUSD might be seeking to take out liquidity before continuing its move.
For my entry confirmation I will be looking out for rejection and see if we can get any clear patterns.
I expect the move to happen at most late during new york session.
Let me know your thoughts!
XAU/USD: NFP has come,What's Next? (READ THE CAPTION)By analyzing the gold chart on the 1-hour timeframe, we can see that after yesterday’s analysis, the price successfully rallied from $3231 to $3268. Once it reached that zone, selling pressure kicked in, and gold has since corrected down to $3239.
If gold stabilizes below $3257, we may expect further downside. The potential bearish targets are $3237 and $3221.
Keep a close eye on the $3209–$3220 zone, as price reaction there could be significant.
Please support me with your likes and comments to motivate me to share more analysis with you and share your opinion about the possible trend of this chart with me !
Best Regards , Arman Shaban

GBPUSD The second trade of the day comes from the GBPUSD pair.
Even though I'm not a big fan of this pair, I believe it's worth taking advantage of the signal.
However, for this pair, I recommend slightly reducing your lot size and overall risk.
🔍 Criteria:
✔️ Timeframe: 15M
✔️ Risk-to-Reward Ratio: 1:3
✔️ Trade Direction: Buy
✔️ Entry Price: 1.32793
✔️ Take Profit: 1.33054
✔️ Stop Loss: 1.32706
🔔 Disclaimer: This is not financial advice. It's a trade I’m taking based on my own system, shared purely for educational purposes.
📌 If you're also interested in systematic and data-driven trading strategies:
💡 Don’t forget to follow the page and subscribe to stay updated on future analyses.

GU-Mon-5/05/25 TDA-Slowly approaching to daily support 1.32496Analysis done directly on the chart
Fed and BoE rate decision this week affecting
heavily on GU and other dollar and gbp related pairs.
Trade safe, stay informed with basic economic calendar
check. I personally use FXstreet economic calendar.
You can be very good at technical analysis but without
fundamental understanding you'll likely get a lot of stop
losses.
Not financial advice, DYOR.
Market Flow Strategy
Mister Y

Fundamental Market Analysis for May 6, 2025 GBPUSDGBPUSD:
The GBP/USD pair started the new week on a subdued note and is fluctuating in a narrow trading range around 1.3260-1.3265, near the one-week low reached during the Asian session.
The US Dollar (USD) remains on the defensive below multi-week highs amid heightened economic uncertainty amid US President Donald Trump's tariff plans and is a key supportive factor for the GBP/USD pair. Furthermore, the prospect of more aggressive policy easing by the Federal Reserve (Fed) is further undermining the US Dollar.
Despite a better than expected US non-farm payrolls report on Friday, investors seem convinced that the US central bank will resume its rate-cutting cycle in June and reduce borrowing costs by 100 basis points by the end of this year. This, along with optimism about a potential de-escalation of the trade war between the US and China, is reducing demand for the safe-haven dollar.
However, traders seem reluctant to make new bullish bets on GBP/USD and prefer to wait for this week's key event - the Bank of England's (BoE) monetary policy meeting on Thursday. The UK central bank is expected to cut interest rates by 25bps and take a somewhat soft stance amid downside risks to growth from the trade war.
In addition, this week traders will face the publication of the FOMC meeting minutes, which will affect the USD price dynamics and give a meaningful impetus to the GBP/USD pair.
Trading recomendation: SELL 1.3280, SL 1.3290, TP 1.3180

GBPUSD SHORT FORECAST Q2 W19 D5 Y25GBPUSD SHORT FORECAST Q2 W19 D5 Y25
Professional Risk Managers👋
Welcome back to another FRGNT chart update📈
Diving into some Forex setups using predominantly higher time frame order blocks alongside confirmation breaks of structure.
Let’s see what price action is telling us today!
💡Here are some trade confluences📝
✅Weekly order block rejection
✅Daily order block rejection
✅Intraday 15' order blocks
✅Tokyo ranges to be filled
🔑 Remember, to participate in trading comes always with a degree of risk, therefore as professional risk managers it remains vital that we stick to our risk management plan as well as our trading strategies.
📈The rest, we leave to the balance of probabilities.
💡Fail to plan. Plan to fail.
🏆It has always been that simple.
❤️Good luck with your trading journey, I shall see you at the very top.
🎯Trade consistent, FRGNT X

Falling towards pullback support?The Cable (GBP/USD) is falling towards the pivot which lines up with the 50% Fibonacci retracement and could bounce to the 1st resistance.
Pivot: 1.3100
1st Support: 1.2870
1st Resistance: 1.3442
Risk Warning:
Trading Forex and CFDs carries a high level of risk to your capital and you should only trade with money you can afford to lose. Trading Forex and CFDs may not be suitable for all investors, so please ensure that you fully understand the risks involved and seek independent advice if necessary.
Disclaimer:
The above opinions given constitute general market commentary, and do not constitute the opinion or advice of IC Markets or any form of personal or investment advice.
Any opinions, news, research, analyses, prices, other information, or links to third-party sites contained on this website are provided on an "as-is" basis, are intended only to be informative, is not an advice nor a recommendation, nor research, or a record of our trading prices, or an offer of, or solicitation for a transaction in any financial instrument and thus should not be treated as such. The information provided does not involve any specific investment objectives, financial situation and needs of any specific person who may receive it. Please be aware, that past performance is not a reliable indicator of future performance and/or results. Past Performance or Forward-looking scenarios based upon the reasonable beliefs of the third-party provider are not a guarantee of future performance. Actual results may differ materially from those anticipated in forward-looking or past performance statements. IC Markets makes no representation or warranty and assumes no liability as to the accuracy or completeness of the information provided, nor any loss arising from any investment based on a recommendation, forecast or any information supplied by any third-party.

GBPUSD - W bottom - 4hr - 50 pipsBig movement down to a key support area.
Rebound and retesting.
Looking for a move up with possible two take profits 50-90 pips.

GBP/USD "The Cable" Forex Bank Heist Plan (Scalping / Day Trade)🌟Hi! Hola! Ola! Bonjour! Hallo! Marhaba!🌟
Dear Money Makers & Robbers, 🤑💰✈️
Based on 🔥Thief Trading style technical and fundamental analysis🔥, here is our master plan to heist the GBP/USD "The Cable" Forex Bank. Please adhere to the strategy I've outlined in the chart, which emphasizes short entry. Our aim is the high-risk Green Zone. Risky level, oversold market, consolidation, trend reversal, trap at the level where traders and bullish robbers are stronger. 🏆💸Book Profits Be wealthy and safe trade.💪🏆🎉
Entry 📈 : "The heist is on! Wait for the breakout (1.28877) then make your move - Bearish profits await!"
however I advise placing Sell Stop Orders below the breakout MA or Place Sell limit orders within a 15 or 30 minute timeframe. Entry from the most recent or closest low or high level should be in retest. I Highly recommended you to put alert in your chart.
📌I strongly advise you to set an "alert (Alarm)" on your chart so you can see when the breakout entry occurs.
Stop Loss 🛑: Thief SL placed at 1.29600 (swing / Day Trade Basis) Using the 2H period, the recent / swing high or low level.
SL is based on your risk of the trade, lot size and how many multiple orders you have to take.
Target 🎯: 1.27800 (or) Escape Before the Target
🧲Scalpers, take note 👀 : only scalp on the Short side. If you have a lot of money, you can go straight away; if not, you can join swing traders and carry out the robbery plan. Use trailing SL to safeguard your money 💰.
GBP/USD "The Cable" Forex Bank Heist Plan (Scalping / Day Trade) is currently experiencing a bearishness,., driven by several key factors.
📰🗞️Get & Read the Fundamental, Macro, COT Report, Quantitative Analysis, Sentimental Outlook, Intermarket Analysis, Future trend targets.. go ahead to check 👉👉👉
⚠️Trading Alert : News Releases and Position Management 📰 🗞️ 🚫🚏
As a reminder, news releases can have a significant impact on market prices and volatility. To minimize potential losses and protect your running positions,
we recommend the following:
Avoid taking new trades during news releases
Use trailing stop-loss orders to protect your running positions and lock in profits
💖Supporting our robbery plan 💥Hit the Boost Button💥 will enable us to effortlessly make and steal money 💰💵. Boost the strength of our robbery team. Every day in this market make money with ease by using the Thief Trading Style.🏆💪🤝❤️🎉🚀
I'll see you soon with another heist plan, so stay tuned 🤑🐱👤🤗🤩

GBP_USD POTENTIAL LONG|
✅GBP_USD fell again to retest the support of 1.3200
But it is a strong key level
So I think that there is a high chance
We will see a bullish rebound and a move up
LONG🚀
✅Like and subscribe to never miss a new idea!✅
Disclosure: I am part of Trade Nation's Influencer program and receive a monthly fee for using their TradingView charts in my analysis.

Bearish drop off pullback resistance?GBP/USD has rejected the resistance level, which is a pullback resistance, and could potentially drop from this level to our take profit target.
Entry: 1.3342
Why we like it:
There is a pullback resistance level.
Stop loss: 1.3442
Why we like it:
There is a pullback resistance level.
Take profit: 1.3160
Why we like it:
There is a pullback support level that lines up with the 38.2% Fibonacci retracement.
Enjoying your TradingView experience? Review us!
Please be advised that the information presented on TradingView is provided to Vantage (‘Vantage Global Limited’, ‘we’) by a third-party provider (‘Everest Fortune Group’). Please be reminded that you are solely responsible for the trading decisions on your account. There is a very high degree of risk involved in trading. Any information and/or content is intended entirely for research, educational and informational purposes only and does not constitute investment or consultation advice or investment strategy. The information is not tailored to the investment needs of any specific person and therefore does not involve a consideration of any of the investment objectives, financial situation or needs of any viewer that may receive it. Kindly also note that past performance is not a reliable indicator of future results. Actual results may differ materially from those anticipated in forward-looking or past performance statements. We assume no liability as to the accuracy or completeness of any of the information and/or content provided herein and the Company cannot be held responsible for any omission, mistake nor for any loss or damage including without limitation to any loss of profit which may arise from reliance on any information supplied by Everest Fortune Group.

GBP/USD Trend JudgmentTechnical Analysis of GBPUSD 4 - hour Chart
Support Level Analysis
Several key support levels are clearly marked in the chart. 1.32000 is a strong support level. If the price drops to this level, it may bounce back due to the buying support formed by past intensive trading 📈. 1.32400 is near the current price and also plays a certain supporting role. The price fluctuating around this level reflects the tug - of - war between bulls and bears here 🤼. 1.30200 is an important support level further down. Once the price breaks below 1.32000, it may further test this level 📉.
Target Level Analysis
The target area is around 1.34200. Judging from the chart trend, the price previously had upward - fluctuating momentum 💹. If the current price can break through the short - term downward trend and is accompanied by trading volume, and the bullish force continues to strengthen, the price is expected to move upward towards the 1.34200 target area 🚀. This target area is derived from the high points of previous price fluctuations and trend lines. It has certain resistance, but once broken, it can open up the upper space 🚪.
Trend Judgment
Currently, the price is in a relatively volatile downward trend, but the lower support levels may change the price trend. If the price obtains effective support at the support levels and forms a reversal signal (such as a bullish engulfing pattern, etc.) 📊, an upward trend is expected to start. Investors can pay attention to the performance of the price at the support levels. If the support is effective, they can try to go long, with the stop - loss set below the support level; if the price breaks below the support level, they can consider going short, with the target looking towards the lower support level 📌.
⚡⚡⚡ GBPUSD ⚡⚡⚡
🚀 Buy@1.32000 - 1.32400
🚀 TP 1.33500 - 1.34000
Accurate signals are updated every day 📈 If you encounter any problems during trading, these signals can serve as your reliable guide 🧭 Feel free to refer to them! I sincerely hope they'll be of great help to you 🌟 👇

2025 SO FAR GBPUSD GBPUSD took support from support line,
currency pair was bullish for 4 months, My analysis target met properly.
folllow me for simple and accurate
swing analysis of INDICE - CURRENCY - COMMODITIES.

How to Trade Gold with AI-Powered Algos in 2025📊 How to Trade Gold with AI-Powered Algos in 2025
A practical action plan for serious gold traders
🔍 1. Know Why Gold Requires Custom Algo Tactics
Gold is volatile, news-sensitive, and driven by macro events like Fed policy, geopolitics, and inflation. Generic stock or crypto bots fail here — gold needs precise, event-aware automation.
🧠 2. Use AI-Powered Bots Trained for Gold Volatility
Deploy bots that adapt to real-time data like CPI releases, bond yields, and geopolitical headlines. Use machine learning models that detect gold breakouts, consolidations, and safe-haven flows.
Top AI algos for gold traders: Multiple systems based on MT4/MT5
Fully-automated, AI-based gold bot with breakout detection, precision entries, and built-in risk control.
⚙️ 3. Build or Choose the Right Algo Strategy for Gold
Trend-Following: Use 21/50 EMA crosses on H1 and H4
Mean Reversion: Bollinger Band fades in range-bound sessions
Breakout Algos: Trigger trades on CPI or FOMC event volatility
Volume-Based AI: Analyze volume spikes vs. historical patterns
🧪 4. Backtest Gold-Specific Models
Always test your bot using historical gold data, especially during NFP weeks, Fed meetings, and geopolitical escalations. Use data from 2018 to 2024 for high-volatility periods.
Tools: TradingView for Pine Script testing, MetaTrader 5 for EA deployment
🛡️ 5. Control Risk with Gold-Specific Parameters
Max drawdown: Keep under 15 percent
Stop-loss: Always use hard stops (not just trailing)
Position sizing: 0.5 to 1 percent of capital per trade
Use volatility filters: Avoid entries during thin liquidity hours
🔄 6. Automate Monitoring and Adaptation
Run multiple bots for breakout, momentum, and reversal setups
Use dashboards to track gold-specific metrics like VIX, USDX, DXY, and 10Y Treasury yields Integrate AI that adjusts parameters after major data releases
🚀 7. Prepare for 2025 Market Structure
Gold is increasingly driven by
Central bank digital currency rollouts
USD de-dollarization risks
Global stagflation or recession themes
DeFi and tokenized gold products
Your algo must factor in these macro narratives using real-time data feeds
📌 Gold Algo Trading Success Plan 2025
Use AI bots built for gold volatility
Trade high-probability breakouts post-news
Backtest with gold-specific macro filters
Maintain strict risk limits with max 15 percent drawdown
Monitor global news and macro data with bot triggers
Continuously optimize and adapt
Gold is not just a commodity — it’s a signal of global risk. Automate smartly, manage risk tightly, and use AI to stay one move ahead.
