GBPUSD H4 I Bearish Reversal Based on the H4 chart, the price is approaching our sell entry level at 1.3261, a pullback resistance.
Our take profit is set at 1.3168, a pullback support that aligns with the 161.8% Fibo extension
The stop loss is set at 1.3342, an overlap resistance.
High Risk Investment Warning
Trading Forex/CFDs on margin carries a high level of risk and may not be suitable for all investors. Leverage can work against you.
Stratos Markets Limited (tradu.com):
CFDs are complex instruments and come with a high risk of losing money rapidly due to leverage. 63% of retail investor accounts lose money when trading CFDs with this provider. You should consider whether you understand how CFDs work and whether you can afford to take the high risk of losing your money.
Stratos Europe Ltd (tradu.com):
CFDs are complex instruments and come with a high risk of losing money rapidly due to leverage. 63% of retail investor accounts lose money when trading CFDs with this provider. You should consider whether you understand how CFDs work and whether you can afford to take the high risk of losing your money.
Stratos Global LLC (tradu.com):
Losses can exceed deposits.
Please be advised that the information presented on TradingView is provided to Tradu (‘Company’, ‘we’) by a third-party provider (‘TFA Global Pte Ltd’). Please be reminded that you are solely responsible for the trading decisions on your account. There is a very high degree of risk involved in trading. Any information and/or content is intended entirely for research, educational and informational purposes only and does not constitute investment or consultation advice or investment strategy. The information is not tailored to the investment needs of any specific person and therefore does not involve a consideration of any of the investment objectives, financial situation or needs of any viewer that may receive it. Kindly also note that past performance is not a reliable indicator of future results. Actual results may differ materially from those anticipated in forward-looking or past performance statements. We assume no liability as to the accuracy or completeness of any of the information and/or content provided herein and the Company cannot be held responsible for any omission, mistake nor for any loss or damage including without limitation to any loss of profit which may arise from reliance on any information supplied by TFA Global Pte Ltd.
The speaker(s) is neither an employee, agent nor representative of Tradu and is therefore acting independently. The opinions given are their own, constitute general market commentary, and do not constitute the opinion or advice of Tradu or any form of personal or investment advice. Tradu neither endorses nor guarantees offerings of third-party speakers, nor is Tradu responsible for the content, veracity or opinions of third-party speakers, presenters or participants.
GBPUSD

NNFX GBPUSD Long ContinuationSignal: GBPUSD Long— Continuation
Context:Pullback in range-bound regime.
Probability: Normal
Risk: 1% → Due to continuation
R:R Plan: 1.3R, 50% scale-out at TP - reasonable probability
---
Notes:
USD Interest Rates have pushed the dollar to give signal on Judge Fortress Algorithm.
GBPUSD continuation had been set up pending signal for 4 days. Volume for bullish moves are high, and the R:R setup very profitable with potential to secure further into 1.8-2R as days go on.
Set scale out to 50% expecting a potential trend to continue further, as a trend has been evident and volume supports it.

GBP-USD Support Ahead! Buy!
Hello,Traders!
GBP-USD is trading in an
Uptrend and the pair is
About to retest a horizontal
Support level around 1.3178
From where we will be expecting
A local rebound and a
Further bullish move up
Buy!
Comment and subscribe to help us grow!
Check out other forecasts below too!
Disclosure: I am part of Trade Nation's Influencer program and receive a monthly fee for using their TradingView charts in my analysis.

Bearish breakout?The Cable (GBP?USD) is reacting off the pivot and could potentially drop to the 1st support.
Pivot: 1.3261
1st Support: 1.3159
1st Resistance: 1.3333
Risk Warning:
Trading Forex and CFDs carries a high level of risk to your capital and you should only trade with money you can afford to lose. Trading Forex and CFDs may not be suitable for all investors, so please ensure that you fully understand the risks involved and seek independent advice if necessary.
Disclaimer:
The above opinions given constitute general market commentary, and do not constitute the opinion or advice of IC Markets or any form of personal or investment advice.
Any opinions, news, research, analyses, prices, other information, or links to third-party sites contained on this website are provided on an "as-is" basis, are intended only to be informative, is not an advice nor a recommendation, nor research, or a record of our trading prices, or an offer of, or solicitation for a transaction in any financial instrument and thus should not be treated as such. The information provided does not involve any specific investment objectives, financial situation and needs of any specific person who may receive it. Please be aware, that past performance is not a reliable indicator of future performance and/or results. Past Performance or Forward-looking scenarios based upon the reasonable beliefs of the third-party provider are not a guarantee of future performance. Actual results may differ materially from those anticipated in forward-looking or past performance statements. IC Markets makes no representation or warranty and assumes no liability as to the accuracy or completeness of the information provided, nor any loss arising from any investment based on a recommendation, forecast or any information supplied by any third-party.

GBPUSD - Liquidity Grab & BoS Signals Bearish ReversalSmart Money Concepts (SMC) Analysis
1. Liquidity Sweep & Break of Structure (BOS):
Price consolidates above a trendline with multiple rejections (blue lines).
A liquidity grab occurs below this trendline – classic inducement setup.
After the grab, a bearish BOS (break of structure) is confirmed with a strong candle closing below the trendline and recent lows.
2. Order Block:
Price retested a 4H bearish order block (grey shaded zone) before rejection. This OB aligns with the last bullish candle before the drop.
Rejection from the OB confirms institutional interest (SMC).
3. Imbalance / Fair Value Gap (FVG):
The drop left a minor imbalance zone, suggesting possible continuation down to fill the inefficiency.
Price Action Analysis:
1. Trendline Break:
Ascending trendline has been broken with strong bearish momentum.
Indicates a shift from higher lows to lower lows → possible trend reversal.
2. Supply Zone Respect:
The price failed to make a new high and was firmly rejected at resistance.
Double top or lower high formation adds bearish confluence.
3. Target & Risk-Reward:
The trade setup indicates a short entry just below trendline break.
Target around 1.29393, likely based on previous demand zone or liquidity pocket.
Stop above 1.33664, likely above the OB or structural high.
Solid RRR (>3:1) visible.
Confluences Supporting Bearish Bias:
Break of internal structure (Price Action)
Liquidity sweep below trendline (SMC)
Bearish Order Block rejection (SMC)
Strong bearish engulfing candle
Favourable RR trade plan
Conclusion:
This is a high-probability bearish setup combining a trendline liquidity sweep (inducement), break of structure, order block rejection, and efficient risk-reward positioning. The price is expected to target 1.29393, aligning with a previous demand or liquidity zone.
Thanks for your time..

Bearish breakout off pullback support?GBP/USD is reacting off the support level which is a pullback support that lines up with the 78.6% Fibonacci projection and could drop from this level to our takeprofit.
Entry: 1.3252
Why we like it:
There is a pullback support level that lines up with the 78.6% Fibonacci projection.
Stop loss: 1.3332
Why we like it:
There is an overlap resistance level.
Take profit: 1.3163
Why we like it:
There is a pullback support level that lines up with the 161.8% Fibonacci extension.
Enjoying your TradingView experience? Review us!
Please be advised that the information presented on TradingView is provided to Vantage (‘Vantage Global Limited’, ‘we’) by a third-party provider (‘Everest Fortune Group’). Please be reminded that you are solely responsible for the trading decisions on your account. There is a very high degree of risk involved in trading. Any information and/or content is intended entirely for research, educational and informational purposes only and does not constitute investment or consultation advice or investment strategy. The information is not tailored to the investment needs of any specific person and therefore does not involve a consideration of any of the investment objectives, financial situation or needs of any viewer that may receive it. Kindly also note that past performance is not a reliable indicator of future results. Actual results may differ materially from those anticipated in forward-looking or past performance statements. We assume no liability as to the accuracy or completeness of any of the information and/or content provided herein and the Company cannot be held responsible for any omission, mistake nor for any loss or damage including without limitation to any loss of profit which may arise from reliance on any information supplied by Everest Fortune Group.

GBPUSD | 02.05.2025SELL 1.33000 | STOP 1.34600 | TAKE 1.31400 | Let's consider building a descending structure of price movement to the nearest short-term support levels. Technically, the pressure on the British pound continues from the local maximums.

GBPUSD – 30m Buy Setup | FVG Entry + ChoCh + -27% Fib Target💷 GBPUSD Long Setup | May 8, 2025 | 30m Smart Money Model
This 30-minute GBPUSD chart shows a perfect Smart Money shift backed by a clean Change of Character (ChoCh), a deep pullback into a Fair Value Gap (FVG), and confirmation via breaker block reentry.
Let’s break it down:
🔍 KEY CONFLUENCES:
🟪 FVG between 1.32909 – 1.33112
🔄 ChoCh confirms structural shift from bearish to bullish
📉 Entry inside 50–79% Fib retracement (Discount Zone)
🧱 Breaker Block confluence with internal BOS
🎯 Target: -27% Fib extension = 1.33737
🛡️ Stop below 100% Fib ~1.32400
📈 Setup Specs:
Timeframe: 30min
Bias: Long
Entry Zone: 1.33090 – 1.33110
TP: 1.33737 (Fib -27%)
SL: ~1.32400
RR: Approx. 1:3.5+
💡 Why It Matters:
Smart Money often accumulates positions in hidden imbalances like this FVG zone. Retail traders get shaken out on the pullback — meanwhile institutions reload just below previous liquidity sweeps. The ChoCh confirms the shift, and boom — the liquidity vacuum fuels a launch to premium levels.
🎯 Chart Ninja Tip:
“ChoCh isn’t just a signal… it’s a signature. It tells you Smart Money is changing sides.”

GBP/USD is setting the stage for a deep correction — Don’t chaseA Smart Money trap is unfolding as price enters a major supply zone. Prepare for a sharp move.
GBP/USD is now testing a critical supply zone near 1.3300–1.3500, where institutional sellers are likely to activate.
According to Smart Money Concept (SMC) and Market Structure, we are anticipating a liquidity grab followed by a deep corrective move towards the 1.2500–1.2300 demand zone.
Key Insights:
– Major Supply Zone: 1.3300–1.3500 is the key area for potential reversals
– Expected Move: Short-term bullish exhaustion → Strong sell-off towards 1.2500
– Mid-Term Outlook: After the correction, bullish continuation possible but only from lower demand zones
– Strategy: Wait for bearish confirmation at supply zone before selling | Look for buying opportunities closer to 1.2300 if structure shifts bullish
Smart traders wait for clean entries

GBPUSD: Bullish Fakeout at Key 50% Fibonacci Level🚀After a brief consolidation near the 50% Fibonacci retracement, price performs a bullish fakeout, signaling its intention to move higher.
The 14:00 candle stands out as a clear sign of strength from buyers.
🔍 Trade Setup
📍 Entry limit:
⛔ Stop Loss:
🎯 Take Profit:
⚖️ Risk/Reward: ≈
💬 What’s your outlook on GBPUSD?
Is this the start of a new leg up?
Share your thoughts in the comments 👇

Weekly Forecasts UPDATES! ALL Markets Analyzed! Stocks & FOREXIn this Weekly Forecast UPDATE, we will analyze the S&P 500, NASDAQ, DOW JONES, Gold and Metals futures, and the FOREX Majors for Thursday, May 8th.
The targets set in last weekend's forecasts are still in play! Trade accordingly.
Enjoy!
May profits be upon you.
Leave any questions or comments in the comment section.
I appreciate any feedback from my viewers!
Like and/or subscribe if you want more accurate analysis.
Thank you so much!
Disclaimer:
I do not provide personal investment advice and I am not a qualified licensed investment advisor.
All information found here, including any ideas, opinions, views, predictions, forecasts, commentaries, suggestions, expressed or implied herein, are for informational, entertainment or educational purposes only and should not be construed as personal investment advice. While the information provided is believed to be accurate, it may include errors or inaccuracies.
I will not and cannot be held liable for any actions you take as a result of anything you read here.
Conduct your own due diligence, or consult a licensed financial advisor or broker before making any and all investment decisions. Any investments, trades, speculations, or decisions made on the basis of any information found on this channel, expressed or implied herein, are committed at your own risk, financial or otherwise.

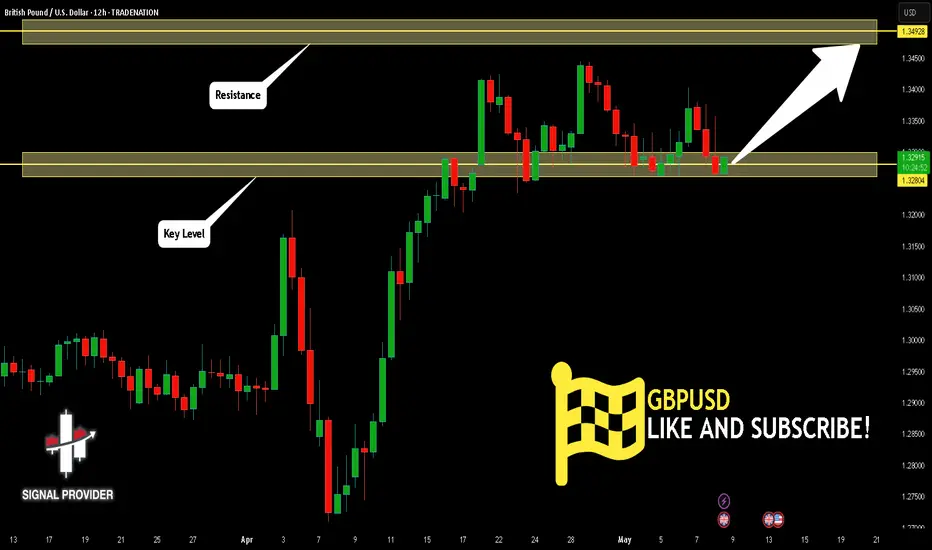
GBPUSD Is Bullish! Long!
Take a look at our analysis for GBPUSD.
Time Frame: 12h
Current Trend: Bullish
Sentiment: Oversold (based on 7-period RSI)
Forecast: Bullish
The market is testing a major horizontal structure 1.328.
Taking into consideration the structure & trend analysis, I believe that the market will reach 1.349 level soon.
P.S
Overbought describes a period of time where there has been a significant and consistent upward move in price over a period of time without much pullback.
Disclosure: I am part of Trade Nation's Influencer program and receive a monthly fee for using their TradingView charts in my analysis.
Like and subscribe and comment my ideas if you enjoy them!
GBPUSD range bound ahead of BoE Rate Decision GBP/USD maintains a bullish bias, with the broader trend and structure supporting upside continuation. The recent intraday move appears to be an overbought corrective pullback toward a key prior consolidation area.
Key Support: 1.3210 – aligns with the previous consolidation zone and potential bullish inflection point.
Upside Targets:
1.3435 – initial resistance level
1.3500 and 1.3580 – medium to long-term bullish targets
If price finds support at 1.3210 and forms a bullish reversal, it would confirm the continuation of the uptrend toward the mentioned resistance levels.
However, a break and daily close below 1.3210 would invalidate the bullish scenario, suggesting deeper retracement toward 1.3120, with further support at 1.3015 and 1.2980.
Conclusion
GBP/USD remains bullish above 1.3210. Look for a bounce from this level to confirm upside continuation. A daily close below 1.3210 would turn the outlook bearish, exposing lower support levels.
This communication is for informational purposes only and should not be viewed as any form of recommendation as to a particular course of action or as investment advice. It is not intended as an offer or solicitation for the purchase or sale of any financial instrument or as an official confirmation of any transaction. Opinions, estimates and assumptions expressed herein are made as of the date of this communication and are subject to change without notice. This communication has been prepared based upon information, including market prices, data and other information, believed to be reliable; however, Trade Nation does not warrant its completeness or accuracy. All market prices and market data contained in or attached to this communication are indicative and subject to change without notice.

GBPUSD - UniverseMetta - Signal#GBPUSD - UniverseMetta - Signal
W1 - Formation of 3 stop candles from the level, which may indicate a potential change in trend.
D1 - Formation of the 3rd wave + 3rd fractal/peak. . Stop behind the maximum of the 2nd wave.
Entry: 1.32548
TP: 1.31381 - 1.30654 - 1.29492 - 1.27081
Stop: 1.34080
More signals in our groups

GBP/USD Pressure Mounts on Weak UK DataThe GBP/USD currency pair faced downward pressure on Wednesday, largely due to disappointing data from the UK’s Purchasing Managers Index (PMI). This index showed a contraction in private sector business activity for April, signaling potential challenges in the UK economy. As a result, the Pound Sterling weakened against its major counterparts during European trading hours, reflecting growing concerns among investors about the economic outlook.
As the day progressed, the focus shifted to the US Dollar (USD), which was buoyed by increasing optimism regarding easing tensions between the United States and China. Investors reacted positively to news surrounding potential diplomatic efforts and economic collaborations, leading to a stronger USD and further pulling the GBP/USD pair lower. This shift in sentiment highlights how geopolitical developments can significantly impact currency markets.
Interestingly, the price action in the GBP/USD pair reached a notable Weekly Supply zone. This area has historically acted as a resistance level, and despite the current bearish trend, many retailers remain bullish on the Pound. This divergence in sentiment suggests that traders are closely monitoring the situation for signs of a reversal. Given the current conditions, there is speculation that the pair could experience a turnaround as it interacts with this important price level.
Overall, the dynamics between the GBP and USD underscore the ongoing volatility in the foreign exchange market, driven by economic data and geopolitical events. Moving forward, market participants will likely keep a close eye on upcoming indicators and developments that could influence the trajectory of this currency pair, particularly in light of the recent fluctuations and the current positioning within the Weekly Supply zone.
Weekly chart 6B1!
✅ Please share your thoughts about GBP/USD in the comments section below and HIT LIKE if you appreciate my analysis. Don't forget to FOLLOW ME; you will help us a lot with this small contribution.

gbpusd 2025-5-8today price is near ssl side so we expect price go up
two ssl level are in the chart when price reach to this level we wait to see up setup then entre.
on top we have fvg 1hour that price reach to this level nwe csn tradde on it .

GBP Steady Near $1.33, BoE Rate Cut ExpectedThe British pound hovered near $1.33 as traders awaited the BoE’s decision, with a 25 bps cut to 4.25% widely expected. Markets are also eyeing new economic forecasts for signals of further easing. While Trump’s tariff plans have stoked global slowdown fears, the UK is less exposed due to a U.S. goods surplus. A fresh trade deal with India, expected to generate £4.8 billion annually by 2040, may also cushion the economy.
If GBP/USD breaks above 1.3430, resistance levels come in at 1.3500 and 1.3550. Support lies at 1.3200, followed by 1.3050 and 1.2960.

CadChf daily bias confirmedGood day traders, I’m back with CadChf but this one is special cause it provides us a clean setup where I will get an opportunity to explain some of ICT concepts that I look for and have made me the trader I am today but I’m not here to talk about Michael!! Just his thoughts behind this type of setup.
Well my excitement is that this setup is happening on the daily timeframe so hopefully it’ll be much more understandable. First let’s start with some tape reading on the left hand side we can see that price has been bearish and have reason to believe that price has bottomed as we can see that price left a low only to later take out creating a new one than made a run higher shifting structure on the lower TF’s but here on the daily what price did was leave the first presented FVG which you can see on the chart I have marked it. Back to the tape, if you take a closer look at that F.PFVG you’ll see that price only touch the upper quarter of the level and price made a move higher. Here why I said this one was special👂 ICT teaches how to look at price from a naked eye just by dividing gaps, FVG and OB’s and more.. by 4 quarters and FIB retrace works wonders here 0,25,50,75,100. 50 being the midpoint. Price from experience since paying attention to details always comes for the F.PFVG midpoint ATLEAST!🔊
If you look at the chart again you’ll see a red arrow pointing to that wick’cosidered a gap’, now if we consider that wick a gap than we gonna treat it as one. If you take you FIB and get the levels you’ll see price was a few pips shy of the midpoint of that gap!!👂
Our narrative than becomes…we wanna see price reach the midpoint of that wick considered a gap. Than we gonna shoot down if we can just get to that midpoint 🤞🏾
Because we cannot I repeat we cannot trust price, we can expect it to disrespect that buyside but not close higher 🛑✋, our draw on liquidity is the one below.
Please study this setup carefully 🙏🏽🙏🏽

GU-Thu-8/05/25 TDA-Eyes on BoE possible rate cut 0.25%!Analysis done directly on the chart
If BoE cuts rate, more easing policy. Printing
more money, easier access to credit, lower
cost of borrowing.
Not financial advice, DYOR.
Market Flow Strategy
Mister Y

GBPUSD H4 Bullish Bounce Off Based on the H4 chart analysis, the price is falling toward our buy entry level at 1.3168, a pullback support that aligns with the 38.2% Fibonacci retracement and the 161.8% Fibonacci extension.
Our take profit is set at 1.3289 a pullback resistance.
The stop loss is placed at 1.3079, a pullback support.
High Risk Investment Warning
Trading Forex/CFDs on margin carries a high level of risk and may not be suitable for all investors. Leverage can work against you.
Stratos Markets Limited (tradu.com):
CFDs are complex instruments and come with a high risk of losing money rapidly due to leverage. 63% of retail investor accounts lose money when trading CFDs with this provider. You should consider whether you understand how CFDs work and whether you can afford to take the high risk of losing your money.
Stratos Europe Ltd (tradu.com):
CFDs are complex instruments and come with a high risk of losing money rapidly due to leverage. 63% of retail investor accounts lose money when trading CFDs with this provider. You should consider whether you understand how CFDs work and whether you can afford to take the high risk of losing your money.
Stratos Global LLC (tradu.com):
Losses can exceed deposits.
Please be advised that the information presented on TradingView is provided to Tradu (‘Company’, ‘we’) by a third-party provider (‘TFA Global Pte Ltd’). Please be reminded that you are solely responsible for the trading decisions on your account. There is a very high degree of risk involved in trading. Any information and/or content is intended entirely for research, educational and informational purposes only and does not constitute investment or consultation advice or investment strategy. The information is not tailored to the investment needs of any specific person and therefore does not involve a consideration of any of the investment objectives, financial situation or needs of any viewer that may receive it. Kindly also note that past performance is not a reliable indicator of future results. Actual results may differ materially from those anticipated in forward-looking or past performance statements. We assume no liability as to the accuracy or completeness of any of the information and/or content provided herein and the Company cannot be held responsible for any omission, mistake nor for any loss or damage including without limitation to any loss of profit which may arise from reliance on any information supplied by TFA Global Pte Ltd.
The speaker(s) is neither an employee, agent nor representative of Tradu and is therefore acting independently. The opinions given are their own, constitute general market commentary, and do not constitute the opinion or advice of Tradu or any form of personal or investment advice. Tradu neither endorses nor guarantees offerings of third-party speakers, nor is Tradu responsible for the content, veracity or opinions of third-party speakers, presenters or participants.

Fed pleases everyone, except for one. BoE is next on the watchThe Federal Reserve came out with its rate decision and it seems that all market participants got pleased, except for one.
Today it's the BoE's turn to deliver rates.
Let's dig in!
TVC:DJI
TVC:DXY
FX_IDC:GBPUSD
MARKETSCOM:100UK
Let us know what you think in the comments below.
Thank you.
77.3% of retail investor accounts lose money when trading CFDs with this provider. You should consider whether you understand how CFDs work and whether you can afford to take the high risk of losing your money. Past performance is not necessarily indicative of future results. The value of investments may fall as well as rise and the investor may not get back the amount initially invested. This content is not intended for nor applicable to residents of the UK. Cryptocurrency CFDs and spread bets are restricted in the UK for all retail clients.

GBPUSD SHORT FORECAST Q2 W19 D8 Y25GBPUSD SHORT FORECAST Q2 W19 D8 Y25
Professional Risk Managers👋
Welcome back to another FRGNT chart update📈
Diving into some Forex setups using predominantly higher time frame order blocks alongside confirmation breaks of structure.
Let’s see what price action is telling us today!
💡Here are some trade confluences📝
✅Weekly order block rejection
✅Daily order block rejection
✅Intraday 15' order blocks
✅Tokyo ranges to be filled
🔑 Remember, to participate in trading comes always with a degree of risk, therefore as professional risk managers it remains vital that we stick to our risk management plan as well as our trading strategies.
📈The rest, we leave to the balance of probabilities.
💡Fail to plan. Plan to fail.
🏆It has always been that simple.
❤️Good luck with your trading journey, I shall see you at the very top.
🎯Trade consistent, FRGNT X

GBPUSD | 1H | BULLGood Morning Traders;
My target level for GBP/USD is 1.33966—just wait for this level and stay patient.
I put in a lot of effort to prepare these analyses for you, so don’t hold back on showing your support with a like! A huge thank you to everyone who supports me—every single like is a source of motivation for me to keep sharing my insights.
