GBPUSD SHORT FORECAST Q2 W18 D1 Y25GBPUSD SHORT FORECAST Q2 W18 D1 Y25
Professional Risk Managers👋
Welcome back to another FRGNT chart update📈
Diving into some Forex setups using predominantly higher time frame order blocks alongside confirmation breaks of structure.
Let’s see what price action is telling us today!
💡Here are some trade confluences📝
✅Weekly order block rejection
✅Daily order block rejection
✅Daily high rejection
✅Daily imbalance fill targets
🔑 Remember, to participate in trading comes always with a degree of risk, therefore as professional risk managers it remains vital that we stick to our risk management plan as well as our trading strategies.
📈The rest, we leave to the balance of probabilities.
💡Fail to plan. Plan to fail.
🏆It has always been that simple.
❤️Good luck with your trading journey, I shall see you at the very top.
🎯Trade consistent, FRGNT X
GBPUSD

Bullish Rebound in Action: GBP/USD Bounces Off Key Demand Zone!Timeframe: 1-Hour (H1)
Ideal for short to medium-term intraday trades.
Support Zone (Entry):
Price bounced from a strong demand zone around 1.32800, suggesting a potential long entry.
Stop Loss:
Just below the green zone at approx. 1.32700
Target:
Resistance zone marked around 1.34500, offering high upside potential.
Bullish Price Action:
Strong bounce candle at support — indicating demand pressure and a possible reversal.
Favorable Risk-to-Reward:
Wide profit zone relative to stop loss, high RRR setup.

GBPUSD Analysis – Classic Spike, But Bearish Bias HoldsTwo days ago, TRADENATION:GBPUSD did what it often does – spiked above the previous high with no solid fundamental reason, likely just to hunt stops.
This return into the resistance zone might look bullish on the surface, but the bigger picture remains unchanged.
Has the market really resumed its up move, or was this just a trap?
Despite the upward push, the overall outlook stays bearish. A drop towards the 1.3000 zone is still highly probable – but we need confirmation.
Why the bearish scenario remains valid:
• The spike occurred without strong fundamental backing.
• Price hasn't broken the strong 1.35 resistance.
• Key support for a breakdown lies at 1.3330–1.3350 – a clear break here is the signal for downside continuation.
Trading Plan:
Wait for a break below 1.3330–1.3350, and then look for short setups on lower timeframes.
Invalidation comes only if the pair pushes and sustains above 1.3500, in which case the bearish thesis is off the table.
Disclosure: I am part of Trade Nation's Influencer program and receive a monthly fee for using their TradingView charts in my analyses and educational articles.

XAU/USD - Bearish Flag Pattern (25.04.2025)The XAU/USD Pair on the M30 timeframe presents a Potential Selling Opportunity due to a recent Formation of a Bearish Flag Pattern. This suggests a shift in momentum towards the downside in the coming hours.
Possible Short Trade:
Entry: Consider Entering A Short Position around Trendline Of The Pattern.
Target Levels:
1st Support – 3232
2nd Support – 3188
🎁 Please hit the like button and
🎁 Leave a comment to support for My Post !
Your likes and comments are incredibly motivating and will encourage me to share more analysis with you.
Best Regards, KABHI_TA_TRADING
Thank you.

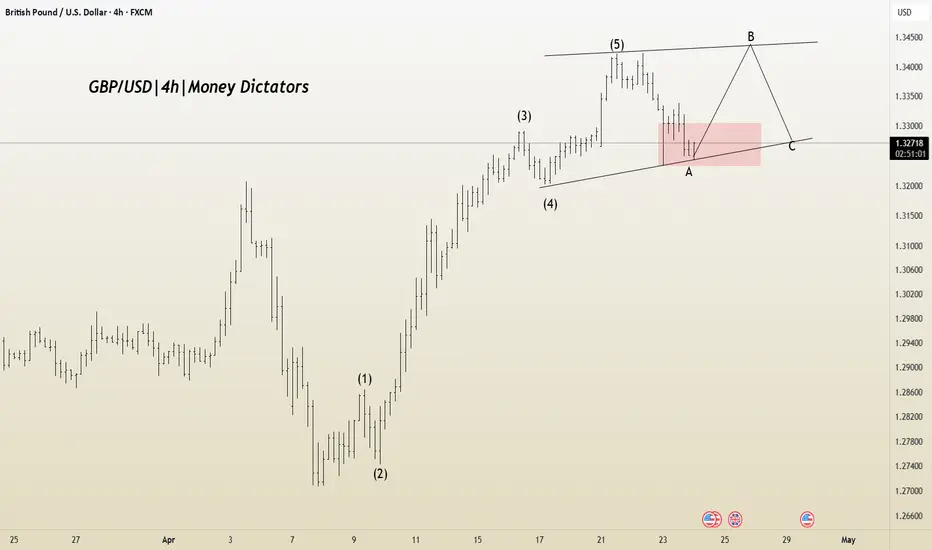
GBP/USD at a Turning Point – Correction Pattern in PlayIt appears that corrective Wave A in the GBP/USD pair is nearing completion, and Wave B may be forming. The Wave 1 to 5 structure seems to have been completed, indicating the beginning of an A-B-C corrective phase.
If the correction unfolds as expected, potential upside targets are 1.32918 and 1.33555. However, if the market faces rejection below the trendline, the stop-loss level would be 1.32021.
Bullish bounce?GBP/USD has bounced off the support level which is a pullback support that lines up wit the 71% Fibonacci retracement and could rise from this level to our take profit.
Entry: 1.3321
Why we like it:
There is a pullback support level that lines up with the 71% Fibonacci retracement.
Stop loss: 1.3281
Why we like it:
There is a pullback support level.
Take profit: 1.3385
Why we like it:
There is a pullback resistance level that is slightly above the 50% Fibonacci retracement.
Enjoying your TradingView experience? Review us!
Please be advised that the information presented on TradingView is provided to Vantage (‘Vantage Global Limited’, ‘we’) by a third-party provider (‘Everest Fortune Group’). Please be reminded that you are solely responsible for the trading decisions on your account. There is a very high degree of risk involved in trading. Any information and/or content is intended entirely for research, educational and informational purposes only and does not constitute investment or consultation advice or investment strategy. The information is not tailored to the investment needs of any specific person and therefore does not involve a consideration of any of the investment objectives, financial situation or needs of any viewer that may receive it. Kindly also note that past performance is not a reliable indicator of future results. Actual results may differ materially from those anticipated in forward-looking or past performance statements. We assume no liability as to the accuracy or completeness of any of the information and/or content provided herein and the Company cannot be held responsible for any omission, mistake nor for any loss or damage including without limitation to any loss of profit which may arise from reliance on any information supplied by Everest Fortune Group.

GBPUSD: First red dayHello traders and welcome back on this analysis regarding GBPUSD, as always I never try to predict the direction of the market, long and short are only the setup I'm currently looking for, during the day.
I use technical analysis exclusively to find a proper risk reward for my trades, eventually I position myself in the market.
GBPUSD looks currently pretty interesting to me, and I'm looking to complete a pump and dump template started on Monday.
Just few words about the previous week, the previous Tuesday which placed the weekly high, it's a level which began an interesting bearish move, and currently the market is retesting that level.
The previous Tuesday and Wednesday placed the weekly range, and I'm gonna see how the price will behave on the extreme.
This week, last week of April, I can see on Monday a strong impulsive move, which is our pump for the weekly template, the market triggered long breakout traders and closed as well above the previous week high, other time frames/big players are involved on further movements.
Tuesday, the market stayed pretty much inside, it kinda triggered the daily high, but the most important signal to me, is that it closed as a first red day after a full day of consolidation up high.
Today, a bearish move looks like has already started, but considering still plenty of space down low, I can still be looking for further downward move.
Major red news are on schedule at 10am NYT, so no action will be taken before that time.
However I will be looking for the market to pump up 25/50pip, coiling for an explosive bearish move, targeting the low of Monday (which would eventually complete the weekly pump and dump), and potentially trailing a partial even lower.
I will update this post after the news at 10am NYT
Gianni

IMP update for all Forex Traders Expect the Dollar Index (DXY) to appreciate in the near future. However, a further decline into the green highlighted region is possible before this upward movement. The green zone represents a potential key reversal area. Monitor the following currency pairs for trading opportunities if the DXY begins to climb:
BUY - USDCAD, USDCHF, USDSGD;
SELL - EURUSD, GBPUSD

GBPUSDIn our price range, we enter a long position if there is an entry trigger. We should also check the news time.

Double top mate! (GBP/USD)OK, it's not really a double top (although lots of people refer to these situations as such)
It's a re-test of the long term high and could see the current uptrend get rejected.
Can look to the daily chart for confirmation of the breakdown
Thoughts?

GBPUSD Will Grow! Buy!
Please, check our technical outlook for GBPUSD.
Time Frame: 3h
Current Trend: Bullish
Sentiment: Oversold (based on 7-period RSI)
Forecast: Bullish
The price is testing a key support 1.336.
Current market trend & oversold RSI makes me think that buyers will push the price. I will anticipate a bullish movement at least to 1.342 level.
P.S
Overbought describes a period of time where there has been a significant and consistent upward move in price over a period of time without much pullback.
Disclosure: I am part of Trade Nation's Influencer program and receive a monthly fee for using their TradingView charts in my analysis.
Like and subscribe and comment my ideas if you enjoy them!

GBPUSD long to yesterday's London session HighI'm taking a long with a target set at yesterday's London high.
My confluences are
Uptrend in the higher timeframes
Liquidity pool at a 50% fib level
Wick rejections at lower timeframes
Since today has been quite bearish so far this is a riskier trade. The reversal has not established itself yet completely.

GBPUSD(20250430)Today's AnalysisMarket news:
The European Central Bank expects prices to rise 2.9% over the next 12 months, up from 2.6% in February, according to a monthly survey released on Tuesday. This is the highest level since April 2024. The three-year indicator rose slightly to 2.5%. The ECB's first five-year forecast was 2.1%.
Technical analysis:
Today's buying and selling boundaries:
1.3409
Support and resistance levels:
1.3471
1.3448
1.3433
1.3385
1.3370
1.3347
Trading strategy:
If the price breaks through 1.3409, consider buying, the first target price is 1.3433
If the price breaks through 1.3385, consider selling, the first target price is 1.3370

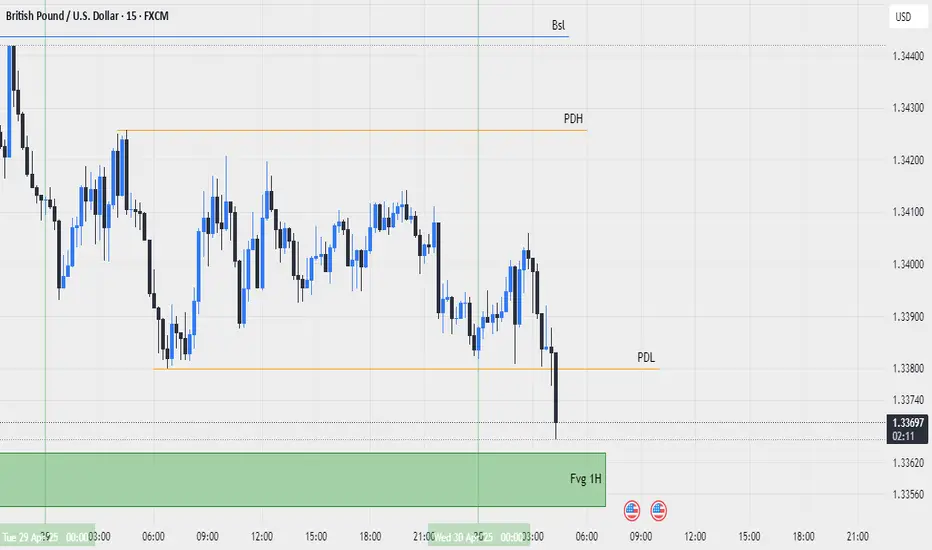
gbpusd 2025-4-30today price is below od pdl so we expect price go up
on bottom of this price we have fvg 1hour ,if price reach to this level we must wait to see up setup and trade on it
GBPUSD long to yesterday's highGBPUSD is showing bullish sentiment and rejection from one of the liquidity pools resting under yesterday's low. I took a long position targeting yesterday's high but it could go higher than that with the news.

Fundamental Market Analysis for April 30, 2025 GBPUSDThe GBP/USD pair continues to fall for the second consecutive session, hovering near 1.3390 during Asian trading on Wednesday. The pair has been under pressure as the US dollar has strengthened amid renewed optimism over trade developments between the US and China. Traders are now turning their attention to the upcoming release of the March Personal Consumption Expenditure (PCE) price index, which is a key inflation gauge for the Federal Reserve.
The U.S. Dollar Index (DXY), which measures the dollar's exchange rate against six major currencies, remains above 99.00, suggesting U.S. Treasury yields are rising. The 2-year and 10-year US bond yields broke a four-day losing streak and were trading around 3.66 per cent and 4.17 per cent respectively at the time of writing.
On the data front, the JOLTS US job openings report released on Tuesday showed a decline in the number of open positions to 7.19 million in March - the lowest level since September 2024 - indicating a cooling in labour demand. The figure fell short of expectations and emphasised growing economic uncertainty.
Adding to GBP/USD's decline are rising expectations that the Bank of England (BoE) will cut rates at its May meeting. Lower inflation expectations in the United Kingdom (UK) and increasing global economic factors favour a rate hike.
Bank of England Governor Megan Green recently stated that tariffs proposed by US President Donald Trump could lead to lower inflation in the UK, although significant uncertainties remain over the broader economic impact and recent tax hikes for employers.
Trading recommendation: SELL 1.3390, SL 1.3420, TP 1.3300

Short term long play in GBPUSDGBPUSD is at a 50% fib level and is showing wicks to the downside. There isn't much liquidity in the market today but looks like there might be a short term long opportunity.
I'd use half risk since we are technically in a downtrend retracement currently.

GBPUSD SHORT FORECAST Q2 W18 D30 Y25GBPUSD SHORT FORECAST Q2 W18 D30 Y25
Professional Risk Managers👋
Welcome back to another FRGNT chart update📈
Diving into some Forex setups using predominantly higher time frame order blocks alongside confirmation breaks of structure.
Let’s see what price action is telling us today!
💡Here are some trade confluences📝
✅Weekly order block rejection
✅Daily order block rejection
✅Daily high rejection
✅Daily imbalance fill targets
🔑 Remember, to participate in trading comes always with a degree of risk, therefore as professional risk managers it remains vital that we stick to our risk management plan as well as our trading strategies.
📈The rest, we leave to the balance of probabilities.
💡Fail to plan. Plan to fail.
🏆It has always been that simple.
❤️Good luck with your trading journey, I shall see you at the very top.
🎯Trade consistent, FRGNT X

GBPUSD H1 I Bullish Bounce Off the 61.8%Based on the H1 chart analysis, the price is falling toward our buy entry level at 1.3339, a pullback support that aligns with the 61.8% Fibonacci retracement.
Our take profit is set at 1.3411, an overlap resistance.
The stop loss is placed at 1.3285, an overlap support.
High Risk Investment Warning
Trading Forex/CFDs on margin carries a high level of risk and may not be suitable for all investors. Leverage can work against you.
Stratos Markets Limited (tradu.com):
CFDs are complex instruments and come with a high risk of losing money rapidly due to leverage. 63% of retail investor accounts lose money when trading CFDs with this provider. You should consider whether you understand how CFDs work and whether you can afford to take the high risk of losing your money.
Stratos Europe Ltd (tradu.com):
CFDs are complex instruments and come with a high risk of losing money rapidly due to leverage. 63% of retail investor accounts lose money when trading CFDs with this provider. You should consider whether you understand how CFDs work and whether you can afford to take the high risk of losing your money.
Stratos Global LLC (tradu.com):
Losses can exceed deposits.
Please be advised that the information presented on TradingView is provided to Tradu (‘Company’, ‘we’) by a third-party provider (‘TFA Global Pte Ltd’). Please be reminded that you are solely responsible for the trading decisions on your account. There is a very high degree of risk involved in trading. Any information and/or content is intended entirely for research, educational and informational purposes only and does not constitute investment or consultation advice or investment strategy. The information is not tailored to the investment needs of any specific person and therefore does not involve a consideration of any of the investment objectives, financial situation or needs of any viewer that may receive it. Kindly also note that past performance is not a reliable indicator of future results. Actual results may differ materially from those anticipated in forward-looking or past performance statements. We assume no liability as to the accuracy or completeness of any of the information and/or content provided herein and the Company cannot be held responsible for any omission, mistake nor for any loss or damage including without limitation to any loss of profit which may arise from reliance on any information supplied by TFA Global Pte Ltd.
The speaker(s) is neither an employee, agent nor representative of Tradu and is therefore acting independently. The opinions given are their own, constitute general market commentary, and do not constitute the opinion or advice of Tradu or any form of personal or investment advice. Tradu neither endorses nor guarantees offerings of third-party speakers, nor is Tradu responsible for the content, veracity or opinions of third-party speakers, presenters or participants.

GBPUSD SELL/SHORTBy utilizing levels, historical patterns, , we can formulate a hypothesis that the market might follow a similar trajectory if bearish sentiment prevails.

Bullish bounce?The Cable (GBP/USD) is falling towards the pivot and could bounce to the 1st resistance.
Pivot: 1.3338
1st Support: 1.3276
1st Resistance: 1.3442
Risk Warning:
Trading Forex and CFDs carries a high level of risk to your capital and you should only trade with money you can afford to lose. Trading Forex and CFDs may not be suitable for all investors, so please ensure that you fully understand the risks involved and seek independent advice if necessary.
Disclaimer:
The above opinions given constitute general market commentary, and do not constitute the opinion or advice of IC Markets or any form of personal or investment advice.
Any opinions, news, research, analyses, prices, other information, or links to third-party sites contained on this website are provided on an "as-is" basis, are intended only to be informative, is not an advice nor a recommendation, nor research, or a record of our trading prices, or an offer of, or solicitation for a transaction in any financial instrument and thus should not be treated as such. The information provided does not involve any specific investment objectives, financial situation and needs of any specific person who may receive it. Please be aware, that past performance is not a reliable indicator of future performance and/or results. Past Performance or Forward-looking scenarios based upon the reasonable beliefs of the third-party provider are not a guarantee of future performance. Actual results may differ materially from those anticipated in forward-looking or past performance statements. IC Markets makes no representation or warranty and assumes no liability as to the accuracy or completeness of the information provided, nor any loss arising from any investment based on a recommendation, forecast or any information supplied by any third-party.

Gold Spot (XAU/USD) Bullish Setup: Buy Zone to Target Levels Gold Spot (XAU/USD) on the 1-hour timeframe. Key points:
Support Zone: Strong support is identified in the yellow zone around 3,290–3,293, where price has bounced multiple times.
Buy Zone: Market is currently in a potential buy zone just above support, signaling a possible long entry.
Targets:
1st target: Around 3,368
2nd target: Around 3,419
All-Time High: Marked as a potential long-term resistance above 3,500.
Outlook: If price respects the support and buy zone, the market may rally toward the 1st and 2nd targets. Watch for bullish confirmation before entering.

SHORT ON GBP/USDGBP/USD Has bearish divergence on the 4hr timeframe.
This is a bearish reversal indication. Price is also over brought on GU.
The Dollar (dxy) Looks like it will start to rise from its demand area.
I will be selling GU looking to catch over 300-400 pips to the previous swing low /demand zone.
