GBPUSD SHORT TRADE?GBPUSD Grab liquidity from buyside and close below range this shows the power of bears in the market and also dxy show strength so go short with sl above high
GBPUSD

CADCHF BULLISH OR BEARISH DETAILED ANALYSISCADCHF is currently trading around 0.59 and is showing a strong bullish wave setup on the 8H chart. Price has bounced cleanly from a key demand zone, with a visible bullish engulfing structure, suggesting buyers are stepping in aggressively. My target for this setup is 0.61, aligning with a previous major resistance level seen on the chart.
Fundamentally, CAD is supported by firm oil prices and hawkish sentiment from the Bank of Canada, while CHF has been under mild pressure due to reduced demand for safe-haven assets amid improving global sentiment. This macro backdrop favors CAD strength in the near term, adding fuel to the bullish technicals.
If the current momentum sustains, we could see a smooth continuation toward 0.61, with a favorable risk-reward ratio. As always, trade management and patience are key, especially as the pair approaches resistance. I remain bullish on CADCHF in the short term, based on both structure and fundamentals.

Pound Pressured by BOE Cut ExpectationsGBP/USD dipped to approximately 1.3425 during early Asian trading on Tuesday, as a slight rebound in the U.S. dollar put pressure on the pair. The dollar was supported by easing U.S.-China trade tensions, following China’s decision to exempt certain U.S. imports from tariffs, despite its denial of ongoing negotiations.
Meanwhile, expectations of a 25 basis point rate cut by the Bank of England in May continue to weigh on the pound. Markets are now focused on an upcoming speech by BoE Deputy Governor Dave Ramsden, with any dovish remarks likely to add further downside pressure on the GBP.
If GBP/USD breaks above 1.3430, resistance levels are at 1.3500 and 1.3550. Support is at 1.3200, followed by 1.3050 and 1.2960.

GBPUSD(20250429)Today's AnalysisMarket news:
The U.S. Treasury Department raised its second quarter debt forecast to $514 billion. U.S. Treasury Secretary: The "X Day" for the debt ceiling issue will be announced soon.
Technical analysis:
Today's buying and selling boundaries:
1.3387
Support and resistance levels:
1.3549
1.3488
1.3449
1.3325
1.3286
1.3225
Trading strategy:
If the price breaks through 1.3449, consider buying, the first target price is 1.3488
If the price breaks through 1.3387, consider selling, the first target price is 1.3325

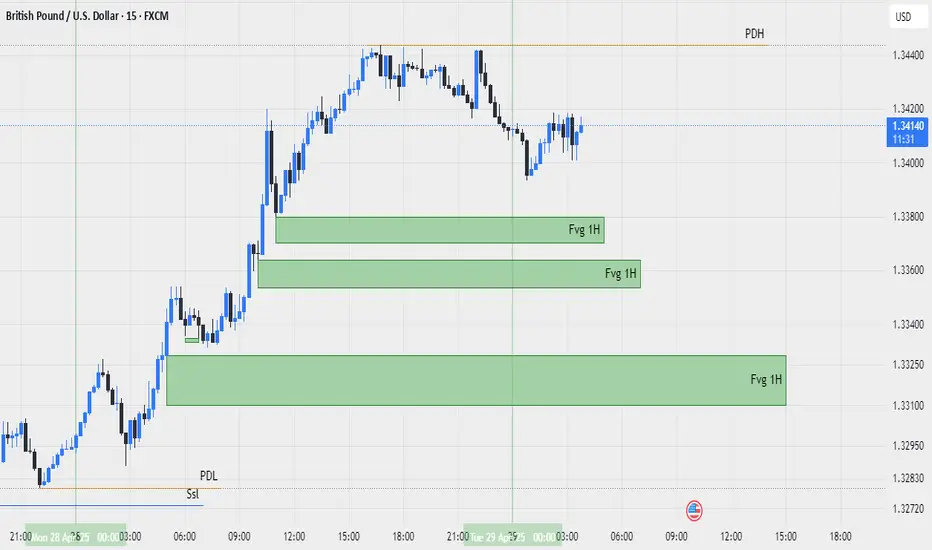
gbpusd 2025-4-29we have some level for trade
on top we have pdh , when price go up and reach to this level we wait to see sell setup
on bottom we have some fvg 1h , when price go down and reach to this level we wait to see buy setup , second fvg is more confident
Potential sell of GBPUSDGBPUSD is currently at a 50% fib retracement area. If it breaks a short term low, it could move to the down-side. News are coming in an hour though so anything could happen. Need more confirmation to enter (a few wicks and a break of a STL).

GU-Tue-29/04/25 TDA-Interesting GBP strength yesterday!Analysis done directly on the chart
Interesting GBP strength yesterday compared to its peers
USD, EUR. What could possibly fueled this move up?
Amid of US-China trade war potential negotiation and ahead
of next important week of interest rate decisions.
Comment down below your thoughts!
Not financial advice, DYOR.
Market Flow Strategy
Mister Y

GBP/USD - Watch out for a possible rejection!The British pound is currently moving towards the upside, showing a gradual but steady climb. However, it is approaching a significant resistance area that could pose a challenge to further gains.
-------------------------------
Double top
This resistance zone was previously a strong support level before the market formed a double top pattern and subsequently broke below it. As is often the case in technical analysis, this former support has now flipped into resistance, making it a key area where price could face strong selling pressure and potential rejection.
-------------------------------
1h FVG
Adding to the confluence, this resistance zone aligns closely with a 1h Fair Value Gap (FVG). FVGs often attract price back into them before a reaction occurs, making this area even more significant for a potential reversal.
-------------------------------
Golden Pocket
Just below the FVG lies the "Golden Pocket", the 61.8% Fibonacci retracement level from the most recent drawdown. The Golden Pocket is one of the most closely watched Fibonacci levels by traders and is known for its strong influence on price action. Its proximity to the current structure increases the likelihood of a notable reaction, as many market participants will be watching this area closely for signs of rejection.
-------------------------------
Conclusion
Overall, the combination of previous support-turned-resistance, the 1-hour FVG, and the Golden Pocket retracement forms a high-probability zone where the British pound could encounter heavy resistance and a potential downside move.
-------------------------------
Thanks for your support.
- Make sure to follow me so you don't miss out on the next analysis!
- Drop a like and leave a comment!

GBPUSD H4 | Bearish Reversal Based on the H4 chart analysis, we can see that the price is testing our sell entry at 1.3431 which is a swing high resistance.
Our take profit will be at 1.3294 an overlap support level.
The stop loss will be placed at 1.3558, above the 161.8% Fibo extension.
High Risk Investment Warning
Trading Forex/CFDs on margin carries a high level of risk and may not be suitable for all investors. Leverage can work against you.
Stratos Markets Limited (tradu.com):
CFDs are complex instruments and come with a high risk of losing money rapidly due to leverage. 63% of retail investor accounts lose money when trading CFDs with this provider. You should consider whether you understand how CFDs work and whether you can afford to take the high risk of losing your money.
Stratos Europe Ltd (tradu.com):
CFDs are complex instruments and come with a high risk of losing money rapidly due to leverage. 63% of retail investor accounts lose money when trading CFDs with this provider. You should consider whether you understand how CFDs work and whether you can afford to take the high risk of losing your money.
Stratos Global LLC (tradu.com):
Losses can exceed deposits.
Please be advised that the information presented on TradingView is provided to Tradu (‘Company’, ‘we’) by a third-party provider (‘TFA Global Pte Ltd’). Please be reminded that you are solely responsible for the trading decisions on your account. There is a very high degree of risk involved in trading. Any information and/or content is intended entirely for research, educational and informational purposes only and does not constitute investment or consultation advice or investment strategy. The information is not tailored to the investment needs of any specific person and therefore does not involve a consideration of any of the investment objectives, financial situation or needs of any viewer that may receive it. Kindly also note that past performance is not a reliable indicator of future results. Actual results may differ materially from those anticipated in forward-looking or past performance statements. We assume no liability as to the accuracy or completeness of any of the information and/or content provided herein and the Company cannot be held responsible for any omission, mistake nor for any loss or damage including without limitation to any loss of profit which may arise from reliance on any information supplied by TFA Global Pte Ltd.
The speaker(s) is neither an employee, agent nor representative of Tradu and is therefore acting independently. The opinions given are their own, constitute general market commentary, and do not constitute the opinion or advice of Tradu or any form of personal or investment advice. Tradu neither endorses nor guarantees offerings of third-party speakers, nor is Tradu responsible for the content, veracity or opinions of third-party speakers, presenters or participants.

GBPUSD: Eyeing a Bullish Structure Shift - A Wyckoffian ApproachGBPUSD 🚦 Technical Analysis & Trade Plan
📊 Current Market Structure
The GBPUSD 4-hour chart is currently consolidating just below a set of equal highs, indicating a potential liquidity pool above. Price action has shown a series of higher lows, suggesting underlying bullish pressure. The market is in a range, with buyers and sellers in equilibrium, but the clustering of highs signals a likely stop-hunt or breakout scenario.
🧠 Wyckoff Perspective
From a Wyckoff standpoint, the market appears to be in the late stages of accumulation. The equal highs represent a classic “creek” or resistance, where smart money may engineer a breakout to trigger stops and induce breakout traders. A successful breakout, followed by a retrace to retest the broken highs (now support), and a subsequent bullish structure break, would confirm the presence of strong demand and the start of a mark-up phase.
🌍 Fundamental Backdrop
Fundamentally, GBP has been supported by resilient UK economic data and a slightly hawkish tone from the Bank of England, while the USD faces headwinds from softer inflation prints and dovish Fed rhetoric. However, geopolitical risks and global risk sentiment remain key drivers, so any sudden shifts could impact the pair.
📰 Current Sentiment
Market sentiment is cautiously optimistic for GBPUSD. CFTC positioning shows a reduction in net GBP shorts, and recent price action reflects a willingness to buy dips. However, the presence of equal highs suggests that many traders are watching for a breakout, increasing the likelihood of a stop-run before a genuine move higher.
🏦 Trade Idea
Entry: Buy on a confirmed break above the current equal highs (around 1.3340), wait for a retrace to retest the broken highs, and enter long on a bullish structure break (e.g., a higher low and bullish engulfing candle).
Stop Loss: Place stops below the retracement low (e.g., below 1.3300).
Take Profit: Target the next significant resistance zone (e.g., 1.3400–1.3450), scaling out as price approaches these levels.
Risk Management: Risk no more than 1–2% of your trading capital on this setup.
⚠️ Disclaimer
Trading forex involves significant risk and may not be suitable for all investors. The analysis and trade idea provided are for educational purposes only and do not constitute financial advice. Always conduct your own research and consult with a licensed financial advisor before making trading decisions.

GU Liquidity Game—Institutional Absorption vs. Breakout MomentumGBP/USD Hourly Analysis & Trade Execution
I’ve been closely tracking GBP/USD, and now price is sitting at 1.34208, testing the critical resistance zone at 1.34250. Bulls have maintained control, but I’m watching closely for institutional absorption or signs of exhaustion.
Market Structure & Key Zones
Major Resistance: 1.34250-1.34500 → If buyers hold, price could extend toward 1.34500.
Support at 1.33800-1.33950 → A possible demand zone if price pulls back before pushing higher.
Liquidity Trap Below 1.33650 → A quick dip below 1.33800, followed by aggressive buying, would indicate institutional positioning.
Momentum & Trend Confirmation
RSI (1-hour): 66.38 → Bullish, but nearing exhaustion territory.
Stochastic RSI (1-hour): 61.27 → Buyers are in control but watching for signs of slowing momentum.
Stochastic Fast (1-hour): 60.54 → Trend is intact, but reversal signals could emerge near resistance.
Trade Management Strategy
Setup: Bullish Breakout Continuation
Since price is testing 1.34250, I’ll hold my long position if buyers show sustained strength.
Entry: Holding long if price stabilizes above 1.34250.
Stop Loss: Adjusted to 1.33950 to lock in gains.
Target 1: 1.34500, strong resistance level.
Target 2: 1.34650, extended play if volume supports the breakout.
Setup: Liquidity Sweep & Reversal
If price rejects 1.34250, I’ll look for a pullback setup before re-entering long.
Entry: If price dips below 1.33800 but aggressively reclaims 1.34000, re-enter long.
Stop Loss: Below 1.33650, ensuring tight risk control.
Target 1: 1.34150, reclaiming previous resistance.
Target 2: 1.34350, profit zone if buyers remain strong.
Institutional Activity & Order Flow Considerations
Liquidity Sweeps Below 1.33850 → If price dips but quickly recovers, it could be a stop-hunt before continuation.
Absorption Near 1.34250 → If price holds steady here without sharp rejection, buyers may be absorbing sell-side liquidity.
Volume Confirmation at 1.34150 → If volume remains strong, further upside toward 1.34500 is likely.
Final Execution Adjustments
Monitoring order flow to assess whether institutions are accumulating or distributing positions near resistance.
Watching volume absorption and candle behavior near 1.34250.
Right now, GBP/USD is at a pivotal level—if buyers sustain above 1.34250, the trend continuation toward 1.34500-1.34650 is in play. However, failure to hold may signal institutional selling, triggering a pullback before another bullish attempt.

GBPUSD: Will Keep Falling! Here is Why:
The charts are full of distraction, disturbance and are a graveyard of fear and greed which shall not cloud our judgement on the current state of affairs in the GBPUSD pair price action which suggests a high likelihood of a coming move down.
Disclosure: I am part of Trade Nation's Influencer program and receive a monthly fee for using their TradingView charts in my analysis.
❤️ Please, support our work with like & comment! ❤️

GBPUSD...LONGOANDA:GBPUSD
Market structure suggests is preparing for its next move. The AND level will likely play a critical role in the upcoming direction.
If structure breaks and confirms the shift, a new bias might form after the retest.

GBPUSD Analysis 10:37am 4/28. Happy Monday! GBP/USD Hourly Analysis & Day Trading Perspective
I’m looking at GBP/USD on the hourly timeframe, where price is now sitting at 1.339, confirming strong bullish momentum after breaking past key resistance. Here's how I'm approaching today's trading plan:
Market Structure & Key Levels
Resistance at 1.33850-1.34000 – Price is testing this level, and volume confirmation will determine whether we continue upward.
Support at 1.33650-1.33700 – If we see a pullback, this zone could act as a strong bounce area.
Institutional Interest at 1.33250-1.33300 – A liquidity zone where major players may absorb sell-side pressure.
Momentum & Trend Strength
RSI (1-hour): 88.88 → Overbought, meaning we might see consolidation or a retrace before another leg up.
CCI (1-hour): 81.81 → Still bullish, but exhaustion signs are creeping in.
Stochastic RSI (1-hour): 83.32 → Buyers are still in control, but reversals become more likely at extreme readings.
Directional Strength & Trend Confirmation
ADX (1-hour): 13.38 → Weak trend strength, suggesting that price could start ranging.
DX (1-hour): 79.92 → A strong push confirms market participation.
Day Trading Plan
Setup: Bullish Breakout Continuation
Since price has cleared 1.33650, the breakout play is already in motion. Here’s how I’m managing the setup:
Entry: Holding long as price remains above 1.33850, with strong buying pressure.
Target 1: 1.34000, a psychological barrier where liquidity may sit.
Target 2: 1.34250, next significant resistance.
Setup: Liquidity Sweep & Reversal
If price retraces, I’ll look for signs of institutional absorption before considering re-entry.
Entry: If price dips below 1.33650 but quickly reclaims 1.33800, I’ll look for confirmation of a reversal.
Target 1: 1.33950, previous high.
Target 2: 1.34200, extended move.
Order Flow & Volume Profile Considerations
Institutional Absorption: If price briefly drops below 1.33800 but quickly reclaims it, institutions could be absorbing liquidity.
Liquidity Trap: A sharp sell-off into 1.33650 could trigger stop losses before a potential bounce.
Volume Confirmation: If buyers remain strong at 1.33850, the move toward 1.34000-1.34250 is more likely.
Risk Management & Execution Strategy
I’ll monitor candle closures above 1.33850 before committing to further upside targets.
If volume increases, I’ll hold for 1.34000; if it slows down, I’ll consider partial profit-taking.
Watching institutional behavior near 1.33650 will be key for catching potential liquidity grabs.
Right now, GBP/USD is at a critical decision point—either continuation toward 1.34000, or a pullback to absorb liquidity before the next push. The key is watching volume flow and price absorption for confirmation before executing further moves.

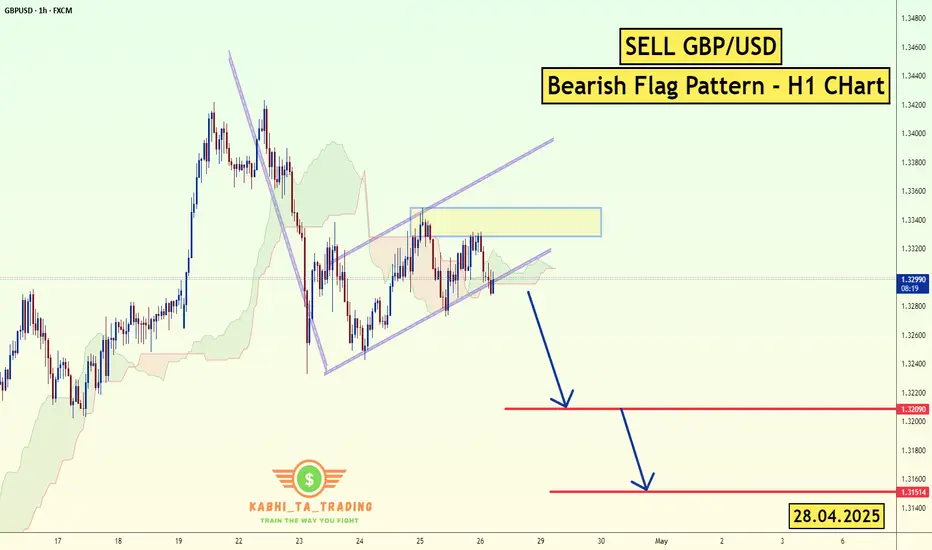
GBP/USD - H1 - Bearish Flag (28.04.2025)FX:GBPUSD The GBP/USD Pair on the H1 timeframe presents a Potential Selling Opportunity due to a recent Formation of a Bearish Flag Pattern. This suggests a shift in momentum towards the downside in the coming hours.
Possible Short Trade:
Entry: Consider Entering A Short Position around Trendline Of The Pattern.
Target Levels:
1st Support – 1.3209
2nd Support – 1.3151
🎁 Please hit the like button and
🎁 Leave a comment to support for My Post !
Your likes and comments are incredibly motivating and will encourage me to share more analysis with you.
Best Regards, KABHI_TA_TRADING
Thank you.
Fundamental Update :
on Monday as the trade tensions between the U.S. and China provided some relief to investors, while a stronger dollar further weighed on prices.
The U.S. dollar TVC:DXY rose 0.2% against a basket of currencies, making bullion more expensive for overseas buyers. TVC:DJI SP:SPX NASDAQ:IXIC also rising .
GBPUSD(20250428)Today's AnalysisMarket news:
The Fed's subsequent policy path considers two scenarios: First, there is no substantial progress in the negotiations between the United States and its trading partners. After 90 days, the US tariffs are still high. Weakened economic demand may prompt the Fed to cut interest rates starting in July, and the annual rate cut may reach 100 basis points; second, the negotiations are fruitful, tariffs are reduced, and the demand shock is small, but inflationary pressure continues. The Fed may postpone easing and only cut interest rates slightly in December. For the market, although the easing comes early in the first scenario, the "recession-style" rate cut may suppress risky assets.
Technical analysis:
Today's buying and selling boundaries:
1.3309
Support and resistance levels:
1.3379
1.3353
1.3336
1.3282
1.3265
1.3239
Trading strategy:
If the price breaks through 1.3309, consider buying, the first target price is 1.3336
If the price breaks through 1.3282, consider selling, the first target price is 1.3265

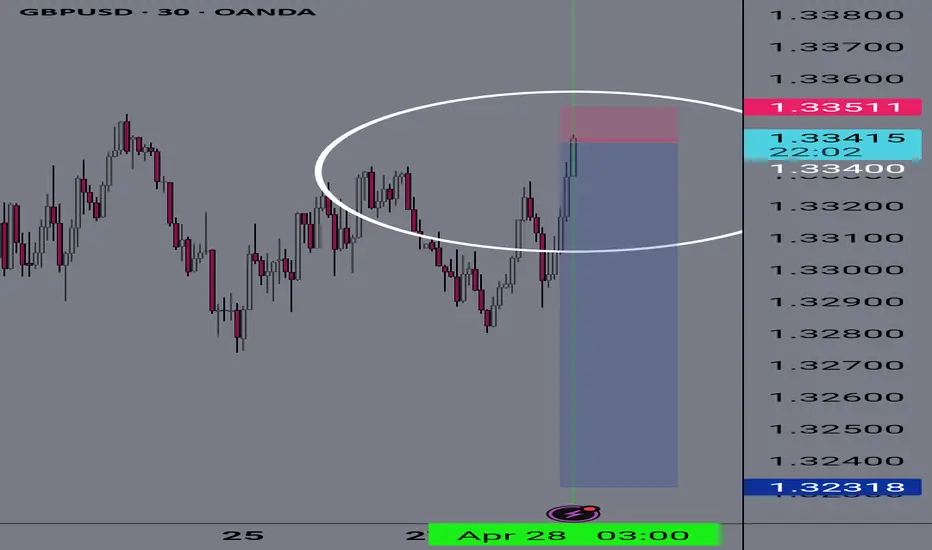
#GBPUSD: Major Swing Sell Coming On GU, What's your views? OANDA:GBPUSD , as discussed in our previous analysis, where we predicted price would reach our target area and then reject it. The price has almost reached this area, and we are now waiting for it to fully complete the move so that we can take a swing sell on the GBP. Currently, the British pound is stronger and bullish due to the UK’s strong economic growth. However, this is not the case for the US dollar. The dollar is struggling to keep up with other currencies and is currently the worst-performing currency of the month of April.
While focusing on GBPUSD as a pair, it has been extremely bullish since the start of April. However, we are now at a point where there are no strong reasons for the pair to remain bullish and continue its uptrend. There are fundamental signs that will eventually reverse the bearish trend.
Our advice to all is to wait for the price to do its thing. Once it reaches our target area, it may show strong bearish dominance. However, this is not a guarantee that it will behave as we expect. There are two targets that you can focus on once you trade is activated.
Good luck and trade safely!
Thank you for your unwavering support! 😊
If you’d like to contribute, here are a few ways you can help us:
- Like our ideas
- Comment on our ideas
- Share our ideas
Team Setupsfx_
❤️🚀

GBPUSD SELL NOW BUY LATER!Our previous idea played out perfectly once again! Currently, GBPUSD is showing signs of a pullback within a mini bearish trend. However, I still believe the overall structure remains bullish. I'll be watching for buying opportunities once this pullback completes. Stay patient and wait for confirmation!

GBP/USD BEARS ARE GAINING STRENGTH|SHORT
Hello, Friends!
The BB upper band is nearby so GBP-USD is in the overbought territory. Thus, despite the uptrend on the 1W timeframe I think that we will see a bearish reaction from the resistance line above and a move down towards the target at around 1.301.
Disclosure: I am part of Trade Nation's Influencer program and receive a monthly fee for using their TradingView charts in my analysis.
✅LIKE AND COMMENT MY IDEAS✅

LEAP: GBPUSD Week 18 Swing Zone/LevelsSlow and steady pace.
Last week, it was mentioned that trading zone/level is calculated between 0-1000.
This means price of importance is 1 of 2 values
1. x
2. 1000 -x
This week will be 065/935 in addition to the zone below.
As always price determines trades

GBPUSD BULLISH OR BEARISH DETAILED ANALYSIS ??GBPUSD is looking extremely bullish on the daily timeframe, showing strong signs of continuation after a healthy pullback. Currently trading around 1.33000, the pair has respected key Fibonacci levels and is now building momentum to target 1.37000. The structure remains intact with higher highs and higher lows, indicating strong buyer control and potential for further upside movement.
From a fundamental perspective, the British pound continues to outperform as the Bank of England maintains a relatively hawkish tone amid sticky inflation pressures, while the US dollar shows signs of weakening with softer economic data and growing expectations of Fed rate cuts later this year. This divergence between the monetary policies is creating a favorable environment for GBPUSD buyers to dominate.
Technical analysis also supports the bullish bias as price action remains well above the 0.786 Fibonacci retracement level, holding strong support near 1.31650. If price maintains above this zone and breaks past minor resistance near 1.33500, it could ignite a fresh bullish rally toward the psychological level of 1.37000, offering excellent risk-reward opportunities for trend-following traders.
Overall, GBPUSD is positioned perfectly for a strong bullish wave. Traders should stay focused on potential breakout confirmations and capitalize on the momentum, as current market conditions and fundamentals are aligned with a profitable bullish move. This setup remains one of the most attractive trending opportunities on the board right now.

RARE / 10R / Short....SGU @ 1.3340Rare but rewarding!
Just executed Short .... SGU @ 1.3340
💯 solid setup...watch this tank 📉
in engineering....we call this BUCKLE ;)
expecting min DD < 15p max RRR > 10
TP1 and SL as shown until final TP2 projected by system.
Sorry, alert is not based on TA like BoS or OB or SnR SnD PP or Fibs or even ICT etc....since designed to induce and seduce...rather based on multi-system confluence convergence and confirmations.... now system beeping let's test n see
IF u like this...would appreciate any feedback for continuous improvement...
🥂
Bulllish continuation for the Cable?GBP/USD is fallling towards the pivot and could bounce to the pullback resistance.
Pivot: 1.3110
1st Support: 1.3005
1st Resistance: 1.3415
Risk Warning:
Trading Forex and CFDs carries a high level of risk to your capital and you should only trade with money you can afford to lose. Trading Forex and CFDs may not be suitable for all investors, so please ensure that you fully understand the risks involved and seek independent advice if necessary.
Disclaimer:
The above opinions given constitute general market commentary, and do not constitute the opinion or advice of IC Markets or any form of personal or investment advice.
Any opinions, news, research, analyses, prices, other information, or links to third-party sites contained on this website are provided on an "as-is" basis, are intended only to be informative, is not an advice nor a recommendation, nor research, or a record of our trading prices, or an offer of, or solicitation for a transaction in any financial instrument and thus should not be treated as such. The information provided does not involve any specific investment objectives, financial situation and needs of any specific person who may receive it. Please be aware, that past performance is not a reliable indicator of future performance and/or results. Past Performance or Forward-looking scenarios based upon the reasonable beliefs of the third-party provider are not a guarantee of future performance. Actual results may differ materially from those anticipated in forward-looking or past performance statements. IC Markets makes no representation or warranty and assumes no liability as to the accuracy or completeness of the information provided, nor any loss arising from any investment based on a recommendation, forecast or any information supplied by any third-party.
