GBPUSD Release the Bulls! 4/15 at 1:09pmHello this is my take on GBPUSD. Given the broader bullish trend in GBP/USD, I believe a long trade is the best play right now, but I’ll be watching key technical levels and upcoming news events to time my entry properly.
Technical Indicators Supporting a Long Trade
Trend Confirmation:
The daily moving averages (EMA, MA, and TEMA) continue to show an upward trajectory, meaning GBP/USD remains in a solid bullish structure. The price is consistently trading above key averages, reinforcing the trend.
The Aroon Oscillator (AROONOSC) on the 4-hour chart is at 85.71, showing strong bullish control. This suggests upward momentum is likely to persist.
Momentum Indicators:
Relative Strength Index (RSI) on the daily timeframe is 76—this does suggest overbought conditions, but in a strong trend, RSI can stay elevated for long periods. Instead of treating this as a reversal signal, I take it as confirmation that buying pressure remains high.
Stochastic RSI (StochRSI) is also at 100 across multiple timeframes, indicating price exhaustion. While this could lead to a short-term pullback, it doesn’t necessarily mean a trend reversal—just that entering on a dip might provide a better price.
Volatility and Market Conditions:
Average True Range (ATR) is rising, meaning market volatility is picking up. This can be useful for timing entries—if I see a pullback within the rising ATR environment, it may be a good chance to enter before the next leg up.
Fundamental Factors to Watch
UK Employment Change (Feb) Beat Expectations:
The UK added 206K jobs, smashing the consensus forecast of 95K. A strong labor market fuels economic stability and consumer spending, which in turn supports the British Pound.
With employment data coming in hot, GBP could remain strong leading into the next major report.
Upcoming GBP Inflation Data (Apr 16):
UK inflation is forecast at 2.7% YoY for March, down slightly from 2.8%. If inflation remains stable or surprises higher, it could further support GBP, as traders anticipate possible moves from the Bank of England (BoE).
US Retail Sales and Powell’s Speech (Apr 16):
The US Retail Sales MoM is expected at 1.3%, but if it underperforms, it could signal weakening consumer demand and hurt the USD.
Fed Chair Powell’s speech could be a major volatility driver—if he hints at slower rate hikes or economic softness, USD could weaken, lifting GBP/USD higher.
US Jobless Claims (Apr 17):
Initial jobless claims forecast at 225K—if this number comes in higher, it might reinforce concerns about a weakening labor market and put more pressure on the Fed to ease policy.
My Trade Plan
Given all of this, I’m looking for a long entry but waiting for confirmation on the hourly chart before entering.
Ideal Entry:
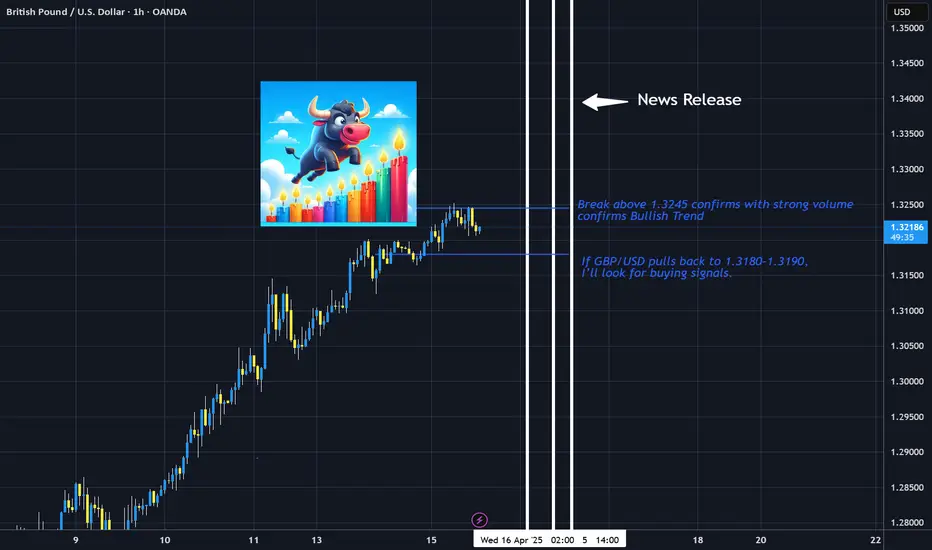
If GBP/USD pulls back to 1.3180–1.3190, I’ll look for buying signals (such as bullish candlestick formations or divergence in momentum indicators).
If it breaks above 1.3245 with strong volume, that could confirm further upside, and I might enter on the breakout instead.
Final Thoughts
The uptrend is strong, but I don’t want to enter at the peak of an overbought rally. Instead, I’ll wait for a pullback or a breakout confirmation before committing to the trade. Additionally, I’m keeping an eye on how the UK inflation numbers and Powell’s speech shape market sentiment over the next 48 hours.
All signs point toward GBP/USD continuing higher, but patience will be key in timing the best entry.
GBPUSD
GBPUSD SHORT FORECAST Q2 W16 D15 Y25GBPUSD SHORT FORECAST Q2 W16 D15 Y25
Morning Traders!
Let's await price action to tap into the weekly order block!
From then on, eyes open for 15' breaks of structure. Ensure that key higher low areas and double doubles for potential longs are broken before looking to short a fairly strong looking pound!
We simply await the pull back into s 15' order block that should be created post bearish move we have spoken of above. Upon the turn around in price action, we can be satisfied the bullish trend has exhaust somewhat.
Let's await the setup. No positions on GBPUSD until the above.
FRGNT X

GBPUSD Will Go Up From Support! Long!
Take a look at our analysis for GBPUSD.
Time Frame: 9h
Current Trend: Bullish
Sentiment: Oversold (based on 7-period RSI)
Forecast: Bullish
The market is testing a major horizontal structure 1.308.
Taking into consideration the structure & trend analysis, I believe that the market will reach 1.320 level soon.
P.S
The term oversold refers to a condition where an asset has traded lower in price and has the potential for a price bounce.
Overbought refers to market scenarios where the instrument is traded considerably higher than its fair value. Overvaluation is caused by market sentiments when there is positive news.
Disclosure: I am part of Trade Nation's Influencer program and receive a monthly fee for using their TradingView charts in my analysis.
Like and subscribe and comment my ideas if you enjoy them!

GBPUSD: Strong Bullish Market 🇬🇧🇺🇸
GBPUSD set a new daily high today.
The pair remains in a strong bullish momentum since 8th of April.
With the complete absence of high impact fundamentals today, buying pressure
may persist.
I believe that it may continue rising at least to 1.33 - the closest historic resistance.
❤️Please, support my work with like, thank you!❤️
I am part of Trade Nation's Influencer program and receive a monthly fee for using their TradingView charts in my analysis.

“GBP/USD Long Setup: Demand Zone Bounce Toward 1.35000 Target ”🔍 Trade Setup
🟦 Entry Point: 1.32171
➤ Price is near the 7 EMA – good for a possible bounce.
🟩 Demand Zone: 1.31761 - 1.31500
➤ This is where buyers previously stepped in.
➤ Strong support area – watch for bullish reversal candles here.
🔻 Stop Loss: 1.31141
➤ Below the demand zone to protect against a fakeout.
🎯 Target Point: 1.35000
➤ Big upside target – aiming for a strong rally.
⚖️ Risk to Reward
❌ Risk: 1.32171 → 1.31141 = ~103 pips
✅ Reward: 1.32171 → 1.35000 = ~283 pips
⚖️ R:R Ratio: ≈ 1:2.75 – very favorable!
✅ Summary
🔸 Trend is bullish with strong momentum
🔸 EMA is acting as dynamic support
🔸 Demand zone is clearly respected
🔸 Great R:R setup for a long trade

GBPAUD. Can we expect price to retrace higher?Good morning traders, we back with another idea on GBPAUD, yesterday I entered some positions and since I swing all my trades to TP/SL. Today morning following the AUD news, my stops were triggered but only due to ignorance because on Sunday as I was looking at it my plan was to enter today after the 8 am news on GBP. But it’s another lesson for the journal, on the daily TF this pair is ready to move lower but on this 1 hour we can see that price swept the liquidity below and failed to close below the lows, proving that price will move higher for our hourly high in purple.
But since I’ve hit my daily loss, I’ll just monitor and study this setup to avoid today’s loss.

GBPUSD Analysis 4/14 at 7:11pm I've been closely watching GBP/USD, and as of now, the pair is trading at 1.31771. Based on my technical analysis and upcoming market events, I believe the best trade setup is a short position, but only after confirming a rejection near 1.316–1.317.
Why This Short Trade Makes Sense
Overbought Conditions
The daily RSI is at 76.08, meaning the pair is in overbought territory. This increases the likelihood of a pullback rather than a continued rally.
Other momentum indicators (like Stochastic RSI) show that buying pressure is weakening, further supporting the case for a reversal.
Key Resistance at 1.320
Price has tested 1.320 multiple times but failed to break above it, reinforcing this area as strong resistance.
The recent high at 1.31998 showed rejection, indicating that bullish momentum is struggling.
Upcoming Fundamental Events
The UK retail sales data exceeded expectations, providing some short-term support for GBP.
However, upcoming major US economic releases—including Empire State Manufacturing and Retail Sales—could shift sentiment.
With Fed Chair Powell speaking on April 16, volatility is expected, and I prefer to wait for these catalysts before fully committing to a position.
My Trade Plan
Entry: I’ll wait to sell GBP/USD after confirming rejection at 1.316–1.317.
Final Thoughts
I’m waiting for clear price rejection before entering. If GBP/USD struggles to break higher and starts reversing at 1.316–1.317, that’s my signal to short. At the same time, I’ll watch how the upcoming economic events influence market sentiment—especially the US retail sales data and Powell’s speech.
This approach ensures I’m trading based on confirmation rather than speculation, reducing the risk of entering prematurely.

Last Week’s FX Recap: April 7–11 (Zone Reactions & Trade Notes)📈 Weekly Forex Recap – Market Reactions & Lessons (Apr 7–11)
Last week there were about +320 pips of reaction potential (excluding Gold, which I was completely off on). There were multiple opportunities to capture solid intraday or swing setups.
3 out of 6 weekly targets were hit.
5 out of 6 trend biases were either accurate or neutral —meaning no major misreads, aside from one or two volatile zones. The only pair that really got me was Gold.
Let’s run it back real quick:
✅ AUDJPY
Bearish bias accurate.
30 pip reaction off zone with just 1 pip drawdown.
Weekly target hit.
✅ NZDJPY
Bearish bias accurate.
Weekly target hit, though price never reached the watch zone.
No setup triggered, but direction was respected.
⚠️ EURUSD
Range-bound bias played out majority of the week.
Gave about 90–100 pip drop from the hot zone mentioned.
Weekly target came close but didn’t hit.
⚠️ GOLD
Watch zone completely failed.
Short-term bounce gave 480 pip reaction—but that volatility was tough to catch cleanly.
Directional bias wasn’t helpful here. Gold was chaos.
✅ EURGBP
Cleanest setup of the week.
Bias was bullish, price tapped the buy zone and ran 100 pips.
Weekly target hit. Textbook move.
⚠️ GBPUSD
Consolidation-heavy.
Watch zone gave 100 pip reaction, but weekly target didn’t hit.
Bias was unclear—no real conviction either way.
📉 Total Zone Reaction Potential: 320 pips
🎯 Weekly Targets Hit: 3/6
📊 Trend Accuracy: 50% (3 clear hits, 2 neutral, 1 miss)
But that’s done now.
Whether you hit it last week or fumbled the ball, let it go.
We trade forward. Eyes up. Mind clear.
Time to dive into the new week.
Let’s get it. 👊

GBPUSD: Continue to riseFor GBP/USD, we still mainly choose to go long during the pullback and go short as a supplement.
GBPUSD trading strategy
buy @:1.31900-1.32100
sl 1.31000
tp 1.32750-1.32850
Today, the trend of GBPUSD basically coincides with what I predicted yesterday. You can click on my personal profile to view the previously published content.

GBP/USD Breaking Key Fib Level, Bulls Eye September HighsThe British pound surged through the 78.6% Fib retracement near 1.3149, extending its post-breakout rally with a +0.77% daily gain. Price is now on track to test the September swing high at 1.3440 — the next major resistance zone.
📈 Price has reclaimed both the 50- and 200-day SMAs
📊 MACD is showing bullish momentum above the zero line
📍 RSI sits at 64.98 — bullish, but nearing overbought territory
As long as GBP/USD holds above 1.3149, the path of least resistance remains higher. A clean break above 1.3440 would confirm a major trend reversal and open the door to a broader bullish cycle.
-MW

GBPUSD Analysis 4/14/2025 1:35pmI've been closely watching GBP/USD, and as of now (with the pair trading around 1.31808), I see it moving within a tight consolidation range—roughly between 1.307 and 1.320. Given that I'm near the upper end of this range, I feel that jumping in right away could expose me to potential reversals or whipsaw moves.
My plan is to take a short position, but only after the market pulls back to around 1.316. I view that level as a more attractive entry point since it’s toward the lower side of the current consolidation. This strategy offers me a better risk/reward setup; I can tighten my stops (placing a stop loss above recent highs around 1.320) while aiming for a move down toward the support area, which I expect could be around 1.304–1.305 if the sell-off continues.
In addition, there are several high-impact economic events coming up for both the UK and US—ranging from GBP retail sales and employment data to key US manufacturing, retail sales, and even a speech from Fed Chair Powell. With all that volatility on the horizon, I prefer to wait and see how the news plays out. This way, I can avoid being caught in erratic moves and let market sentiment become clearer before I commit to my trade.
To sum it up: I'm planning to short GBP/USD by waiting for a pullback to about 1.316, with a stop set just above 1.320, and a target closer to the lower support around 1.304–1.305. This approach takes into account the current consolidation, technical signals (like overbought conditions), and the upcoming fundamental catalysts that could swing the market.

NZD/USD Approaches 0.5900 – Critical Test for Bulls Ahe🧭 Overview:
The NZD/USD pair showed notable bullish strength on Monday, April 14, 2025, opening at 0.5830, hitting a high of 0.5900, and closing near 0.5885. This upward movement marks a potential shift in sentiment after a prolonged period of consolidation, driven by a weaker U.S. dollar and increased risk appetite among investors.
📈 Current Market Structure:
The pair broke above the consolidation range and is now trading near a key resistance zone around the 200-day moving average. The recent bullish candle indicates strong buyer momentum, suggesting that a medium-term trend reversal may be underway.
🔹 Key Resistance Levels:
0.5900: Psychological level and the 200-day SMA. A daily close above this may confirm a shift in long-term trend.
0.5955: A former swing high, acting as the next resistance for bulls.
0.6000 – 0.6040: Major resistance zone. A breakout here could confirm full bullish reversal and open room for extended gains.
🔸 Key Support Levels:
0.5823: Recent swing low and intraday support. Holding above this level maintains short-term bullish bias.
0.5760: Intermediate support. A break below this could expose the pair to deeper corrections.
0.5700: Major support level, aligning with previous structure lows from February 2024.
Source: DailyFX, Investing.com
📐 Price Action Patterns:
Recent bullish candles have broken key resistance within a sideways range, indicating increased demand for the kiwi dollar. The breakout above 0.5850 confirms momentum, while the lack of overbought signals on RSI and MACD crossover further support the continuation of the move. However, price faces a major test at the 0.5900 area.
🔮 Potential Scenarios:
✅ Bullish Scenario:
If NZD/USD maintains above 0.5823 and successfully breaks above 0.5900, the pair could extend gains toward 0.5955 and 0.6000. This scenario may be supported by weaker U.S. dollar sentiment and stabilization in global risk sentiment.
❌ Bearish Scenario:
If the pair fails to hold above 0.5823, it may decline toward 0.5760. A break below this level opens the door to test 0.5700, which would invalidate the current bullish breakout structure.
📌 Conclusion:
NZD/USD is showing signs of bullish recovery, supported by a breakout above consolidation and increased technical momentum. The area around 0.5900 will be critical — a successful close above it could mark the beginning of a new bullish phase. Traders should watch price action closely near this resistance zone and adjust strategies accordingly.
🗓️ Note: This analysis is based on market data available as of April 14, 2025. Always follow up with the latest price action and news events before making trading decisions.

GBPUSD: Short Trade with Entry/SL/TP
GBPUSD
- Classic bearish formation
- Our team expects pullback
SUGGESTED TRADE:
Swing Trade
Short GBPUSD
Entry - 1.3177
Sl - 1.3245
Tp - 1.3033
Our Risk - 1%
Start protection of your profits from lower levels
Disclosure: I am part of Trade Nation's Influencer program and receive a monthly fee for using their TradingView charts in my analysis.
❤️ Please, support our work with like & comment! ❤️

LEAP: GBPUSD Week 16 Swing Zone/LevelsSwing zone and levels are calculated and set.
As always price action determines trades.

GBPJPY:SIGNALHello dears
Considering the heavy decline we had, you can see that buyers entered with a strong bullish spike, which is a good sign...
Now we can buy in steps on the price pullback and move with it to the specified targets, of course with capital and risk management.
*Trade safely with us*

GBPUSD Analysis Update 4/14 10:18am, pending confirmationI've been closely analyzing GBP/USD this week, and here's my updated view based on all the technical indicators and fundamental data.
Price Action & Key Levels
Right now, GBP/USD is trading at 1.31537, after rejecting 1.320 resistance earlier in the session. The market made a strong attempt to break above 1.320, but sellers stepped in, causing a pullback. Given this rejection, I'm watching 1.317 closely—if price fails to reclaim that level, a bearish continuation toward 1.312–1.310 becomes increasingly likely.
Technical Indicators & Market Signals
Momentum & Trend Strength
RSI: Short-term signals suggest price is consolidating (RSI at 48.78), while the daily RSI (76.08) indicates overbought conditions, meaning a larger pullback may be ahead.
Aroon Oscillator: Weakening bullish strength, suggesting trend exhaustion.
ADX: At 10.1 (1-hour), showing weak trend momentum, meaning price might stay range-bound or reverse lower.
MACD: Mixed signals—some divergence appears, showing signs of a potential downward move.
Fibonacci Retracement Levels (From 1.320 High)
23.6% retracement: 1.3172 → Minor resistance zone.
38.2% retracement: 1.3158 → Current price zone.
50% retracement: 1.3143 → Potential short-term support.
61.8% retracement: 1.3129 → Stronger support level.
78.6% retracement: 1.3110 → Critical breakdown point.
If GBP/USD fails to reclaim 1.317, I anticipate further downside toward 1.312–1.311, where stronger support exists.
Bollinger Bands Confirmation
Upper Band (~1.320): Acted as resistance—price rejected this zone, confirming sellers stepped in.
Middle Band (~1.315–1.316): Price hovering here—neutral consolidation phase.
Lower Band (~1.312–1.313): If price breaks below 1.314, downward momentum is likely toward this level.
Fundamental Factors Supporting Bearish Bias
GBP Weakness: Expected softer BRC Retail Sales, Employment Change, and Inflation Rate data, which could weigh on GBP/USD.
USD Strength: Strong Retail Sales figures and upcoming Fed Chair Powell’s speech might bolster the Dollar, adding further downside pressure to GBP/USD.
Trade Setup & Execution Strategy
Bearish Case:
If GBP/USD fails at 1.317, I’ll look to enter short below 1.3155, targeting 1.312 or lower.
Bullish Case:
If GBP/USD reclaims 1.317, buyers could push price back toward 1.320 resistance.
Conclusion
At the moment, GBP/USD is at a decision point—while short-term indicators suggest some consolidation, rejection at 1.320 confirms bearish pressure. If sellers hold control, I expect price to move toward 1.312–1.311 in the coming sessions, making a short setup favorable. However, if price reclaims 1.317, buyers may attempt another test of 1.320 resistance.

XAU/USD: A Huge Fall Ahead? (READ THE CAPTION)By re-examining the gold chart on the 30-minute timeframe, we can see that the price once again moved exactly as expected and finally managed to rise back above $3100, reaching as high as $3136.5! Currently, gold is trading around $3120, and I expect we will soon see further decline in gold. The potential downside targets are $3115, $3105, and $3100 respectively. This analysis will be updated again!
The Last Analysis :

GBP/USD At Interesting Area To Sell , Should We Sell Now ?Here is my Opinion About GBP/USD , I Have an old res and the price respect it 100% and gave us a very good bearish P.A , So i think we have 2 places to sell it , first one if the price back to retest my res level 1.31750 and if the price give us a good bearish price action we can enter and targeting 200 pips . if the price didn`t back to retest the res level we can wait he price to close below support with 4h candle and then we can enter a sell trade with the same target .

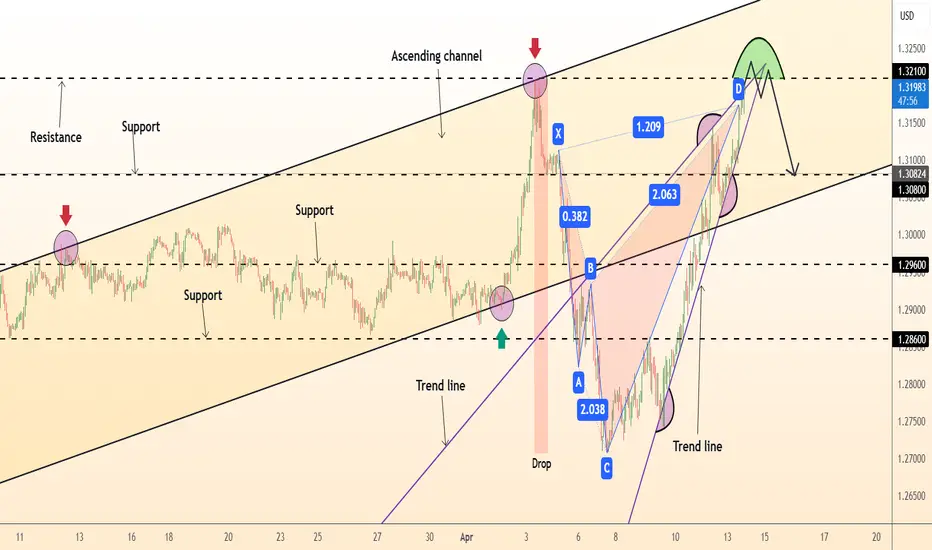
DeGRAM | GBPUSD retest of resistanceGBPUSD is in an ascending channel between the trend lines.
The price has approached the resistance level, which has already acted as a pullback point.
The chart formed an ascending wedge and kept the harmonic pattern relevant.
On the 4H Timeframe, the indicators indicate a bearish divergence.
We expect a pullback in case of consolidation under the resistance.
-------------------
Share your opinion in the comments and support the idea with a like. Thanks for your support!
GBPUSD INTRADAY Bullish breakout supported at 1.3014GBP/USD maintains a bullish bias, with the broader trend and structure supporting upside continuation. The recent intraday move appears to be a bullish breakout toward a key prior consolidation area.
Key Support: 1.3014 – aligns with the previous consolidation zone and potential bullish inflection point.
Upside Targets:
1.3255 – initial resistance level
1.3328 and 1.3418 – medium to long-term bullish targets
If price finds support at 1.3014 and forms a bullish reversal, it would confirm the continuation of the uptrend toward the mentioned resistance levels.
However, a break and daily close below 1.3014 would invalidate the bullish scenario, suggesting deeper retracement toward 1.2980, with further support at 1.2900 and 1.2815.
Conclusion
GBP/USD remains bullish above 1.3014. Look for a bounce from this level to confirm upside continuation. A daily close below 1.3014 would turn the outlook bearish, exposing lower support levels.
This communication is for informational purposes only and should not be viewed as any form of recommendation as to a particular course of action or as investment advice. It is not intended as an offer or solicitation for the purchase or sale of any financial instrument or as an official confirmation of any transaction. Opinions, estimates and assumptions expressed herein are made as of the date of this communication and are subject to change without notice. This communication has been prepared based upon information, including market prices, data and other information, believed to be reliable; however, Trade Nation does not warrant its completeness or accuracy. All market prices and market data contained in or attached to this communication are indicative and subject to change without notice.

GBPUSD and EURUSD Analysis todayHello traders, this is a complete multiple timeframe analysis of this pair. We see could find significant trading opportunities as per analysis upon price action confirmation we may take this trade. Smash the like button if you find value in this analysis and drop a comment if you have any questions or let me know which pair to cover in my next analysis.

GBPUSD - its breakout? what's next??#GBPUSD.. as you know guys our area was 1.3035 and in first go market boke that area but then drop towards bottom due to tariff implantation.
now market again break our area in today so if that is clear breakout then we can expect a further bounce towards 3400 and 1.3500
good luck
trade wisely

GBPUSD today should buy or sell?GBP/USD continues to build on its bullish momentum, reclaiming the 1.3100 level on Monday morning. The ongoing weakness of the U.S. dollar suggests that the path of least resistance for this pair remains to the upside.
The key monthly employment report is set to be released on Tuesday, followed by the latest consumer inflation data on Wednesday. In addition, investors this week will also face the release of U.S. monthly Retail Sales figures and pay close attention to a speech by Federal Reserve Chairman Jerome Powell — a speech that could play a crucial role in shaping the USD’s price dynamics. These events are expected to provide meaningful catalysts for the GBP/USD pair in the latter part of the week.
