IMP update for all Forex Traders Expect the Dollar Index (DXY) to appreciate in the near future. However, a further decline into the green highlighted region is possible before this upward movement. The green zone represents a potential key reversal area. Monitor the following currency pairs for trading opportunities if the DXY begins to climb:
BUY - USDCAD, USDCHF, USDSGD;
SELL - EURUSD, GBPUSD
GBPUSD

GBPUSDIn our price range, we enter a long position if there is an entry trigger. We should also check the news time.

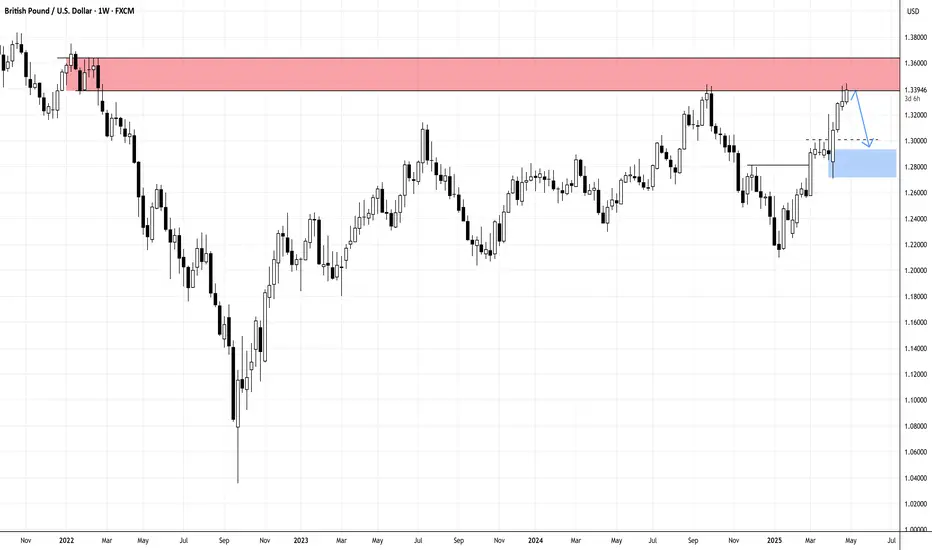
Double top mate! (GBP/USD)OK, it's not really a double top (although lots of people refer to these situations as such)
It's a re-test of the long term high and could see the current uptrend get rejected.
Can look to the daily chart for confirmation of the breakdown
Thoughts?

GBPUSD Will Grow! Buy!
Please, check our technical outlook for GBPUSD.
Time Frame: 3h
Current Trend: Bullish
Sentiment: Oversold (based on 7-period RSI)
Forecast: Bullish
The price is testing a key support 1.336.
Current market trend & oversold RSI makes me think that buyers will push the price. I will anticipate a bullish movement at least to 1.342 level.
P.S
Overbought describes a period of time where there has been a significant and consistent upward move in price over a period of time without much pullback.
Disclosure: I am part of Trade Nation's Influencer program and receive a monthly fee for using their TradingView charts in my analysis.
Like and subscribe and comment my ideas if you enjoy them!

GBPUSD long to yesterday's London session HighI'm taking a long with a target set at yesterday's London high.
My confluences are
Uptrend in the higher timeframes
Liquidity pool at a 50% fib level
Wick rejections at lower timeframes
Since today has been quite bearish so far this is a riskier trade. The reversal has not established itself yet completely.

GBPUSD(20250430)Today's AnalysisMarket news:
The European Central Bank expects prices to rise 2.9% over the next 12 months, up from 2.6% in February, according to a monthly survey released on Tuesday. This is the highest level since April 2024. The three-year indicator rose slightly to 2.5%. The ECB's first five-year forecast was 2.1%.
Technical analysis:
Today's buying and selling boundaries:
1.3409
Support and resistance levels:
1.3471
1.3448
1.3433
1.3385
1.3370
1.3347
Trading strategy:
If the price breaks through 1.3409, consider buying, the first target price is 1.3433
If the price breaks through 1.3385, consider selling, the first target price is 1.3370

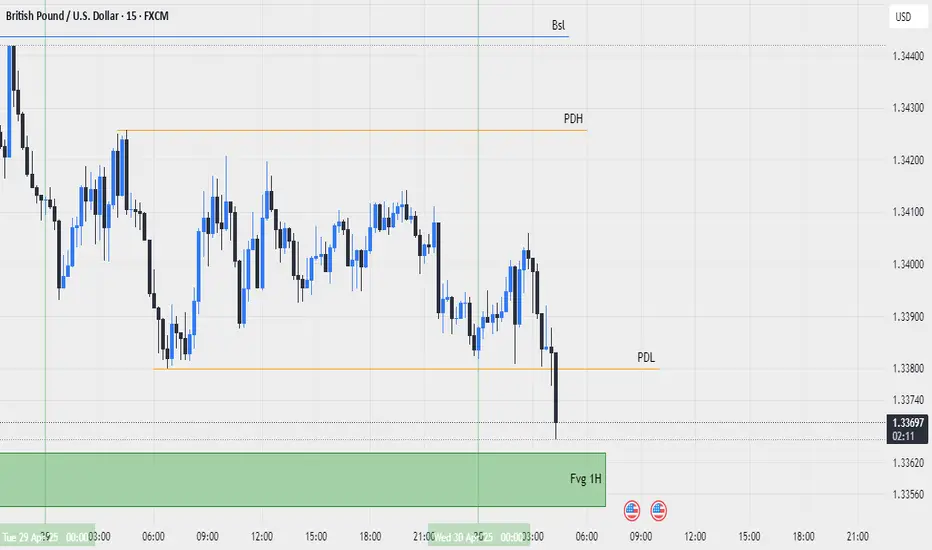
gbpusd 2025-4-30today price is below od pdl so we expect price go up
on bottom of this price we have fvg 1hour ,if price reach to this level we must wait to see up setup and trade on it
GBPUSD long to yesterday's highGBPUSD is showing bullish sentiment and rejection from one of the liquidity pools resting under yesterday's low. I took a long position targeting yesterday's high but it could go higher than that with the news.

Fundamental Market Analysis for April 30, 2025 GBPUSDThe GBP/USD pair continues to fall for the second consecutive session, hovering near 1.3390 during Asian trading on Wednesday. The pair has been under pressure as the US dollar has strengthened amid renewed optimism over trade developments between the US and China. Traders are now turning their attention to the upcoming release of the March Personal Consumption Expenditure (PCE) price index, which is a key inflation gauge for the Federal Reserve.
The U.S. Dollar Index (DXY), which measures the dollar's exchange rate against six major currencies, remains above 99.00, suggesting U.S. Treasury yields are rising. The 2-year and 10-year US bond yields broke a four-day losing streak and were trading around 3.66 per cent and 4.17 per cent respectively at the time of writing.
On the data front, the JOLTS US job openings report released on Tuesday showed a decline in the number of open positions to 7.19 million in March - the lowest level since September 2024 - indicating a cooling in labour demand. The figure fell short of expectations and emphasised growing economic uncertainty.
Adding to GBP/USD's decline are rising expectations that the Bank of England (BoE) will cut rates at its May meeting. Lower inflation expectations in the United Kingdom (UK) and increasing global economic factors favour a rate hike.
Bank of England Governor Megan Green recently stated that tariffs proposed by US President Donald Trump could lead to lower inflation in the UK, although significant uncertainties remain over the broader economic impact and recent tax hikes for employers.
Trading recommendation: SELL 1.3390, SL 1.3420, TP 1.3300

Short term long play in GBPUSDGBPUSD is at a 50% fib level and is showing wicks to the downside. There isn't much liquidity in the market today but looks like there might be a short term long opportunity.
I'd use half risk since we are technically in a downtrend retracement currently.

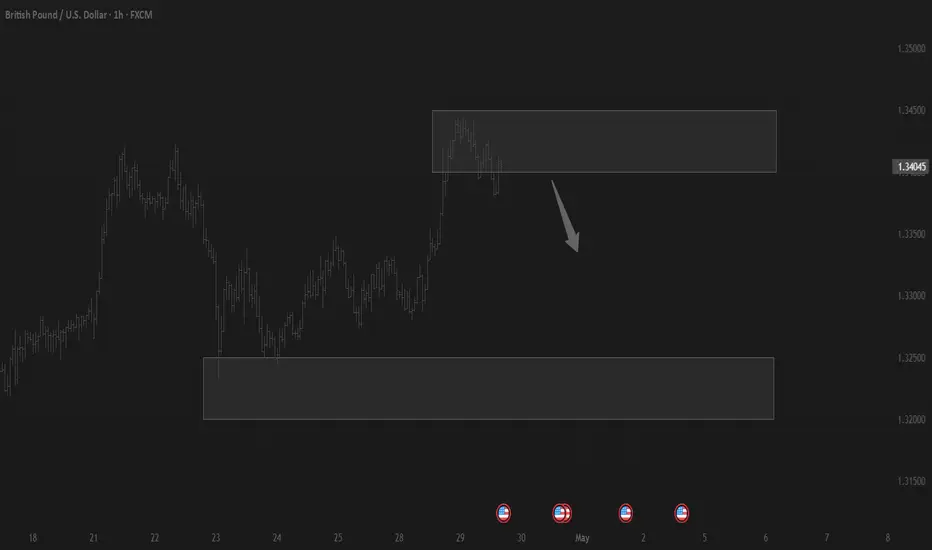
GBPUSD SHORT FORECAST Q2 W18 D30 Y25GBPUSD SHORT FORECAST Q2 W18 D30 Y25
Professional Risk Managers👋
Welcome back to another FRGNT chart update📈
Diving into some Forex setups using predominantly higher time frame order blocks alongside confirmation breaks of structure.
Let’s see what price action is telling us today!
💡Here are some trade confluences📝
✅Weekly order block rejection
✅Daily order block rejection
✅Daily high rejection
✅Daily imbalance fill targets
🔑 Remember, to participate in trading comes always with a degree of risk, therefore as professional risk managers it remains vital that we stick to our risk management plan as well as our trading strategies.
📈The rest, we leave to the balance of probabilities.
💡Fail to plan. Plan to fail.
🏆It has always been that simple.
❤️Good luck with your trading journey, I shall see you at the very top.
🎯Trade consistent, FRGNT X

GBPUSD H1 I Bullish Bounce Off the 61.8%Based on the H1 chart analysis, the price is falling toward our buy entry level at 1.3339, a pullback support that aligns with the 61.8% Fibonacci retracement.
Our take profit is set at 1.3411, an overlap resistance.
The stop loss is placed at 1.3285, an overlap support.
High Risk Investment Warning
Trading Forex/CFDs on margin carries a high level of risk and may not be suitable for all investors. Leverage can work against you.
Stratos Markets Limited (tradu.com):
CFDs are complex instruments and come with a high risk of losing money rapidly due to leverage. 63% of retail investor accounts lose money when trading CFDs with this provider. You should consider whether you understand how CFDs work and whether you can afford to take the high risk of losing your money.
Stratos Europe Ltd (tradu.com):
CFDs are complex instruments and come with a high risk of losing money rapidly due to leverage. 63% of retail investor accounts lose money when trading CFDs with this provider. You should consider whether you understand how CFDs work and whether you can afford to take the high risk of losing your money.
Stratos Global LLC (tradu.com):
Losses can exceed deposits.
Please be advised that the information presented on TradingView is provided to Tradu (‘Company’, ‘we’) by a third-party provider (‘TFA Global Pte Ltd’). Please be reminded that you are solely responsible for the trading decisions on your account. There is a very high degree of risk involved in trading. Any information and/or content is intended entirely for research, educational and informational purposes only and does not constitute investment or consultation advice or investment strategy. The information is not tailored to the investment needs of any specific person and therefore does not involve a consideration of any of the investment objectives, financial situation or needs of any viewer that may receive it. Kindly also note that past performance is not a reliable indicator of future results. Actual results may differ materially from those anticipated in forward-looking or past performance statements. We assume no liability as to the accuracy or completeness of any of the information and/or content provided herein and the Company cannot be held responsible for any omission, mistake nor for any loss or damage including without limitation to any loss of profit which may arise from reliance on any information supplied by TFA Global Pte Ltd.
The speaker(s) is neither an employee, agent nor representative of Tradu and is therefore acting independently. The opinions given are their own, constitute general market commentary, and do not constitute the opinion or advice of Tradu or any form of personal or investment advice. Tradu neither endorses nor guarantees offerings of third-party speakers, nor is Tradu responsible for the content, veracity or opinions of third-party speakers, presenters or participants.

GBPUSD SELL/SHORTBy utilizing levels, historical patterns, , we can formulate a hypothesis that the market might follow a similar trajectory if bearish sentiment prevails.

Bullish bounce?The Cable (GBP/USD) is falling towards the pivot and could bounce to the 1st resistance.
Pivot: 1.3338
1st Support: 1.3276
1st Resistance: 1.3442
Risk Warning:
Trading Forex and CFDs carries a high level of risk to your capital and you should only trade with money you can afford to lose. Trading Forex and CFDs may not be suitable for all investors, so please ensure that you fully understand the risks involved and seek independent advice if necessary.
Disclaimer:
The above opinions given constitute general market commentary, and do not constitute the opinion or advice of IC Markets or any form of personal or investment advice.
Any opinions, news, research, analyses, prices, other information, or links to third-party sites contained on this website are provided on an "as-is" basis, are intended only to be informative, is not an advice nor a recommendation, nor research, or a record of our trading prices, or an offer of, or solicitation for a transaction in any financial instrument and thus should not be treated as such. The information provided does not involve any specific investment objectives, financial situation and needs of any specific person who may receive it. Please be aware, that past performance is not a reliable indicator of future performance and/or results. Past Performance or Forward-looking scenarios based upon the reasonable beliefs of the third-party provider are not a guarantee of future performance. Actual results may differ materially from those anticipated in forward-looking or past performance statements. IC Markets makes no representation or warranty and assumes no liability as to the accuracy or completeness of the information provided, nor any loss arising from any investment based on a recommendation, forecast or any information supplied by any third-party.

Gold Spot (XAU/USD) Bullish Setup: Buy Zone to Target Levels Gold Spot (XAU/USD) on the 1-hour timeframe. Key points:
Support Zone: Strong support is identified in the yellow zone around 3,290–3,293, where price has bounced multiple times.
Buy Zone: Market is currently in a potential buy zone just above support, signaling a possible long entry.
Targets:
1st target: Around 3,368
2nd target: Around 3,419
All-Time High: Marked as a potential long-term resistance above 3,500.
Outlook: If price respects the support and buy zone, the market may rally toward the 1st and 2nd targets. Watch for bullish confirmation before entering.

SHORT ON GBP/USDGBP/USD Has bearish divergence on the 4hr timeframe.
This is a bearish reversal indication. Price is also over brought on GU.
The Dollar (dxy) Looks like it will start to rise from its demand area.
I will be selling GU looking to catch over 300-400 pips to the previous swing low /demand zone.

GBP/USD Opening Trends and Trading Strategies Next WeekTrend Analysis
Examining the 4 - hour chart of GBP/USD, the pair is distinctly navigating an upward trend. A series of successive higher highs and higher lows have been established, serving as a robust testament to the dominant strength of the bulls 🐂. This upward momentum indicates that the bulls are firmly in the driver's seat, consistently pushing the price higher and maintaining control over the market sentiment.
Key Levels
Support Area
The 1.3200 - 1.3240 range emerges as a crucial support zone on the chart. Historical price action reveals multiple instances where the price has found strong support in this area, bouncing back with resilience each time it approached. This repeated pattern underscores the presence of substantial buying pressure, as market participants actively step in to defend this price level. Should the price retrace towards this support zone again, it could potentially present a lucrative opportunity for traders to initiate long positions 💰.
Target Area
The 1.3420 mark has been identified as a significant target level. In the event that the price successfully breaks free from its current consolidation phase and continues its upward trajectory, there is a strong expectation that it will advance towards this target price. This level represents a potential milestone for the bullish rally, and reaching it would further validate the strength of the upward trend 🎯.
Trading Strategy
Long - position Strategy
For traders looking to capitalize on the bullish trend, a well - timed entry point could present itself when the price retraces to the 1.3200 - 1.3240 support area. Once there, the appearance of a bullish candlestick pattern, such as a hammer or an engulfing pattern, can serve as a signal to consider entering a long position. To manage risk effectively, it is advisable to set the stop - loss just below the support area, protecting against any unexpected downward movements. With the 1.3420 target area in sight, traders can aim for a profitable trade as the price moves in the anticipated upward direction 📈.
⚡⚡⚡ GBPUSD ⚡⚡⚡
🚀 Buy@1.32000 - 1.32400
🚀 TP 1.33500 - 1.34000
Accurate signals are updated every day 📈 If you encounter any problems during trading, these signals can serve as your reliable guide 🧭 Feel free to refer to them! I sincerely hope they'll be of great help to you 🌟

EUR/USD: Possible Fall Ahead? Let's See! (READ THE CAPTION)Upon reviewing the EUR/USD chart on the 3-day timeframe, we can see that following a sharp decline in the Dollar Index (DXY), the pair experienced a bullish move, reaching the 1.15 supply zone. If the price manages to stabilize and close below the 1.15–1.17 area, we can anticipate a further drop in EUR/USD to fill the created Liquidity Void (LV). This analysis will be updated accordingly.
Please support me with your likes and comments to motivate me to share more analysis with you and share your opinion about the possible trend of this chart with me !
Best Regards , Arman Shaban

CABLE May Likely Struggle to Rally Above ResistanceGBPUSD previously been rejected and likely to be rejected again to drag pair to its mean before another impulsive movt above the resistance...
N.B!
- GBPUSD price might not follow the drawn lines . Actual price movements may likely differ from the forecast.
- Let emotions and sentiments work for you
- ALWAYS Use Proper Risk Management In Your Trades
#gbpusd
Trading balanceTrading balance The price of the asset has rebounded from the balance zone. With the prospect of growth into the resistance zone.
GBPUSD Sell and Buy Trading PlanH4 - We have a clean bullish trend with the price creating a series of higher highs, higher lows structure
This strong bullish move ended with a bearish divergence
While measuring this strong bullish move using the Fibonacci retracement tool we have two key support zones that has formed (marked in green)
So based on this I expect short term bearish moves now towards the Fibonacci support zones and then continuation higher.
If you enjoy this idea, don’t forget to LIKE 👍, FOLLOW ✅, SHARE 🙌, and COMMENT ✍! Drop your thoughts and charts below to keep the discussion going. Your support helps keep this content free and reach more people! 🚀
--------------------------------------------------------------------------------------------------------------------
Disclosure: I am part of Trade Nation's Influencer program and receive a monthly fee for using their TradingView charts in my analysis.

GBPUSD SHORT TRADE?GBPUSD Grab liquidity from buyside and close below range this shows the power of bears in the market and also dxy show strength so go short with sl above high

CADCHF BULLISH OR BEARISH DETAILED ANALYSISCADCHF is currently trading around 0.59 and is showing a strong bullish wave setup on the 8H chart. Price has bounced cleanly from a key demand zone, with a visible bullish engulfing structure, suggesting buyers are stepping in aggressively. My target for this setup is 0.61, aligning with a previous major resistance level seen on the chart.
Fundamentally, CAD is supported by firm oil prices and hawkish sentiment from the Bank of Canada, while CHF has been under mild pressure due to reduced demand for safe-haven assets amid improving global sentiment. This macro backdrop favors CAD strength in the near term, adding fuel to the bullish technicals.
If the current momentum sustains, we could see a smooth continuation toward 0.61, with a favorable risk-reward ratio. As always, trade management and patience are key, especially as the pair approaches resistance. I remain bullish on CADCHF in the short term, based on both structure and fundamentals.
