"GBP/USD Wave 5 Completion | ABC Correction in ProgressFive-wave impulsive structure is complete.
Price rejected strongly in the red supply zone.
Correction phase (ABC) now unfolding.
Key Levels:
Wave A Support Zone: 1.3285
Wave C Target Zone: 1.2880
Expect a corrective pullback before potential bullish continuation.
Stay patient — corrections offer new opportunities!
#GBPUSD #ElliottWave #ForexAnalysis #TechnicalAnalysis
GBPUSD

GBPUSDGBPUSD needs some more messy structure before going to 1.35 level.
Disclosure: We are part of Trade Nation's Influencer program and receive a monthly fee for using their TradingView charts in our analysis.

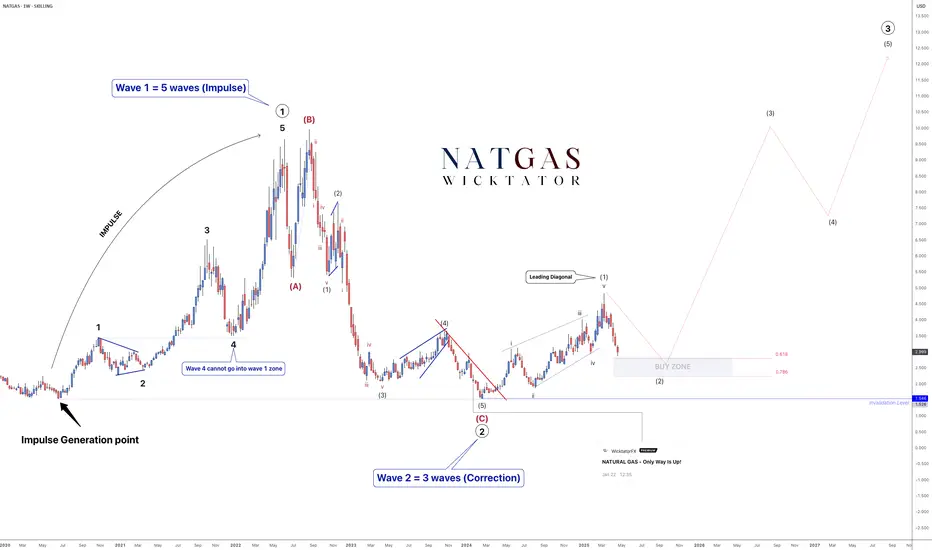
NATGAS Elliott Waves – Preparing for a Multi-Year Rally!Following our last post on Natural Gas, we have now seen a breakout, suggesting the start of a larger bullish wave — a move that could last multiple years.
From a technical perspective:
- Wave 1 (5-wave impulse) is complete.
- Wave 2 (ABC correction) is also complete.
- We are now in Wave 3, which itself will form 5 subwaves.
Wave 3:
Subwave 1 of Wave 3 has formed as a leading diagonal.
We are now in Subwave 2, which typically retraces around 61.8% of Subwave 1.
Our buy zone is positioned around this retracement area, and we will be looking for a lower timeframe breakout to confirm entries.
Important note:
Subwave 2 could form a more complex ABC correction, so patience is required while it develops.
Trade Plan:
- Wait for price to reach the buy zone.
- Look for lower timeframe bullish confirmation (trendline break, BOS, structure shift, etc.).
- Enter after confirmation.
Stoploss Placement:
- Aggressive option: Below the corrective low.
- Conservative option: Below the broader invalidation level.
Targets: 8, 10, 12
See below for our last NatGas analysis:
GBPUSD SHORT FORECAST Q2 W18 D28 Y25GBPUSD SHORT FORECAST Q2 W18 D28 Y25
Professional Risk Managers👋
Welcome back to another FRGNT chart update📈
Diving into some Forex setups using predominantly higher time frame order blocks alongside confirmation breaks of structure.
Let’s see what price action is telling us today!
💡Here are some trade confluences📝
✅Weekly order block rejection
✅Daily order block rejection
✅Weekly imbalance to fill short
✅15’ order block
🔑 Remember, to participate in trading comes always with a degree of risk, therefore as professional risk managers it remains vital that we stick to our risk management plan as well as our trading strategies.
📈The rest, we leave to the balance of probabilities.
💡Fail to plan. Plan to fail.
🏆It has always been that simple.
❤️Good luck with your trading journey, I shall see you at the very top.
🎯Trade consistent, FRGNT X

Forex Grid Trading Overview: Practical Guide for 2025Forex Grid Trading Strategy: Detailed Overview & Low-Risk EUR/USD Application
1️⃣ What Is Grid Trading?
A grid trading strategy places a series of **buy** and **sell** orders at fixed intervals (“grid levels”) above and below a base price, without forecasting market direction. As price oscillates, it triggers orders across the grid, locking in small profits on each swing.
- **No Directional Bias** – Profits on both up- and down-moves
- **Automated Entry/Exit** – Ideal for Expert Advisors (EAs) on MT4/MT5
- **Scalable** – Grid size and lot sizing can be tailored to account size and volatility
2️⃣ How It Works – Core Components
1. **Grid Levels**
- Define a **base price** (e.g. current EUR/USD mid)
- Set **intervals** (e.g. every 20 pips) above/below the base
2. **Orders**
- **Buy Limit** orders at 20, 40, 60 pips below base
- **Sell Limit** orders at 20, 40, 60 pips above base
3. **Take Profit (TP) for Each Order**
- TP typically equals the grid interval (e.g. 20 pips) so each triggered order nets a small profit
- No hard Stop Loss per order—risk is managed via overall exposure
4. **Cumulative P&L**
- Winning trades roll profits into the floating drawdown of unfilled orders
- As price oscillates, the grid “locks in” incremental gains
3️⃣ Pros & Cons
| Pros | Cons |
|---------------------------------------|------------------------------------------|
| ✅ Profits in ranging markets | ❌ Can incur large drawdowns in strong trends |
| ✅ Automated, systematic execution | ❌ Requires significant margin for multiple open trades |
| ✅ Scalable to any time-frame | ❌ Floating negative exposure if grid one-sided |
---
✅Low-Risk Best Practices
1. **Grid Spacing & Width**
- Wider grid intervals (e.g. 30–50 pips) reduce order density and margin use
- Use **ATR** (Average True Range) to adapt spacing to EUR/USD volatility
2. **Lot Sizing & Equity Risk**
- Risk ≤ 1–2% equity per full grid cycle
- Use **fixed fractional** sizing: each order size = (Equity × 1%) / (max number of open grid orders)
3. **Drawdown Control**
- **Maximum Open Orders** cap (e.g. 5 orders per side)
- **Equity Stop-Out**: if floating drawdown exceeds e.g. 10% of equity, close all orders
4. **Trend Filters**
- Use a **200-period SMA** or **ADX** filter: only enable sell grid if price < SMA (downtrend) or ADX < 25 (low momentum)
- Disables grid in strong one-way trends
5. **Grid Shifting / Re-Base**
- After a net grid profit, **shift** the base price to current mid to reset exposure
- Prevents runaway open trades far from current price
5️⃣ Step-by-Step: Applying to EUR/USD
1. **Choose Time-Frame**
- **H4 or H1** recommended: balances signal frequency and margin needs
2. **Define Grid Parameters**
- **Base Price:** current EUR/USD mid (e.g. 1.0980)
- **Interval:** 30 pips (≈ recent ATR on H4)
- **Levels:** 3 buys at 1.0950 / 1.0920 / 1.0890; 3 sells at 1.1010 / 1.1040 / 1.1070
3. **Set Order Size**
- Account equity $10 000, risk 1% = $100 per full grid
- Max open orders 6 → each order $100/6 ≈ $16.7 → ≈ 0.02 lots
4. **Configure TP & No SL**
- Each order TP = 30 pips (equals interval)
- No per-order SL; overall drawdown managed by equity stop
5. **Implement Filters**
- Only open **sell** grid if H4 close < 200-SMA; only open **buy** grid if H4 close > 200-SMA
- Pause grid if ADX > 30 (strong trend) or market events (e.g. NFP, ECB rate decision)
6. **Deploy & Monitor**
- Run on MT4 with an EA or semi-automated Expert Advisor
- Monitor margin usage; adjust grid or disable before major news
6️⃣ Example P&L Mechanics
| Trigger Price | Order Type | Entry | TP Target | Profit (pips) |
|---------------|------------|---------|-----------|---------------|
| 1.0950 | Buy Limit | 1.0950 | 1.0980 | 30 |
| 1.0980 | Sell Limit | 1.0980 | 1.1010 | 30 |
- If price moves down to 1.0950: buy executes, TP at 1.0980 nets +30 pips
- If price then climbs above base, sells trigger at 1.1010 nets +30 pips
2️⃣ Introducing Progressive & Regressive Scaling
🔼 2.1 Progressive Scaling
“Let winners run”—increase exposure after success
Concept: After each profitable grid cycle, step up your lot size by a fixed increment.
Why: Capitalizes on momentum and winning streaks.
How to apply:
Base Lot: 0.02 lots per order (1% equity risk).
After grid closes net-positive, next cycle = 0.03 lots.
Continue stepping up (0.04, 0.05 …) until a drawdown or equity-stop is hit.
Reset back to base lot after a losing cycle or whenever floating drawdown > 5%.
Caps & Safeguards:
Max Lot Cap: Never exceed 0.10 lots (or 2% equity risk).
Equity Stop: If floating drawdown > 10%, close cycle & reset.
🔽 2.2 Regressive Scaling
“Protect the downside”—reduce exposure after losses
Concept: After a losing grid cycle, step down your lot size to conserve capital.
Why: Limits damage during rough periods and preserves margin.
How to apply:
Base Lot: 0.02 lots per order.
If grid hits equity-stop or nets negative, next cycle = 0.015 lots.
Continue stepping down (0.01, 0.005) until you record a net-positive cycle.
Reset to base lot after recovery (e.g. two consecutive winning cycles).
Thresholds:
Don’t drop below 0.005 lots (to avoid over-shrinking).
After two winning cycles at reduced lot, return to base.
✅ Bottom Line
Forex grid trading on EUR/USD can generate steady gains in choppy markets—but demands **strict risk controls** (grid spacing, lot sizing, drawdown limits) and **trend filters** to avoid large losses in trending conditions. When properly applied, a low-risk grid on EUR/USD offers a robust, mostly hands-off strategy for capturing repetitive market swings.
4️⃣ Key Takeaways
Progressive Scaling lifts lot sizes on winning streaks, amplifying gains—but must be capped and reset on losses.
Regressive Scaling shrinks exposure after drawdowns, preserving capital until the strategy recovers.
Combine both with your grid’s risk parameters, trend filter, and a solid equity-stop to maintain a balanced, low-risk EUR/USD grid.
By layering scaling rules atop your grid, you adapt dynamically to market performance—maximizing winners and protecting against prolonged losing runs. Good luck! 🚀

GBPUSD 1.50 ?👀 Market Insight – GBP/USD
After a long time, I’ve revisited the currency pairs — and GBP/USD has caught my attention!
The setup is looking strong and is preparing for a move toward the 1.50 benchmark, sooner or later. 📈
Stay tuned — opportunities are lining up!

GBPUSD - Big Move Setting Up - Elliott Wave AnalysisGBPUSD is currently unfolding a 5-wave impulsive move according to Elliott Wave Theory.
At the moment, we are in Wave 4, which typically corrects against the larger trend.
Key Points:
Wave 2 was a simple correction, so based on alternation, Wave 4 is expected to be more complex (likely an ABC structure).
Wave 4 often retraces to the 38.2% Fibonacci level — in this case, aligning perfectly with a long-term ascending trendline, providing additional confluence for a potential buy zone.
Trade Plan:
- Monitor the ABC correction for completion near the 38.2% retracement.
- Look for bullish confirmation (trendline break, bullish structure shifts, BOS, etc.).
- Entries will be considered after clear signs of bullish pressure.
- Stoploss: Below the lows formed during the Wave 4 correction.
Targets:
First Target: 1.3400 (450 pips)
Second Target: 1.3750 (800 pips)
Summary:
Patience is key during the Wave 4 correction. Once the setup confirms, this could offer a strong risk-reward opportunity within the overall bullish impulsive structure.
See our past GBPUSD setups below:
Swing 1:
Swing 2:
Swing 3:

EURUSD BULLISH OR BEARISH DETAILED ANALYSISEURUSD is currently in a critical retesting phase after a strong bullish breakout. Price action is finding solid support around the 1.1200–1.1300 zone, an area that has previously acted as major resistance. As long as this zone holds, I expect a healthy bullish bounce that could fuel a continuation toward the 1.1800 level. Market structure remains bullish, and this pullback seems more like a technical correction before the next rally.
Fundamentally, the euro is being supported by a weaker US dollar sentiment due to growing expectations of Federal Reserve rate cuts later this year. At the same time, improving Eurozone data and stabilizing inflation pressures are adding positive momentum to the EURUSD pair. If the US GDP numbers and inflation figures continue to disappoint, we could see further downside pressure on the dollar, pushing EURUSD higher.
Technically, the weekly chart shows a clean breakout from a long-term consolidation, and now the price is retesting the broken resistance as new support. The structure aligns perfectly with a bullish continuation setup. A strong bullish candle from this zone would be a major confirmation for buyers to target 1.1800 in the coming weeks.
In my view, EURUSD remains one of the strongest setups on the forex board, supported by both technical and fundamental factors. Traders should monitor key economic releases like US PCE data and Eurozone CPI, as they will drive volatility and direction. I stay bullish above the 1.1200 level and see excellent risk-reward potential in this trade idea.

GBPUSD Will Grow! Long!
Please, check our technical outlook for GBPUSD.
Time Frame: 9h
Current Trend: Bullish
Sentiment: Oversold (based on 7-period RSI)
Forecast: Bullish
The price is testing a key support 1.329.
Current market trend & oversold RSI makes me think that buyers will push the price. I will anticipate a bullish movement at least to 1.342 level.
P.S
Overbought describes a period of time where there has been a significant and consistent upward move in price over a period of time without much pullback.
Disclosure: I am part of Trade Nation's Influencer program and receive a monthly fee for using their TradingView charts in my analysis.
Like and subscribe and comment my ideas if you enjoy them!

Incoming sells?! AUDCAD bearish sentiment Good day traders, I’m back with another setup on AudCad. Before I go into the thinking behind this setup I’d like to remind you that on the higher TF’s we still very much bearish that’s is my reasoning behind the bearish sentiment.
On Tuesday we saw price close lower to give us our high of the week but price has been disrespecting the high since Wednesday but failing to close above that high showing strength lower(Friday bearish candle). Going into the new week I believe we can expect price to keep disrespecting the high because we believe that CAD is gonna be weak but keeping the overall direction in mind(bearish) we do not wanna see price closing higher than the Tuesday’s high of the day.
4H we have shifted structure lower but price is still trading in the premium area, should price not fall below the low of previous week than we can expect manipulation higher to fill the FVG on the Weekly before continuing lower.

GBPUSD Trade RecapFX:GBPUSD
Friday trade recap on GBPJPY.
📌 The rationale behind taking this trade was firstly, the positive GBP news for Retail Sales of actual 0.4%, greater than the -0.3% forecast.
📌 Secondly, the price tapped into the strong 4H demand zone, while also sweeping the Asian lows.
📌 The news took place on 6 am UTC, while there were no sudden spikes in price during 6 am, we can see a 30 pips price push few minutes after the news, signaling the market price reacting to the news.
📌 Price got rejected twice from the 15 minutes bearish shooting star, creating a strong short term resistance zone.
📌 Since the bias is short term bullish, I waited for a break and retest of the trendline, as soon as price failed to close below the zone, I immediately place buys.
📌 Price Eventually hit TP at a 1:2.46% risk to reward trade but closed at +1.9% to avoid the subsequent red news.
3min chart

GBPUSD Potential UpsidesHey Traders, in today's trading session we are monitoring GBPUSD for a buying opportunity around 1.32600 zone, GBPUSD is trading in an uptrend and currently is in a correction phase in which it is approaching the trend at 1.32600 support and resistance area.
Trade safe, Joe.

UK retail sales beat forecast, pound edges lowerThe British pound has edged lower on Friday. In the European session, GBP/USD is trading at 1.3214, down 0.17% on the day.
UK retail sales were a ray of sunshine in March. Monthly, retail sales rose 0.4%, beating the market estimate of -0.4% but below the revised 0.7% increase in February. Clothing sales showed strong growth as shoppers took advantage of the sunny weather.
Annualized, retail sales rose 2.6% from a revised 1.8% gain in February and above the market estimate of 1.8%. This was the strongest gain in three months.
The strong retail sales was a pleasant surprise but the consumer economy remains fragile. The GfK consumer confidence index deteriorated in April to -23 from -19 and below the market estimate of -22. This was the lowest level since November 2023.
Consumers are concerned over the rising cost of living and worsening global trade tensions which has been fuelled by President Trump's tariffs. The GfK survey found that consumers are anxious that inflation will continue to rise due to the US tariffs.
The Bank of England is following trade tensions carefully as well. On Thursday, Governor Andrew Bailey said that the BoE was "quite focused on the growth shock" for the UK from the tariffs, although he said the UK was not close to a recession. If the global trade war intensifies, it will weigh on UK growth but will also push inflation lower.
President Trump's tariff policy is expected to raise inflation and consumers are anxious that inflation will rise sharply. The UoM consumer inflation expectations index jumped to 6.7% in the initial April release, up from 5.0% in March. Today's final release is expected to confirm this figure, which would mark the highest level since Nov. 1981.

GBPUSD(20250425)Today's AnalysisMarket news:
Federal Reserve-①Hamack: If economic data is clear, the Fed may cut interest rates in June
②Waller: It will take until July to get a clearer understanding of how tariffs affect the economy. If tariffs lead to higher unemployment, interest rate cuts may be initiated. ③The Atlanta Fed GDPNow model predicts that the US GDP growth rate in the first quarter will be -2.5%. ④Kashkari: The frequent announcements from Washington have brought challenges to policymakers and everyone.
Technical analysis:
Today's buying and selling boundaries:
1.3311
Support and resistance levels:
1.3411
1.3374
1.3350
1.3274
1.3248
1.3211
Trading strategy:
If the price breaks through 1.3350, consider buying, the first target price is 1.3374
If the price breaks through 1.3311, consider selling, the first target price is 1.3274

GBPUSD 1H Analysis – ForexCity SignalWe’ve entered a critical zone on GBPUSD.
Price formed a Higher High (HH) and later shifted structure with a bearish CHoCH
A new Lower High (LH) was printed, confirming bearish intent
But recently, bulls stepped in to create a Higher Low (HL)
Now price is compressed between LH & HL, meaning:
❗ One side is about to get liquidated. The next move will be impulsive.
🟢 Buy Scenario (If Bulls Win)
🔔 BUY STOP @ 1.33480
TP1: 1.33680
TP2: 1.33980
TP3: 1.34480
SL: 1.33080 (max 40 pips)
Reason:
Break of LH confirms buyers are back in control. This would be a bullish CHoCH reclaim.
🔴 Sell Scenario (If Bears Continue)
🔔 SELL STOP @ 1.32800
TP1: 1.32600
TP2: 1.32300
TP3: 1.31800
SL: 1.33300 (max 50 pips)
Reason:
A break below HL confirms bearish continuation after structure shift. This is the safer Smart Money entry.
📌 Conclusion:
This is a classic SMC compression zone.
Let the market break the range—then ride with conviction.
No guessing. Just precision.
Wait. Watch. Execute.
→ Patience = Power.

XAU/USD: Bull or Bear? (READ THE CAPTION)By analyzing the gold chart on the 30-minute timeframe, we can see that yesterday, right after posting the analysis, the price quickly hit the first target at $3307, then experienced a bounce and rallied to the $3369 supply zone. From there, gold faced more downward pressure and eventually reached the targets at $3303, $3297, and nearly $3285.
Currently, gold is trading around $3291, and if $3285 is broken, we could expect further downside toward levels below $3259.
Please support me with your likes and comments to motivate me to share more analysis with you and share your opinion about the possible trend of this chart with me !
Best Regards , Arman Shaban
