VWAP and Fibo Retracement Levels in Focus for GBPUSD📊 I’m currently looking at the GBPUSD and have noted a bullish break of structure on the 1D 📈. My bias remains bullish, but price is now overextended, trading well above VWAP 📏. I’ll be watching for a retracement and a bullish break of market structure around 61.8% fibo levels 🔍💡 — this could present a potential long setup 🚀 (not financial advice).
Gbpusd1hr

Market Analysis: GBP/USD Rebounds CautiouslyMarket Analysis: GBP/USD Rebounds Cautiously
GBP/USD is attempting a recovery wave above the 1.3215 resistance.
Important Takeaways for GBP/USD Analysis Today
- The British Pound is attempting a fresh increase above 1.3265.
- There is a contracting triangle forming with resistance at 1.3375 on the hourly chart of GBP/USD.
GBP/USD Technical Analysis
On the hourly chart of GBP/USD, the pair declined after it failed to clear the 1.3600 resistance. As mentioned in the previous analysis, the British Pound even traded below the 1.3350 support against the US Dollar.
Finally, the pair tested the 1.3140 zone and is currently attempting a fresh increase. The bulls were able to push the pair above the 50-hour simple moving average and 1.3215. The pair even climbed above the 1.3265 level.
The bulls were able to push the pair above the 50% Fib retracement level of the downward move from the 1.3385 swing high to the 1.3141 low.
On the upside, the GBP/USD chart indicates that the pair is facing resistance near 1.3375. There is also a contracting triangle forming with resistance at 1.3375 and the 76.4% Fib retracement level of the downward move from the 1.3385 swing high to the 1.3141 low.
The next major resistance is near 1.3385. A close above the 1.3385 resistance zone could open the doors for a move toward 1.3450. Any more gains might send GBP/USD toward 1.3550.
On the downside, there is decent support forming at 1.3265. If there is a downside break below 1.3265, the pair could accelerate lower. The first major support is near the 1.3215 level. The next key support is seen near 1.3140, below which the pair could test 1.3050. Any more losses could lead the pair toward 1.3000.
This article represents the opinion of the Companies operating under the FXOpen brand only. It is not to be construed as an offer, solicitation, or recommendation with respect to products and services provided by the Companies operating under the FXOpen brand, nor is it to be considered financial advice.

Market Analysis: GBP/USD Dips FurtherMarket Analysis: GBP/USD Dips Further
GBP/USD started a downside correction from the 1.3620 zone.
Important Takeaways for GBP/USD Analysis Today
- The British Pound started a fresh decline and settled below the 1.3500 zone.
- There is a connecting bullish trend line forming with support at 1.3415 on the hourly chart of GBP/USD at FXOpen.
GBP/USD Technical Analysis
On the hourly chart of GBP/USD at FXOpen, the pair struggled above the 1.3600 zone. The British Pound started a fresh decline below the 1.3550 pivot level against the US Dollar, as discussed in the previous analysis.
The pair dipped below the 1.3500 and 1.3450 levels. A low was formed at 1.3364 and the pair is now consolidating losses. On the upside, it is facing resistance near the 1.3475 level. The next key resistance is near 1.3490 and the 50% Fib retracement level of the downward move from the 1.3619 swing high to the 1.3364 low.
An upside break above the 1.3490 zone could send the pair toward 1.3520 and the 61.8% Fib retracement level.
More gains might open the doors for a test of 1.3620. If there is another decline, the pair could find support near the 1.3415 level and a connecting bullish trend line. The first major support sits near the 1.3365 zone.
The next major support is 1.3350. If there is a break below 1.3350, the pair could extend the decline. The next key support is near the 1.3320 level. Any more losses might call for a test of 1.3250.
This article represents the opinion of the Companies operating under the FXOpen brand only. It is not to be construed as an offer, solicitation, or recommendation with respect to products and services provided by the Companies operating under the FXOpen brand, nor is it to be considered financial advice.

GBP/JPY Rejection from Resistance Zone GBP/JPY Rejection from Resistance Zone 🧱📌 | Bearish Setup In Play 🔻💹
📌 Technical Analysis Overview:
The chart illustrates a clear rejection from the resistance zone around 198.460, where previous price action formed a double-top pattern (🔴 red arrow). This suggests a strong supply area with selling pressure building.
🔍 Key Observations:
📏 Trendline Break:
The upward trendline (blue) has been decisively broken.
This break signals a loss of bullish momentum.
🧱 Resistance Zone @ 198.000–198.460:
Price tested this zone multiple times but failed to break above.
Acts now as a strong resistance zone.
🟠 Support Turned Resistance:
Former support has now turned into resistance (highlighted in blue text: "SUPPOT").
📉 Bearish Projection:
The projected path indicates a possible retest of the resistance zone before a sell-off continuation.
Target area: around 194.500, marked as “TAEGET FAXS” (typo: should be “TARGET ZONE”).
🔄 Possible Scenarios:
✅ Bearish Continuation:
If price rejects again near 198.000, expect a bearish move toward 194.500.
⚠️ Invalidation:
A strong breakout above 198.460 would invalidate the bearish thesis and may resume bullish momentum.
🔚 Conclusion:
The pair is currently under pressure with a confirmed break in trend structure. As long as price remains below 198.460, the bias remains bearish with a target toward the 194.500 zone. 📉👀

GBP/USD Bearish Reversal Pattern Detected GBP/USD Bearish Reversal Pattern Detected 🔻🦈
The chart illustrates a potential bearish Gartley pattern formation near the 1.3736 resistance zone, which has historically triggered price rejections (red arrows).
🔍 Key Observations:
📌 Price action completed a bearish harmonic pattern, suggesting a reversal setup.
💡 Multiple rejections at the upper resistance zone (1.3730–1.3780) highlight strong selling pressure.
📉 Break of trendline support confirms shift in structure.
🟠 Historical support zones (orange circles) now align with the projected target level: 1.3512.
🔽 A clean breakdown below 1.3650 could accelerate bearish momentum toward the target.
🎯 Target: 1.35124
🛑 Resistance: 1.3730–1.3780
✅ Support: 1.3510–1.3550 zone

GBPUSD SHORT FORECAST Q2 W18 D30 Y25GBPUSD SHORT FORECAST Q2 W18 D30 Y25
Professional Risk Managers👋
Welcome back to another FRGNT chart update📈
Diving into some Forex setups using predominantly higher time frame order blocks alongside confirmation breaks of structure.
Let’s see what price action is telling us today!
💡Here are some trade confluences📝
✅Weekly order block rejection
✅Daily order block rejection
✅Daily high rejection
✅Daily imbalance fill targets
🔑 Remember, to participate in trading comes always with a degree of risk, therefore as professional risk managers it remains vital that we stick to our risk management plan as well as our trading strategies.
📈The rest, we leave to the balance of probabilities.
💡Fail to plan. Plan to fail.
🏆It has always been that simple.
❤️Good luck with your trading journey, I shall see you at the very top.
🎯Trade consistent, FRGNT X

GBPUSD GBPUSD Analysis & Signal (1H Timeframe)
📅 Date: March 23, 2025
On the GBP/USD chart, the price has reached a key resistance zone around 1.29629 after an uptrend, showing signs of rejection. This resistance aligns with a descending trendline, adding to the selling pressure.
Currently, the price is heading toward the demand zone marked between 1.28613 and 1.28117, which could act as a strong support level.
Signal:
Sell:
📍Entry Point: 1.29114 (current price)
🔴Stop Loss: 1.29629 (above resistance)
🟢Take Profit 1: 1.28613
🟢Take Profit 2: 1.28117
⚠️Risk Management:
With the stop loss set above the resistance, the risk-to-reward ratio (R:R) for this trade is at least 1:2. It’s recommended to risk only 1-2% of your capital on this trade.
📝Note: Before entering the trade, wait for additional confirmations (e.g., reversal candlestick patterns or a break of the zone) and assess market conditions.

GBPUSD(20250327)Today's AnalysisToday's buying and selling boundaries:
1.2897
Support and resistance levels:
1.2974
1.2945
1.2927
1.2868
1.2849
1.2821
Trading strategy:
If the price breaks through 1.2897, consider buying, the first target price is 1.2927
If the price breaks through 1.2868, consider selling, the first target price is 1.2849

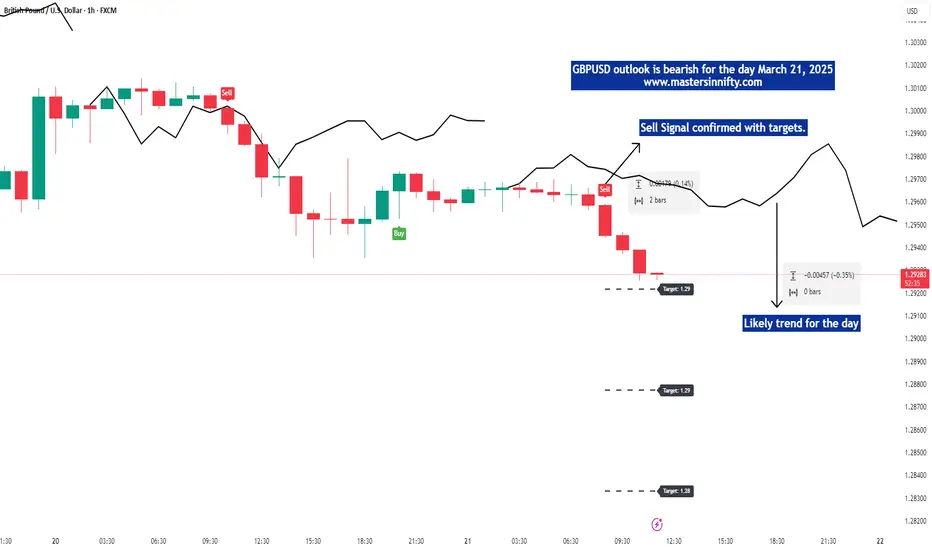
GBPUSD view for the day March 21, 2025According to my analysis the trend for GBPUSD looks bearish. Bearish targets are given for the day. Trade with Stop loss.
Short-selling strategy for GBPUSDThe one - hour chart of GBPUSD indicates that the current price is 1.29750, with the market showing potential bearish sentiment. The 1.30000 level acts as a key resistance zone, with multiple support levels below. If the price fails to break through this resistance, a decline is likely.
GBPUSD
sell@1.29600-1.30000
tp:1.28500
Traders, if this concept fits your style or you have insights, comment! I'm keen to hear.
For those who are seeking professional guidance in trading trend analysis, strategy formulation, and risk management, please click below to get the daily strategy updates.

GBPUSD BUY 📊 Technical Analysis & Entry Signal 💹
🔍 The chart shows a strong uptrend where the price has broken a key resistance level and is now pulling back to retest it. As highlighted in the analysis, it's crucial to wait for a complete pullback and confirmation before entering a trade.
📈 Entry Signal:
✅ Entry: After pullback confirmation around 1.27570
🎯 Targets:
First Target: 1.27952
Second Target: 1.28269
Third Target: 1.28645
🛑 Stop Loss: 1.27414 (Risk management is essential)
📝 Important Note: Always manage your risk and avoid entering without confirmation. 📉

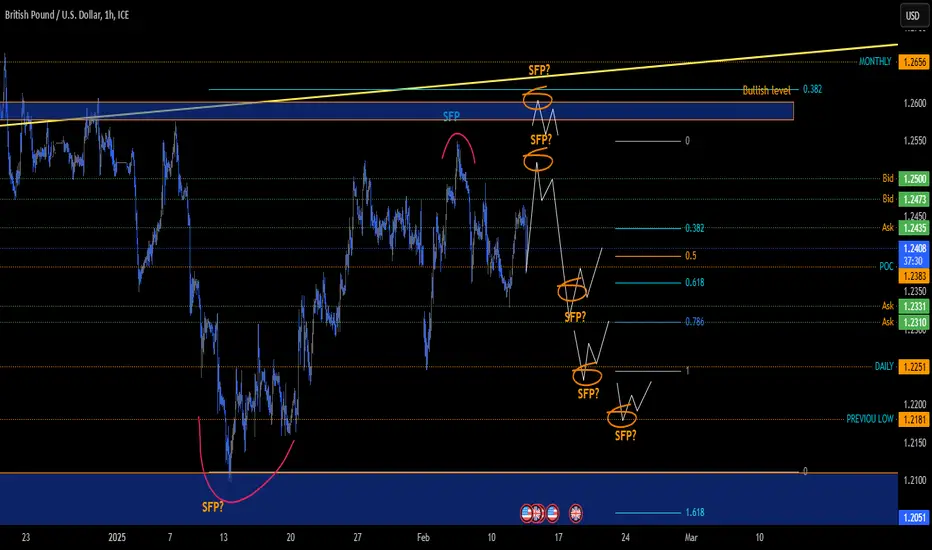
Scenario on GBPUSD 12.2.2025I see the GBPUSD market so that if I were to look for a short, the first one I like is the level for a possible sfp around the price of 1.2520, if the market were to break through the price level, then the next sfp could come into consideration around the resistance of 1.26-1.258, which is also a bulls zone, if I am to take long positions into account, the first one could come at the sfp at the level of 1.231 and the next up to the daily level 1.2251
Gbpusd signal GBP/USD holds lower ground below 1.2450 in the early European session on Thursday. Renewed US Dollar buying and a cautious market environment drags the pair lower. Traders refrain from placing big bets on the major ahead of the US Q4 advance GDP data release.
The Relative Strength Index (RSI) indicator on the 4-hour chart holds slightly above 50 but moves sideways, suggesting that the bullish bias remains intact, while lacking momentum.
Gbpusd signal

GBP/USD BUY IDEA (R:R=6.5)BUYING GBP/USD now. A beautiful SHALLOW KINGS CROWN formed on the daily chart on January 13th. Currently is in buy zone on 1 hour chart.
My Stop Loss is: 1.21340
My Target is: 1.23330 (1.880 FIB D Ext.)
Hope everyone has a great week trading!

Gbpusd long Target GBP/USD churned chart paper near the 1.2600 handle, finding thin gains through the day’s market window but failing to recapture the technical level as market flows do little to bolster the Pound Sterling
GBP/USD remains hobbled on the south side of the 1.2600 handle, churning bids north of 1.2500 as the pair finds some breathing room after another leg lower from early November’s choppy plateau just below 1.3000. Cable reached a six-month low of 1.2487 late last week, clipping into a 7% decline top-to-bottom from September’s peaks at 1.3434.
Confirm signal gbpusd

Scenario for GBSUSDAccording to the technical analysis that I presented here, at the moment there is an important support for us, which is located at the price level of 1.3060, if the bulls manage to significantly break through this level, then we can see a movement somewhere around the price level of 1.3260, which is located with levels of 0.5-0.618 fibo.

GBP/USD: The weight of evidence approachThere are always reasons not to take a trade.
You have to take a 'weight of evidence' approach - and you'll still often be wrong ;)
The idea: Trade GBP/USD short on a daily close below critical support. Looking for 2:1 RR
Reasons for:
Trend is lower (falling fractals / price below the 50 DMA)
Momentum is to the downside (MACD below zero)
If the break holds, then long term trend has turned to a downtrend, adding more force to the short term downtrend.
Reasons against:
Already had a big move lower
Longer term trend has been up - this maybe an exaggerated pullback.
The nice thing about trading, you don't have to stay wrong.
If this breakdown trade fails - it tells us the market has strength.
So then we can wait to trade a break above resistance or a fractal

GBPUSDGBPUSD . Potential long opportunity.
We believe that GBPUSD could continue to the upside after coming down to our PBA (Pull Back Area). Our entry is sitting at the pullback area at 1.33223 . We are looking for breaks of 1.33493 and 1.33813 which would confirm our target 1.34228 where our TP is sitting at (top of the consolidation area) . Our SL is sitting at 1.32712 and if broken, it would result in deeper pullbacks down to 1.32600 - 1.32200.
On the other hand, we might make the most out of it by trading the break below to the targhets mentioned above. Stay adaptive!
PARAMETERS
- Entry: 1.33223
- SL: 1.32712
- TP: 1.34228
KEY NOTES
- GBPUSD has fallen to our PBA.
- Break above 1.33493 and 1.33813 would confirm higher highs.
- Break below our SL would result in deeper pullbacks.
- We are moving in a consolidation
Happy trading!
FxPocket

gbpusdgbpusd is in uptrend and will resume uptrend after completing retracement .
GBPUSD can join his HTF trend after taking support from this poi.

GBPUSD H1 UPDATE
Hey team hope you are enjoying our Ideas and Analysis , today in trading Running session we are monitoring GBPUSD looking for a buying Opportunity around 1.25092 , once more best Buying Area is 1.24969 so when we will Recieve any conformation the trade willbe Excuted
Good luck Guys

GBPUSD clearly upwards trend Look for buy opportunities on GBPUSD.it has indicated an upwards trend for the rest of this week. Follow us for more forex signals and updates thanks!

GBPUSD BULLISH SET UP On GBPUSD look for buy opportunities..Upwards trends on GBPUSD don't try to sell u will be trapped by marked

Gbpusd GBP/USD is the forex ticker that shows the value of the British Pound against the US Dollar. It tells traders how many US Dollars are needed to buy a British Pound. The Pound-Dollar is one of the oldest and most widely traded currency pairs in the world. Follow the live GBP/USD rate with the chart and keep up to date with Pound-Dollar news and analysis. Plan your trades with the GBP/USD forecast and key pivot points data and support and resistance levels.
On the upside, GBP/USD could stage a recovery if it manages to stabilize above 1.2590/1.2600 (200-day SMA, psychological level). 1.2640 (100-day SMA) and 1.2670-1.2680 (Fibonacci 61.8% retracement of the latest uptrend, 200-period SMA on the 1-hour chart, 50-day SMA) could be seen as next hurdles.
GBP/USD trades sideways above 1.2600 amid a widespread holiday restraining action across financial markets. Investors took a long weekend ahead of critical United States employment data next week. Fed Chair Powell coming up next.
GBP USD buy confirm signal
