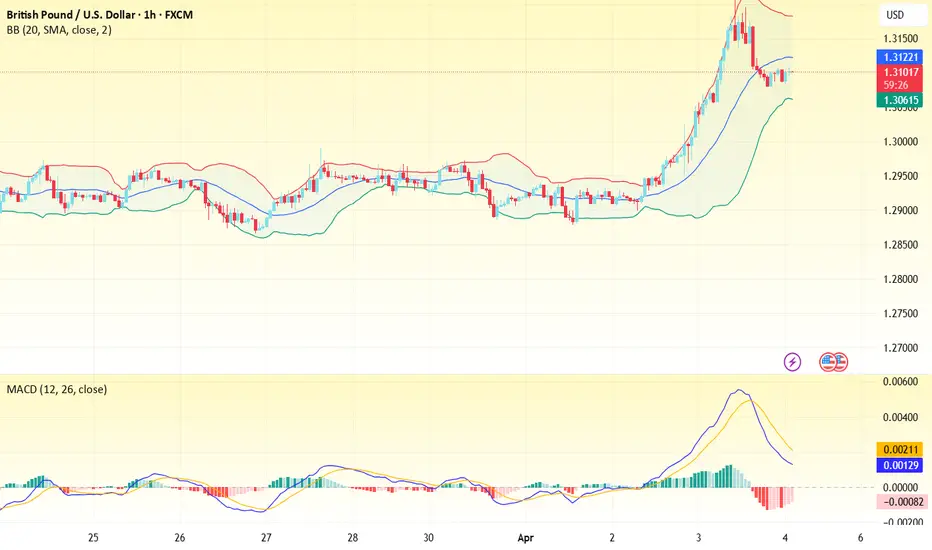
GBPUSD(20250404)Today's AnalysisMarket news:
Countermeasures from many countries against the United States - ① It is reported that Europe will slow down the pace of tariff retaliation; EU member states will vote on countermeasures against US steel and aluminum tariffs on April 9; ② Macron said that the response to US tariffs will be larger than before, and called on French companies to suspend investment in the United States. France may plan to impose retaliatory tariffs on large US technology companies. ③ Canadian Prime Minister Carney: Canada will impose a 25% tariff on all cars imported from the United States that do not comply with the US-Mexico-Canada Agreement.
Technical analysis:
Today's buying and selling boundaries:
1.3092
Support and resistance levels
1.3325
1.3238
1.3181
1.3003
1.2946
1.2859
Trading strategy:
If the price breaks through 1.3181, consider buying, the first target price is 1.3238
If the price breaks through 1.3092, consider selling, the first target price is 1.3003
Gbpusdanalysis
GBPUSD Short Term Buy IdeaM15 - Strong bullish momentum
No opposite signs
Expecting retraces and further continuation higher until the two Fibonacci support zones hold.
If you enjoy this idea, don’t forget to LIKE 👍, FOLLOW ✅, SHARE 🙌, and COMMENT ✍! Drop your thoughts and charts below to keep the discussion going. Your support helps keep this content free and reach more people! 🚀
--------------------------------------------------------------------------------------------------------------------
Disclosure: I am part of Trade Nation's Influencer program and receive a monthly fee for using their TradingView charts in my analysis.

GBP/USD Technical Analysis: Key Levels and Trade SetupThis chart represents a technical analysis of the GBP/USD currency pair on a 15-minute timeframe, using exponential moving averages (EMAs) and key levels.
Key Observations:
1. EMA Indicators:
The 200-period EMA (blue) is at 1.29238.
The 30-period EMA (red) is at 1.29155.
Price is currently below the 200 EMA, indicating a potential bearish trend.
2. Support and Resistance:
Resistance Level: 1.29346 (highlighted in blue).
Support Zone: Around 1.28857 (purple highlighted area).
3. Trading Plan:
The price is currently consolidating in a range between the support and resistance levels.
If the price breaks above 1.29346, it could move towards the target of 1.29720.
If the price fails to break resistance and falls below support (1.28857), a bearish

GBPUSD NEW UPDATESHello, Its been a long time since no post new ideas here!
Here is my longterm/swing trades on FX:GBPUSD , I recommend on longs only at below entry.
This idea base only on my own. This is also daily, it might take or not.
But the idea here is long at this zone, see the chart for your view.
This is not a financial advice, my idea on pound is continue to rise or clear the above previous high 1.34 zone or more highs.
This is your longterm/swing trades.
Trade wisely, I will update once the price breaks the first $$$ target zone.
Do your charts and compare it.
Follow for more.

Just broke through a high liquidity zone!!It just broke through a high liquidity zone!!
The marked line is the arrival point.
We still have plenty of profit-making possibilities left, so be patient.
Wait for a good pullback with the corresponding manipulation to find a good re-entry!!
If the market goes without us, it's better to take a loss where we don't know what we're doing.
Note: (A fairly crowded zone is always a liquidity zone.)
Keep it simple!
If you liked it, don't forget to follow me!

GBPUSD A clear downward move toward downside find out the targetHello Guys,
Wish you and Your Family a Very Happy Eid.
I Found out one very easy to target GBPUSD trade setup for the week . here i can see GBPUSD is building a short term wave towards downside to target 1.2780 or below .
As we have created a Higher time frame OTE model

Market Analysis: GBP/USD Eyes Fresh GainsMarket Analysis: GBP/USD Eyes Fresh Gains
GBP/USD started a fresh increase above the 1.2900 zone.
Important Takeaways for GBP/USD Analysis Today
- The British Pound is eyeing more gains above the 1.2970 resistance.
- There is a key bearish trend line forming with resistance at 1.2935 on the hourly chart of GBP/USD at FXOpen.
GBP/USD Technical Analysis
On the hourly chart of GBP/USD at FXOpen, the pair formed a base above the 1.2870 level. The British Pound started a steady increase above the 1.2900 resistance zone against the US Dollar, as discussed in the previous analysis.
The pair surpassed the 50% Fib retracement level of the downward move from the 1.2972 swing high to the 1.2879 low. The pair is now consolidating near the 1.2925 zone and the 1.2420 level and the 50-hour simple moving average.
If there is another decline, the pair could find support near the 1.2900 level. The first major support sits near the 1.2880 zone. The next major support is 1.2870.
If there is a break below 1.2870, the pair could extend the decline. The next key support is near the 1.2820 level. Any more losses might call for a test of the 1.2800 support.
Conversely, the bulls might aim for more gains. The RSI moved above the 50 level on the GBP/USD chart and the pair is now approaching a major hurdle at 1.2935 and the 61.8% Fib retracement level of the downward move from the 1.2972 swing high to the 1.2879 low.
There is also a key bearish trend line forming with resistance at 1.2935. An upside break above the 1.2935 zone could send the pair toward 1.2970. Any more gains might open the doors for a test of 1.2995.
This article represents the opinion of the Companies operating under the FXOpen brand only. It is not to be construed as an offer, solicitation, or recommendation with respect to products and services provided by the Companies operating under the FXOpen brand, nor is it to be considered financial advice.

GBP/USD 1-Hour Chart Analysis: Bearish Setup with Key ResistanceGBP/USD 1-Hour Chart Analysis: Bearish Setup with Key Levels
Key Technical Indicators:
Current Price: $1.29427
30 EMA (Red Line): $1.29453 (Short-term trend)
200 EMA (Blue Line): $1.29351 (Long-term trend)
Key Resistance Zone: $1.29663 - $1.29851 (shaded purple)
Support & Target Levels:
TP 1: $1.29358
TP 2: $1.29153
TP 3: $1.28895
Final Target: $1.28662
Analysis:
Trend:
The price is struggling around the 30 EMA and 200 EMA, showing indecision.
The shaded resistance zone ($1.29663 - $1.29851) is a key area where sellers may take control.
Trade Setup:
Entry: Expected near $1.29663 (potential rejection from resistance).
Stop Loss: Above $1.29851 (to minimize risk if price breaks higher).
Take Profit Targets: Multiple levels, with the final target at $1.28662.
Bearish Confirmation:
If price gets rejected at resistance, a downside move toward support levels is likely.
A break below 1.29358 could accelerate selling pressure.
Conclusion:
The chart suggests a potential bearish trade setup, with resistance acting as a key rejection point.
Watch for confirmation signals at the resistance zone before entering a short trade.
A break above $1.29851 would invalidate the bearish outlook.

GBPUSD is in the Selling DirectionHello Traders
In This Chart GBPUSD HOURLY Forex Forecast By FOREX PLANET
today GBPUSD analysis 👆
🟢This Chart includes_ (GBPUSD market update)
🟢What is The Next Opportunity on GBPUSD Market
🟢how to Enter to the Valid Entry With Assurance Profit
This CHART is For Trader's that Want to Improve Their Technical Analysis Skills and Their Trading By Understanding How To Analyze The Market Using Multiple Timeframes and Understanding The Bigger Picture on the Charts

GBP/USD Technical & Fundamental AnalysisThis chart presents a long (buy) trade setup on GBP/USD (British Pound to US Dollar) 30-minute timeframe.
Technical Analysis
1. Entry & Stop Loss (SL) 🛑
Entry Zone: 1.29050 - 1.29100 (Purple Support Area)
Stop Loss: Below 1.28850 (Red Box)
2. Target Zones 🎯
Target 1: 1.29300 – Minor resistance, suitable for first take-profit (TP1).
Target 2: 1.29500 – Stronger resistance level.
Target 3: 1.29700 – Major resistance area, final take-profit (TP3).
3. Market Structure & Price Action 📈
The price reacted to the entry zone, a support level.
A retest of previous demand zones before potential bullish continuation.
Risk-to-Reward Ratio (RRR): Favorable, as upside potential is greater than downside risk.
Bullish Confirmation: If price holds above the 1.29050 zone, an upward move is likely.
Recent Fundamental Factors Affecting GBP/USD
1. UK Economic Data 🇬🇧
UK GDP Growth: Slower growth than expected, but still in positive territory.
Bank of England (BoE) Policy: No immediate rate cuts, keeping GBP stable.
UK Inflation: Still above target, supporting a stronger GBP.
2. US Economic Data 🇺🇸
Federal Reserve (Fed) Policy:
Mixed signals from the Fed—some officials hint at rate cuts later this year.
If the Fed pauses or cuts rates, GBP/USD could rise.
US Non-Farm Payrolls (NFP) Data:
Expected to show job market resilience. A strong NFP could push USD higher, pressuring GBP/USD.
US GDP Data:
Slower-than-expected growth could weaken USD, helping GBP.
3. Market Sentiment 🌍
Risk-On vs. Risk-Off:
If investors shift to risk-on sentiment (buying stocks, GBP), GBP/USD could move higher.
If risk-off sentiment dominates (buying USD as a safe haven), GBP/USD may struggle.
Conclusion & Trading Plan
✅ Buy near 1.29050 - 1.29100 with SL below 1.28850.
✅ Take Profits: TP1 (1.29300), TP2 (1.29500), TP3 (1.29700).
✅ Monitor: US economic data, Fed rate expectations, and risk sentiment.

GBPUSD 4H SHORT [UPdate]In line with expectations of a decline in GBPUSD, the price interacted with the primary order block. To feel safe in this position, I move the stop order to $1.29620
I expect the downward trend I mentioned in the main review to continue to my targets:
$1.28609
$1.28030
$1.27534
$1.26722

GBPUSD:This is a bullish situationThe GBP/USD is still fluctuating repeatedly at present. Taking various factors into account, there is a great deal of market noise in the current currency market, and many currency pairs are in a sideways trend.
The British pound has been fluctuating sideways for several weeks, and the market is digesting the previous significant upward rally. The 1.30 level on the upside serves as a resistance level, while the 1.29 level on the downside acts as a support level. The so-called "golden cross" has recently occurred, so this is a bullish market.
Trading strategy:
buy@1.2910
TP:1.2970-1.2990
Get daily trading signals that ensure continuous profits! With an astonishing 90% accuracy rate, I'm the record - holder of an 800% monthly return. Click the link below the article to obtain accurate signals now!

GBPUSD Be bullishWhen the GBPUSD pair executes a definitive breach of the 1.30000 resistance ceiling — a level of both psychological and technical significance — it is poised to precipitate a substantial influx of bullish sentiment. This event not only satisfies key technical prerequisites for an upward price trajectory but also catalyzes a profound shift in market sentiment.
Consequentially, diverse market participants, ranging from institutional hedge funds to high - volume forex dealers and astute retail investors, will be drawn to the market, precipitating a marked upswing in trading volumes. The resultant robust buying momentum is forecast to drive the formation of a pronounced uptrend, propelling the pair to appreciably higher price levels.
From a forward - looking perspective, resistance levels at 1.31400 and 1.32100 are likely demarcated by prior price action, Fibonacci retracement ratios, or psychologically significant thresholds. As the pair gravitates towards these levels, short - term traders who previously established short positions at higher price points will likely execute mass short - covering, inundating the market with selling pressure.
Simultaneously, long - term bulls seeking to realize profits will contribute to the selling pressure, further exacerbating the downward - leaning market dynamics. These converging forces may well impede the pair’s upward progression and potentially instigate a short - term price correction.
Should the GBPUSD pair fail to surmount the 1.30000 resistance hurdle and commence a retracement, the 1.28800 level — identified as a zone of prior price congestion or corroborated by key technical indicators — is anticipated to attract value - seeking buyers. The influx of buying interest at this level may effectively arrest the downward momentum.
Deeper into the price spectrum, the 1.27000 level, which aligns with major moving averages or critical trendlines, functions as a pivotal line of defense. Given its status as a widely recognized strong support zone, a substantial influx of buying pressure is likely to materialize as the price approaches this level, thereby forestalling a more significant price decline and fostering market stability.
💎💎💎 GBPUSD 💎💎💎
🎁 Buy@1.28800 - 1.29000
🎁 TP 1.30000 - 1.31400
The market has been extremely volatile lately. If you can't figure out the market's direction, you'll only be a cash dispenser for others. If you also want to succeed,Follow the link below to get my daily strategy updates

GBP/USD Breakdown: Bearish Setup with Sell Opportunity!"Key Observations:
Rising Wedge Breakdown:
The price initially formed a rising wedge near resistance.
The wedge broke down, indicating bearish momentum.
Support and Resistance Levels:
Resistance Zone: Around 1.3014 – 1.3027, marking a strong rejection area.
Support Zone: Around 1.2933 – 1.2843, where price previously bounced.
Strong Support: Around 1.2627, marked as the target area for a bearish move.
Bearish Setup:
A range-bound consolidation occurred after the breakdown.
The chart marks a sell signal, suggesting a move toward the 1.2627 target zone.
Trading Idea:
Entry: Sell after confirmation below 1.2933.
Target: 1.2627 (major support level).
Stop-Loss: Above 1.3014 (resistance level).
This setup suggests a potential bearish continuation, with price expected to decline further if support breaks. Always confirm with volume and market conditions before entering a trade.

GBPUSD (CABLE)GBPUSD is still not done with correction in our opinion. Until market breaks 1.285 its not done with correction.
Disclosure: We are part of Trade Nation's Influencer program and receive a monthly fee for using their TradingView charts in our analysis.

GBP/USD Longs from 1.28900 back up to 1.30000I’m looking for long opportunities around the 5-hour demand zone, aiming to take price back up to the 6-hour supply zone, where I will then look for potential sell setups.
Since price is currently positioned between these key levels, I will wait to see where it starts to slow down and how it reacts. Ideally, I want to see accumulation in the demand zone and distribution in the supply zone before making any decisions. However, overall, my bias for GU remains bullish, especially as the U.S. dollar continues to weaken.
Confluences for GU Buys:
- A clear 5-hour demand zone presents a potential buying opportunity.
- Liquidity remains to the upside, which price may target before a reversal.
- DXY has shifted bearish, indicating a potential bullish move for GBP/USD.
- Price has been consistently bullish on the higher timeframe over the past few weeks.
Note: If price breaks below the nearby demand zone, I will expect a temporary bearish trend to form.

GBPUSD:The strategy for next week remains bullishOn Friday, the GBP/USD traded and stopped at 1.2943, hovering near the upper end of the recent trading range. The currency pair has regained the ground above the 50-day Exponential Moving Average (EMA) at 1.2933, and currently, this level serves as an intraday support level, while the 200-day EMA at 1.2896 continues to underpin the broader momentum. The price movement is approaching the resistance zone of 1.2973 to 1.3008, which has restricted multiple rebound attempts this month. Breaking through this level may reach 1.3014. On the downside, the pivot point at 1.2937 and 1.2903 remain key levels worthy of attention. The short-term structure is constructive, but the bulls need a clear breakout to confirm the continuation of the trend beyond the resistance of the downward trend line.
Trading strategy:
buy@1.2910
TP:1.2970-1.2990
Get daily trading signals that ensure continuous profits! With an astonishing 90% accuracy rate, I'm the record - holder of an 800% monthly return. Click the link below the article to obtain accurate signals now!

GBPUSD 4H SHORTAt the moment, GBPUSDT the asset is being marked down. There was a price reaction to the POI range from which a reaction was received instantly. I missed this moment due to personal matters, although there was a reminder. I understand that the risk of not opening, or the receipt of new variables from the market, can break the trend, but I will try to open a short from the designated mark 1.29686$
Targets
$1.28609
$1.28030
$1.27534
$1.26722
Risk for stop order -1%

GBPUSD in Correction Phase – Potential for a Short OpportunityGBPUSD ( FX:GBPUSD ) is approaching the Support zone($1.286-$1.278) , Support lines and Important Support line .
Regarding Elliott Wave theory , GBPUSD appears to have completed the microwave 5 of the main wave 3 with the help of the Ending Diagonal Pattern and is currently completing the main wave 4 . The main wave 4 is likely to have a Double Three Correction(WXY) .
I expect GBPUSD to decline at least to the Support zone($1.286-$1.278) and Support lines .
Note: If GBPUSD goes above $1.30 we should expect more pumping. The worst Stop Loss(SL) for a SHORT position could be $1.30.
Note: If GBPUSD falls below $1.2760, we should expect more dumping.
Please respect each other's ideas and express them politely if you agree or disagree.
British Pound/U.S. Dollar Analyze (GBPUSD), 4-hour time frame.
Be sure to follow the updated ideas.
Do not forget to put a Stop loss for your positions (For every position you want to open).
Please follow your strategy and updates; this is just my Idea, and I will gladly see your ideas in this post.
Please do not forget the ✅' like '✅ button 🙏😊 & Share it with your friends; thanks, and Trade safe.

GBPUSD longAll timeframes are extremely bullish with each timeframe having its own individual target.
3 month timeframe has a target of 1.39
1 month timeframe has a target of 1.3450
Weekly timeframe has a target of 1.3135
Daily timeframe has a target of 1.3020
My main focus is on the daily target as of now.
Price took a lot of orders at the 1.2600 psychological level and there was a lot of bullish orders.
Price broke and retested the 1.2880 liquidity region and the next target was 1.3020, however, that target was never hit.
All price is currently doing is collecting orders in order to reach that target
Yesterday and today during the Asian session, we see that price took orders at 1.2880, indicating that price is headed to 1.3020 target.
I expect numerous buy setups to form before we reach the 1.3020 target. I will update them as they form.

GBP/USD Potential Bear Momentum...I couldn't resist the GBP/USD bear opportunity here displaying a broadening pattern.
I'm already in established shorts on the EUR/USD at 1.0891 but decided to jump in on GBP/USD at 1.2916 considering the price movements can be more pronounced.
Right now, my cap on whether this trade works or not is 1.3000. if we, for whatever reason, pop back up to 1.3000, I'd close this trade but for now, I think this trade looks good and will target 1.2750 however, using chart pattern percentages, I wouldn't be surprised to see 1.2600.
We'll see how this one looks going forward, especially with trump announcing more tariffs later today.
As always, Good Luck & Trade Safe.

GBP/USDHello friends
You can see that a trend continuation triangle pattern is forming, which we can enter into a trade if it fails.
The targets are also specified.
*Trade safely with us*

GBP/USD Breakdown – Bearish Momentum Ahead?This 4-hour chart of GBP/USD shows a clear bearish setup:
🔹 Rising Wedge Breakdown – The pair has broken below a rising wedge pattern, signaling potential downside pressure.
🔹 Support and Resistance Levels –
Resistance at 1.29206 - 1.30275
Support at 1.28000 - 1.28437
Strong support at 1.27539
🔹 Sell Confirmation – A sell signal is indicated, suggesting further downside movement towards the target zone.
📉 Trading Plan:
✅ Possible short entries below the 1.28956 level.
✅ Target price: 1.27539
✅ Stop-loss above 1.29206 for risk management.
⚠️ Risk Note: Always manage risk properly and watch for any trend reversals before entering trades.
What are your thoughts? Are you bearish or bullish on GBP/USD? 🤔💬
