#GBPUSD: Smaller Time-Frame Tells A Different Story! GBPUSD has exhibited strong bullish sentiment in shorter timeframes. However, an analysis of shorter timeframes reveals a different picture. The current price trend is upward, and it is anticipated to continue. Nevertheless, we anticipate a price correction around 1.3470, followed by a continuation of the bullish move. We strongly recommend conducting your own analysis before making any investment decisions.
Best of luck in your trading endeavours, and please remember to prioritise safety.
Kindly consider liking, commenting, and sharing this analysis for further insights.
Team Setupsfx_
Gbpusdanalysis

GBP/USD Bearish Rejection at Resistance Zone – Downside Targets GBP/USD Bearish Rejection at Resistance Zone – Downside Targets Ahead 🚨
This chart analysis of GBP/USD reveals a clear bearish structure unfolding after the pair tested a strong resistance zone near the 1.36000 level. Here's the professional breakdown:
🔴 Key Resistance Zone: 1.36000 – 1.36200
Price has been rejected multiple times from this upper zone (marked in red).
Repeated upper wicks and lower closes signal selling pressure.
Recent candle formations suggest a potential reversal from this level.
🟢 Major Support Zones:
1.33090 (Mid-Level Support)
This level has acted as a reaction zone in the past.
Could provide temporary consolidation or bounce.
1.31500 – 1.32000
Strong historical support, price bounced here previously.
Bears might slow down in this area before continuation.
1.28000 – 1.29000
Deeper support zone; if broken, could indicate a major trend shift.
📉 Bearish Projection
Price is expected to descend toward 1.33090, and if momentum continues, potentially down to the 1.28 region.
The zigzag projection in the black box reflects a stair-step pattern typical of strong bearish legs.
🧠 Market Psychology & Price Action
Sellers are defending the resistance aggressively.
Lower highs and consistent rejection candles imply weakening bullish momentum.
This setup aligns with a distribution phase before a drop.
📌 Conclusion
🔻 As long as the price remains below the 1.36000 resistance, the bias remains bearish. Watch for confirmations at 1.33090 and 1.32000 – these are crucial zones where price decisions will unfold.
📆 Short to mid-term traders may look for sell setups on retracements with stop-losses above the resistance and targets near support zones.

GU-Tue-17/06/25 TDA-Daily resistance 1.36155 holding strong!Analysis done directly on the chart
Follow for more, possible live trades update!
No one is born with skills and knowledge.
Everyone see the success but not the struggle
behind everything (not all of course). If you want
to get out of a situation, you need to learn to be
uncomfortable and getting out of your comfort zone.
Active in London session!
Not financial advice, DYOR.
Market Flow Strategy
Mister Y

GBPUSD(20250617)Today's AnalysisMarket news:
Revised version of the Republican tax cut bill in the US Senate: It is proposed to raise the debt ceiling to 5 trillion, and the overall framework is consistent with the House version.
Technical analysis:
Today's buying and selling boundaries:
1.3577
Support and resistance levels:
1.3664
1.3632
1.3611
1.3544
1.3522
1.3490
Trading strategy:
If it rises and breaks through 1.3577, consider entering the market to buy, and the first target price is 1.3611
If it falls and breaks through 1.3544, consider entering the market to sell, and the first target price is 1.3522

GBPUSD ANALYSIS After seeing how the previous daily candle close bullish and the 4hr structure make a retracement to a key level of 1.35626, we could be looking for another push leg up to make a new HH on the 4hr but waiting for confirmation on the daily timeframe.

GBPUSD ANALYSISAfter seeing the previous weekly candle close bullish, and the structure on the daily and 4hr timeframes all pointing to a bullish trend we could expect the market to make a new leg to the upside.

GU-Mon-16/06/25 TDA-All major banks rate decisions this week!Analysis done directly on the chart
Follow for more, possible live trades update!
To measure your consistency performance, you
need years of track record. Having good days or
weeks or months is not enough to say that you
are consistently profitable. This is the reality of
trading. You need to adapt to how market is
changing and with time that really proves how
good you are.
Active in London session!
Not financial advice, DYOR.
Market Flow Strategy
Mister Y

GBPUSDGBPUSD needs one more push up before a drop.
Disclosure: We are part of Trade Nation's Influencer program and receive a monthly fee for using their TradingView charts in our analysis.

GBPUSD | 2 Long Scenarios | The Empire will strike backGeneral
GBPUSD fell through the first big support zone (Zone 2) unless a reclaim i am not gonna look for longs currently. Personally waiting for price falling deeper into Zone 1. Marked 2 Scenarios that i would want to see to develop.
Be aware that i usually use LTF (such as the 1 hour chart to plan my entries). Meaning the SLs and RR are not completly correct as shown.
1. Long (Green arrow)
Price moves below Zone 1. Reclaim. Enter on reclaim.
Target: Slightly below Zone 3
Stop- Loss: Depending on the LTF entry i wouldnt want to see it going below Zone 1 again
Time duration: Days, weeks, months, years... ;)
2. Long (Orange arrow)
Price pushes into Zone 1, reacts supportive and then generates a Swing. Enter on breaking of the generated swing.
Target: Slightly below Zone 3
Stop- Loss: A bit below of top of the Zone 1
Time duration: Days, weeks, months, years... ;)
Good luck
Disclaimer:
- This information does not constitute as financial advice and is only for educational purposes. I am not your financial advisor.
- You trade entirely at your own risk
- Make your own research
- Finance and trading is evil, capitalism is bad, duh ;)

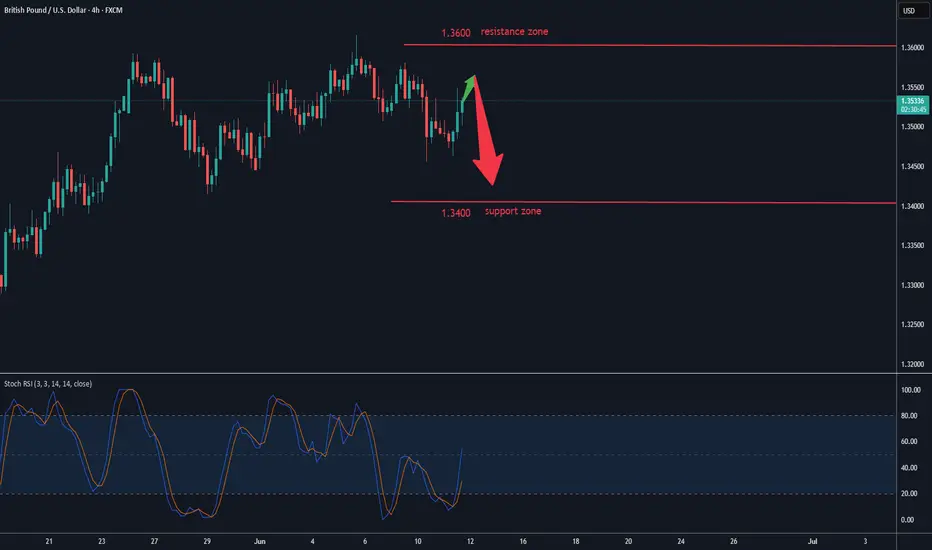
GBPUSD will continue to rise and break last week's highGBPUSD is correcting lower in the range at the end of the week. This pullback is heading towards the 1.350 support. There will be a bullish reaction at this area. Or if the selling pressure really takes over the market at this support area, then pay attention to the 1.346 bottom for the BUY strategy of this currency pair.
On the other hand, 1.360 will prevent the price increase. It will act as strategic resistance before a new extended breakout to the upside.
The uptrend is more likely to continue than the downtrend, so prioritizing BUY signals will bring better profits to the currency pair.
Support: 1.350, 1.346
Resistance: 1.360, 1.366

GU-Fri-13/06/25 TDA-Difficult zone, prioritize risk management!Analysis done directly on the chart
Follow for more, possible live trades update!
June definitely showing slower price action,
tighter range movement (average daily movement).
This is how markets work! Some months it gives
good push, wide average daily movement. Some others,
it gives less average daily movement and slower pushes.
Active in London session!
Not financial advice, DYOR.
Market Flow Strategy
Mister Y

GBPUSD(20250613)Today's AnalysisMarket news:
The number of initial jobless claims in the United States for the week ending June 7 was 248,000, higher than the expected 240,000, the highest since the week of October 5, 2024. The monthly rate of the core PPI in the United States in May was 0.1%, lower than the expected 0.30%. Traders once again fully priced in the Fed's two interest rate cuts this year.
Technical analysis:
Today's buying and selling boundaries:
1.3585
Support and resistance levels
1.3685
1.3648
1.3624
1.3547
1.3522
1.3485
Trading strategy:
If the price breaks through 1.3624, consider buying in, the first target price is 1.3648
If the price breaks through 1.3585, consider selling in, the first target price is 1.3547

GBP/USD Rally Resumes – Bullish Targets AheadHi everyone,
As outlined in our previous GBP/USD analysis (idea linked below), the Cable confirmed its continued rally following a decisive break above the 1.35195 level. This was quickly followed by a move through our highlighted levels at 1.35630 and 1.35934.
As previously noted, the clearance of these levels strengthens our expectation for further upside, with the next key level of interest around 1.36850. We'll be watching to see how price action develops from here.
We’ll continue to provide updates on the projected path for GBP/USD as price approaches this target.
The longer-term outlook remains bullish, and we expect the rally to continue extending further from the 1.20991 January low.
We’ll be keeping you updated throughout the week with how we’re managing our active ideas. Thanks again for all the likes/boosts, comments and follows — we appreciate the support!
All the best for the week ahead. Trade safe.
BluetonaFX


GBPUSD is rising towards the resistance zone of 1.35600GBPUSD is heading towards 1.35600. If the gold price closes around this area, it confirms that the buyers have entered the market. You can set up a BUY signal now with SL placed below the candle wick. After touching 1.356, we can wait for the price reaction and set up a SELL signal again following the sideways border.
Do you agree with our view of buying 1.34900 and SL 1.34600?
Leave a comment

GBP/USD Technical Analysis – Bearish Setup Developing!GBP/USD Technical Analysis – Bearish Setup Developing! 🔻
Chart Breakdown (H4):
📌 Resistance Zone (🔴 1.35800 – 1.36000):
The pair has been rejected multiple times from this strong resistance area, marked by multiple upper wicks and bearish pressure. Most recent price action shows another rejection, forming a lower high.
📌 Support Level (🟣 1.34732):
This key horizontal level has acted as a strong support multiple times (highlighted with 🟠 circles), suggesting bulls are attempting to defend this zone.
📉 Bearish Structure Formation:
Price recently tested resistance again and was rejected sharply.
A potential double-top or lower high structure is forming.
A break and close below the 1.34732 support will likely confirm bearish momentum.
📍 Next Target (🔻):
If support breaks, price may fall towards the support demand zone around 1.34150 – 1.34300, aligning with the marked red support box.
📈 Invalidation Point:
A clean breakout and hold above 1.36000 would invalidate this bearish bias and potentially signal continuation higher.
⚠️ Summary:
🔼 Resistance Rejection at 1.36000
🔽 Watching for break below 1.34732
🎯 Bearish target: 1.34300 zone
🔄 Invalidation: Break above 1.36000
Bias: 📉 Bearish Below 1.34732

GU-Thu-12/06/25 TDA-Higher US CPI, why GU pumped? explained!Analysis done directly on the chart
Follow for more, possible live trades update!
Here's the tricky part of CPI, this year 2.4% higher
than last year 2.3% but GU still pumped, why?
Because consensus was 2.5% and since it released
2.4% which is lower than consensus, bad for dollar
thus GU pumping.
Active in London session!
Not financial advice, DYOR.
Market Flow Strategy
Mister Y

GBPUSD(20250612)Today's AnalysisMarket news:
① The EU hopes that the trade negotiations will be extended beyond the suspension period set by Trump. ② Bessant: As long as "sincerity" is shown in the negotiations, the Trump administration is willing to extend the current 90-day tariff suspension period beyond July 9. ③ Trump will hold multiple bilateral talks during the G7 summit. ④ The total customs revenue of the United States reached a record high of US$23 billion in May, an increase of nearly four times year-on-year. ⑤ Lutnick: One deal after another will be reached.
Technical analysis:
Today's buying and selling boundaries:
1.3525
Support and resistance levels:
1.3627
1.3589
1.3564
1.3486
1.3461
1.3423
Trading strategy:
If the price breaks through 1.3564, consider buying in, the first target price is 1.3589
If the price breaks through 1.3525, consider selling in, the first target price is 1.3486

The British pound's rebound was blockedThe British pound staged a technical rebound after a sharp decline on Tuesday, trading near 1.35 during the North American session. A day earlier, the exchange rate had retreated amid expectations that the Bank of England (BoE) would continue to cut rates twice within the year, triggered by weak UK labor market data. However, on Wednesday, against the backdrop of the US CPI data falling short of expectations, the US Dollar Index weakened, allowing the pound to rebound. Although the exchange rate has regained the 1.35 threshold currently, if UK economic data continues to be weak, the pound may test support levels at 1.34 or lower again.
Humans need to breathe, and perfect trading is like breathing—maintaining flexibility without needing to trade every market swing. The secret to profitable trading lies in implementing simple rules: repeating simple tasks consistently and enforcing them strictly over the long term.
GU-Wed-11/06/25 TDA-All eyes on US CPI release in NY session!Analysis done directly on the chart
Follow for more, possible live trades update!
Here's a brief definition of CPI copied directly from Fxstreet.com:
Link: www.fxstreet.com
Inflationary or deflationary tendencies are measured by periodically
summing the prices of a basket of representative goods and services
and presenting the data as The Consumer Price Index (CPI).
CPI data is compiled on a monthly basis and released by the
US Department of Labor Statistics. The YoY reading compares
the prices of goods in the reference month to the same month a year earlier.
The CPI is a key indicator to measure inflation and changes in purchasing trends.
Generally speaking, a high reading is seen as bullish for the US Dollar (USD),
while a low reading is seen as bearish.
Active in London session!
Not financial advice, DYOR.
Market Flow Strategy
Mister Y

GBPUSD ANALYSISAfter seeing the previous daily candle close bearish and below support, we could expect the move to continue since the 4hr also has structural type move pushing to the downside

DeGRAM | GBPUSD broke the channel📊 Technical Analysis
● Pullback stalled exactly on the purple trend-support (≈1.348) and the channel mid-line after a false break of the upper wedge, preserving the sequence of higher-lows since May.
● Price is basing inside the 1.337-1.353 support strip; reclaim of 1.3530 would invalidate the bearish trap and open the next channel-median / April swing at 1.3590, while the lower rail at 1.3250 guards the up-trend.
💡 Fundamental Analysis
● UK April wage growth held at 5.7 % y/y, keeping BoE tightening bias alive, while softer US CPI expectations cool Treasury yields—narrowing the rate gap and underpinning sterling.
✨ Summary
Long 1.337-1.348; confirmation above 1.353 targets 1.3590, stretch 1.3700. View void on an H4 close below 1.3250.
-------------------
Share your opinion in the comments and support the idea with a like. Thanks for your support!

GU-Tue-10/06/25 TDA-Will supports hold or GU breaking down?Analysis done directly on the chart
Follow for more, possible live trades update!
Qualitative over quantitative trades, if I don't see good volume,
efficient moves with less and less drawdown I don't mind not taking
any trades even for days if it's necessary. When you control the urge
of having necessarily take trades everyday your psychology will level up a lot.
I take profits based on what the market conditions offer me and
not sticking to always have to set necessarily 1:2 RR or whatever.
It all depends on how market is doing. That's something we can't control.
Active in London session!
Not financial advice, DYOR.
Market Flow Strategy
Mister Y
