GBPUSD Edges HigherGBPUSD Edges Higher
GBP/USD is attempting a fresh increase above the 1.3500 resistance.
Important Takeaways for GBP/USD Analysis Today
- The British Pound is attempting a fresh increase above 1.3515.
- There was a break above a key bearish trend line with resistance at 1.3535 on the hourly chart of GBP/USD at FXOpen.
GBP/USD Technical Analysis
On the hourly chart of GBP/USD at FXOpen, the pair declined after it failed to clear the 1.3615 resistance. The British Pound even traded below the 1.3575 support against the US Dollar.
Finally, the pair tested the 1.3500 zone and is currently attempting a fresh increase. The bulls were able to push the pair above the 50-hour simple moving average and 1.3540. There was a break above a key bearish trend line with resistance at 1.3535.
The pair tested the 50% Fib retracement level of the downward move from the 1.3616 swing high to the 1.3507 low. It is now showing positive signs above 1.3540.
On the upside, the GBP/USD chart indicates that the pair is facing resistance near 1.3575 and the 61.8% Fib retracement level of the downward move from the 1.3616 swing high to the 1.3507 low.
The next major resistance is near 1.3590. A close above the 1.3590 resistance zone could open the doors for a move toward 1.3615. Any more gains might send GBP/USD toward 1.3650.
On the downside, immediate support is near the 1.3515. If there is a downside break below 1.3515, the pair could accelerate lower. The first major support is near the 1.3500 level. The next key support is seen near 1.3450, below which the pair could test 1.3420. Any more losses could lead the pair toward the 1.3350 support.
This article represents the opinion of the Companies operating under the FXOpen brand only. It is not to be construed as an offer, solicitation, or recommendation with respect to products and services provided by the Companies operating under the FXOpen brand, nor is it to be considered financial advice.
Gbpusdanalysis

GU-Mon-9/06/25 TDA-GU back in the range after NFPAnalysis done directly on the chart
Follow for more, possible live trades update!
When sometimes you don't take trades, you
can always take notes and learn more than
you already know about market movement,
price fluctuations, developing better pattern
recognition.
Active in London session!
Not financial advice, DYOR.
Market Flow Strategy
Mister Y

GBPUSD(20250609)Today's AnalysisMarket news:
Fed Harker: Amid uncertainty, the Fed may still cut interest rates later this year. Musallem: There is a 50% chance that the trade war will lead to a sustained inflation outbreak. Tariffs may push up inflation within one or two quarters. The ECB cut three key interest rates by 25 basis points. Lagarde hinted that the rate cut cycle will end, and the market is no longer fully pricing in another 25 basis point rate cut this year.
Technical analysis:
Today's buying and selling boundaries:
1.3538
Support and resistance levels:
1.3615
1.3586
1.3568
1.3509
1.3491
1.3462
Trading strategy:
If the price breaks through 1.3538, consider buying in, with the first target price of 1.3568
If the price breaks through 1.3509, consider selling in, with the first target price of 1.3491

GBPUSD ANALYSISAfter seeing the previous week close above 135.000 we could expect a retest of that area before the market continues to the upside, but in the mean time the daily and 4hr are currently showing bearish type setups which could be a sign that the retracement on the weekly could form

"Continue to maintain strength"The GBP/USD trended higher in a volatile manner this week, rising 0.5% on a weekly basis and demonstrating relatively robust performance among major currencies. The UK's exemption from Trump's newly imposed steel and aluminum tariffs provided support for the British pound, with market sentiment remaining relatively optimistic. Analysts noted that the UK's immunity to Trump's steel and aluminum tariffs constitutes a positive factor for the GBP, but next week's employment data will be pivotal. A rise in the unemployment rate for April could weaken the pound's upward momentum. The market holds a positive view on the Bank of England's (BoE) cautious monetary policy stance, believing it will help the GBP maintain its strength in the short term.
Humans need to breathe, and perfect trading is like breathing—maintaining flexibility without needing to trade every market swing. The secret to profitable trading lies in implementing simple rules: repeating simple tasks consistently and enforcing them strictly over the long term.

GBPUSDGBPUSD needs some more downside before a further push up towards 1.365 level.
Disclosure: We are part of Trade Nation's Influencer program and receive a monthly fee for using their TradingView charts in our analysis.

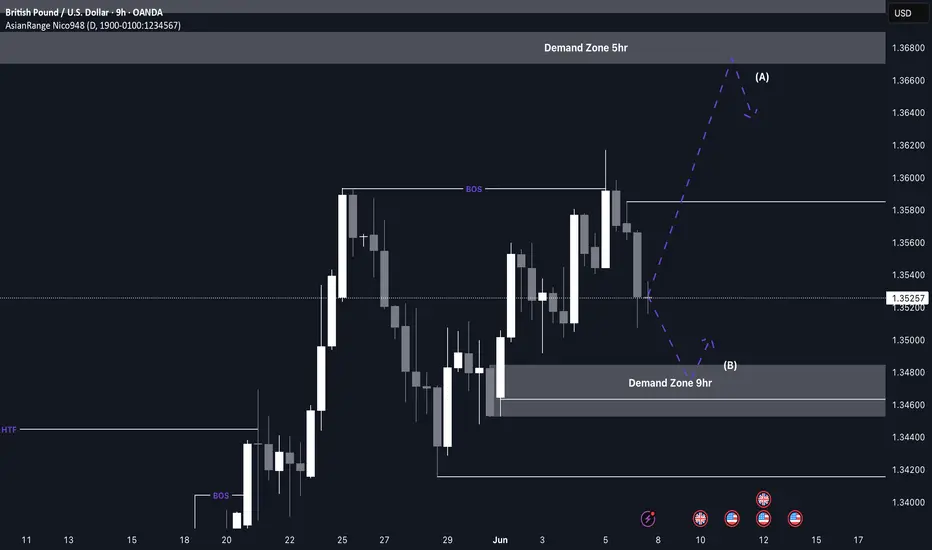
GBP/USD Buys from 1.34800 This week’s analysis focuses on capitalising on the strong bullish structure forming on GU. After a clear break of structure to the upside, price has been forming consistent higher highs and higher lows.
From this move, a key Point of Interest has been left around the 1.34800 level, which aligns with a clean 9H demand zone. As price now needs to retrace after the recent bullish push, this 9H zone becomes a likely area for accumulation and a potential continuation rally.
Confluences for GU Buys:
- GU has been very bullish overall on the higher timeframes
- The 9H demand zone caused the latest break of structure to the upside
- There’s plenty of liquidity and imbalance above that needs to be taken
- The DXY is moving bearish, supporting GU upside
P.S. If price pushes higher before retracing, it may enter a premium supply zone, where I’ll be watching for any significant reaction. Either way, patience is key — don’t hesitate to wait for your setup to fully form.
Wishing you a focused and profitable trading week!
GU-Fri-6/06/25 TDA-This week mostly after news driven PA!Analysis done directly on the chart
Follow for more, possible live trades update!
PA= price action
This week unless you're good fundamental
analyst or taking good advantage of fundamental news,
it was not easy to trade normal price action. (at least for me)
Since I trade only London session, and majority of moves
happen in NY session after news release.
This week was not the best for me, keeping myself low risk
max medium risk trades.
Active in London session!
Not financial advice, DYOR.
Market Flow Strategy
Mister Y

GBPUSD(20250605)Today's AnalysisMarket news:
U.S. economic data-① ADP employment increased by 37,000 in May, far below the expected 110,000 and the previous value of 62,000. ② The U.S. ISM non-manufacturing index in May fell to 49.9, shrinking for the first time in nearly a year, and the expected increase was from 51.6 to 52.
Technical analysis:
Today's buying and selling boundaries:
1.3543
Support and resistance levels:
1.3622
1.3593
1.3574
1.3513
1.3494
1.3465
Trading strategy:
If the price breaks through 1.3574, consider buying, and the first target price is 1.3593
If the price breaks through 1.3543, consider selling, and the first target price is 1.3513

GBPUSD 4H MAJOR REVERSAL SETUP – WATCH FOR THE BREAK!Hey There;
The Head & Shoulders (H&S) pattern in GBPUSD is becoming more defined, approaching a critical neckline level. If a breakout occurs, it could trigger a strong downward move, pushing the price toward new support levels.
Right now, sellers are gaining strength while buyers attempt to defend key support zones. A confirmed close below the neckline could accelerate the sell-off.
📌 If the breakout happens, I’ll share target levels with you—stay tuned for updates
I meticulously prepare these analyses for you, and I sincerely appreciate your support through likes. Every like from you is my biggest motivation to continue sharing my analyses.
I’m truly grateful for each of you—love to all my followers💙💙💙

GU-Thu-5/06/25 TDA-US bad data report, GU tapped WR 1.35790!Analysis done directly on the chart
Follow for more, possible live trades update!
Market conditions shift, you have to learn to
adapt to it. Trading price action, you learn to
react to the market. The way the candles moves
differently it might indicates shift of market
dynamics.
Active in London session!
Not financial advice, DYOR.
Market Flow Strategy
Mister Y

Can it break through 1.36?The GBP/USD exchange rate continued to trade in a high-range consolidation during the North American session, currently hovering near the 1.353 level with a slight intraday rebound. The US Dollar Index turned lower following the release of weak ADP employment data, providing some support for the British Pound. The US added only 37,000 jobs in the private sector in May, far below the market expectation of 115,000, reinforcing market bets on future Federal Reserve rate cuts. In the short term, the exchange rate may continue to consolidate within the range of 1.3450 to 1.3600. If the US non-farm payroll data remains weak, the exchange rate is expected to break above the 1.3600 level, opening up further upside potential.
Humans need to breathe, and perfect trading is like breathing—maintaining flexibility without needing to trade every market swing. The secret to profitable trading lies in implementing simple rules: repeating simple tasks consistently and enforcing them strictly over the long term.
First GU analysis, GU is heading towards resistanceGBPUSD has hit the old breakout support zone and is bouncing in today's US session. When GU closed above 1.351 on h1, it confirmed a nice BUY signal. Target is towards 1.355. In case it closes below 1.351, we have to wait for further confirmation to have a trading strategy.
Do you agree with me?

GU-Wed-4/06/25 TDA-Not easy zone to mess with GU!Analysis done directly on the chart
Follow for more, possible live trades update!
Today's focus: Trading Psychology
-Have you ever over traded?
-Have you ever revenge traded?
-Have you ever got greedy and end up
with a loss instead of good profits?
-What is something that you struggle to
these days psychologically speaking?
I've been all these situations mentioned above!
Each of this three steps are crucial to
become a very good trader:
1) Consistently profitable strategy
2) Proper risk management
3) Trading Psychology
What's your ideal solution to improve
your trading psychology?
Comment down below!
Not financial advice, DYOR.
Market Flow Strategy
Mister Y

GBPUSD 1H chart✅ What I Like:
Clean Fair Value Gap (FVG):
The FVG is clearly defined and price is actively returning to it.
This offers a textbook point of interest (POI) for a potential short.
Price Delivered into Premium:
This FVG is sitting in a premium zone (above the equilibrium of the recent swing), making it a good area for potential shorts if internal liquidity has been swept.
Aggressive Displacement Candle:
The bullish candle that tapped into the FVG is impulsive — might be a liquidity run, grabbing buy-side liquidity before a reversal.
⚠️ Concerns:
No Clear Liquidity Sweep Yet:
There’s no obvious run on recent highs before price hits the FVG.
Without a liquidity grab, the setup might lack that “smart money” confirmation.
No Market Structure Shift Confirmed:
We’re still in bullish short-term structure unless we break a recent low.
A reversal from the FVG needs confirmation via lower-timeframe BOS.
Dollar News Event Approaching?
The FVG reaction could fake out if major USD data is near.
Fundamentals can disrupt clean technical setups.
🧠 Final Thoughts:
If this setup is to be shorted:
Wait for 15m or 5m structure shift.
Look for signs of exhaustion or rejection in the FVG zone (e.g., bearish engulfing, liquidity sweep of intraday highs).
If price pushes above the FVG without rejection, it may invalidate the short and continue toward higher liquidity.
High-probability zone, but needs confirmation + narrative.

GBP Bearish Outlook | Potential GBP Short Setup The GBP is currently showing signs of weakness as it approaches a key resistance zone. Price action suggests a potential bearish reversal, with lower highs forming and momentum indicators signaling exhaustion. A rejection from this level could lead to a continuation of the downtrend. Traders may look for short opportunities upon confirmation of a breakdown below support, with potential targets at previous swing lows.
Key Points:
Price testing major resistance zone.
Bearish candlestick patterns visible.
Momentum divergence / overbought RSI (if applicable).
Potential short entry on breakdown with tight risk management.
This is just idea not financial advice

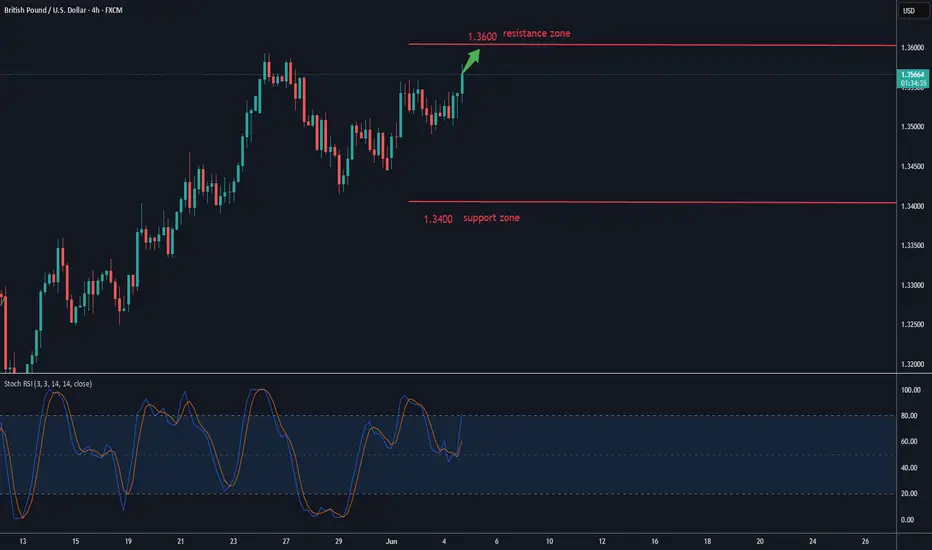
Consolidation ahead of the next bullish rallyThe GBP/USD exchange rate has edged lower below the three-year high of 1.3592 set in May. To sustain the upward momentum, prices need to decisively close above the resistance line of 1.3597 since July 2023 (which capped gains last week). A breakthrough above the key resistance zone of 1.3658 could trigger a stronger rally, targeting the 2022 high of 1.3747. Further breakthroughs may shift market focus to the upward trendline (around 1.3865). Technically, short-term risks remain biased to the upside, supported by the rebound of the stochastic oscillator.
Humans need to breathe, and perfect trading is like breathing—maintaining flexibility without needing to trade every market swing. The secret to profitable trading lies in implementing simple rules: repeating simple tasks consistently and enforcing them strictly over the long term.
Trading Strategy:
buy@1.3490-1.3500
TP:1.3550-1.3600

GBP/USD M15 Support & Resistance Levels🚀 Here are some key zones I've identified on the 15m timeframe.
These zones are based on real-time data analysis performed by a custom software I personally developed.
The tool is designed to scan the market continuously and highlight potential areas of interest based on price action behavior and volume dynamics.
Your feedback is welcome!

GU-Tue-3/06/25 TDA-DR 1.35577 tapped, GU consolidatingAnalysis done directly on the chart
Follow for more, possible live trades update!
Consistency, build solid confidence in your
execution, management. It's not easy, but
if your plan is to stay for the long term. With
discipline, consistently showing off, patience,
dedication, study, learn, apply. You'll eventually
get there!
Not financial advice, DYOR.
Market Flow Strategy
Mister Y

The current trend of the US dollar remains bullish.During the European session, the US Dollar Index extended its weakness, falling 0.67% intraday to 98.7731, approaching the low seen on April 22nd. GBP/USD rose synchronously by 0.61% to 1.3538.
Key Drivers:
Tariff rhetoric reignites market concerns
Potential impact of the S899 clause
Diverging expectations on Federal Reserve policy
ING analyst Chris Turner noted: "The risk of early termination of the trade agreement and the S899 clause have created dual pressures, causing the US dollar to continue weakening. GBP/USD is likely to remain bullish-dominated."
Humans need to breathe, and perfect trading is like breathing—maintaining flexibility without needing to trade every market swing. The secret to profitable trading lies in implementing simple rules: repeating simple tasks consistently and enforcing them strictly over the long term.
Trading Strategy:
buy@1.13400-1.13450
TP:1.13550-1.13600

GU-Mon-2/06/25 TDA-GU pushing up, possible breakout buy!Analysis done directly on the chart
Follow for more, possible live trades update!
Breakout trade:
It's always good to wait for candle closure above
or below certain levels (depending on if you are buying
or selling). Then have lower timeframe structure to
put good sl and be able to manage properly.
Always know beforehand where to put your sl and tp.
Not financial advice, DYOR.
Market Flow Strategy
Mister Y

SHORT IT !! - GBPUSD SHORT FORECAST Q2 W23 D2 Y25GBPUSD SHORT FORECAST Q2 W23 D2 Y25
🔥👀QUICK SCOPE TECHNICAL REVERSAL HOT PICK
Professional Risk Managers👋
Welcome back to another FRGNT chart update📈
Diving into some Forex setups using predominantly higher time frame order blocks alongside confirmation breaks of structure.
Let’s see what price action is telling us today!
💡Here are some trade confluences📝
✅Weekly order block
✅15' order block
✅4 hour order block
✅Tokyo ranges to be filled
🔑 Remember, to participate in trading comes always with a degree of risk, therefore as professional risk managers it remains vital that we stick to our risk management plan as well as our trading strategies.
📈The rest, we leave to the balance of probabilities.
💡Fail to plan. Plan to fail.
🏆It has always been that simple.
❤️Good luck with your trading journey, I shall see you at the very top.
🎯Trade consistent, FRGNT X

GBPUSD Holds Above 1.34 – Is 1.35 the Launch Pad?In last week’s GBPUSD outlook, I pointed to the 1.34 zone as a potential buy area and likely end of the correction.
The market reacted as expected, reversing from 1.34 and rallying to 1.35. Toward the end of the week, a brief correction followed — but price held above 1.34 and has now returned to 1.35, printing a higher low in the process.
📌 From both a technical and psychological standpoint, 1.35 remains a key level. A confirmed break above could lead to a retest of the recent high — or even push for a new high.
✅ My bias stays bullish as long as 1.34 support remains intact.
Disclosure: I am part of TradeNation's Influencer program and receive a monthly fee for using their TradingView charts in my analyses and educational articles.
