GBPUSD: Bullish (Short Term)Price formed a bullish choch and is trading above QP 1.325. Look to buy...
(H4)
🟩 Key Zone to Watch: 1.3175–1.3205
(H1)
🟩 Order Block: 1.3210–1.3225 holding as support
📉 H1 remains bearish — no BOS yet
Execution Clue for Buy Setup:
M15 or H1 bullish BOS above 1.3295–1.3300 after tapping 1.3175–1.3200
(M15)
Wait for price to reach 1.3175–1.3205
Then confirm bullish M15 BOS above 1.3225
That’s your trigger to enter on the pullback
Gbpusdbullish

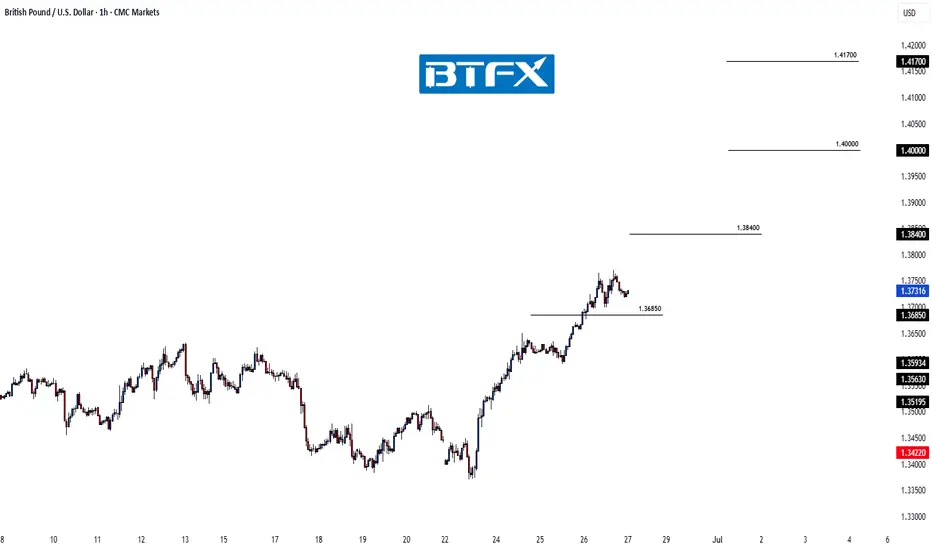
GBP/USD Rally in Full Swing – Bullish Targets AheadHi everyone,
Price achieved the 1.36850 having found support near the 1.33800 level.
As previously noted, the clearance of these levels strengthens our expectation for further upside, with the next key level of interest around 1.38400. We'll be watching to see how price action develops from here.
We’ll continue to provide updates on the projected path for GBP/USD as price approaches this target.
The longer-term outlook remains bullish, and we expect the rally to continue extending further from the 1.20991 January low towards 1.40000 and 1.417000.
We’ll be keeping you updated throughout the week with how we’re managing our active ideas. Thanks again for all the likes/boosts, comments and follows — we appreciate the support!
All the best for the week ahead. Trade safe.
BluetonaFX
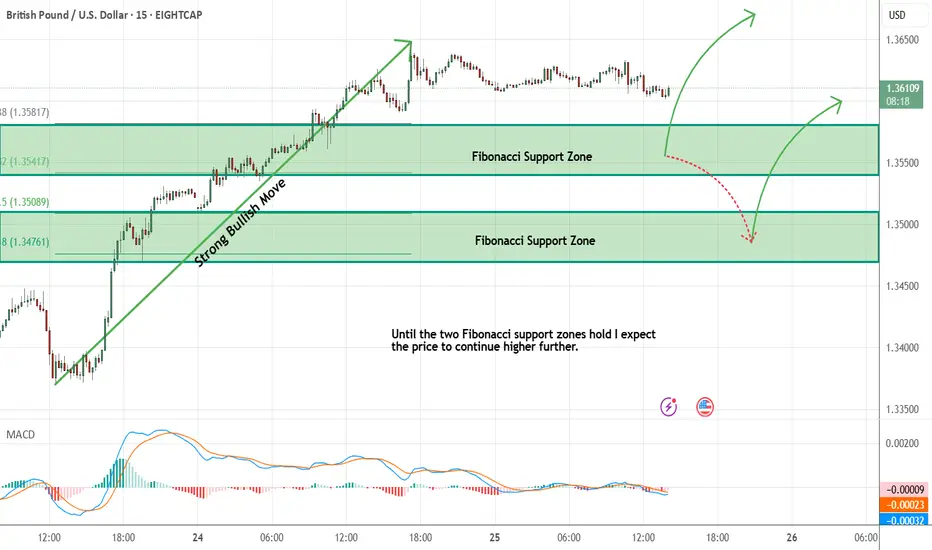
GBPUSD - Expecting Bullish Continuation In The Short TermM15 - Strong bullish momentum followed by a pullback.
No opposite signs.
Until the two Fibonacci support zones hold I expect the price to move higher further.
If you enjoy this idea, don’t forget to LIKE 👍, FOLLOW ✅, SHARE 🙌, and COMMENT ✍! Drop your thoughts and charts below to keep the discussion going. Your support helps keep this content free and reach more people! 🚀
--------------------------------------------------------------------------------------------------------------------
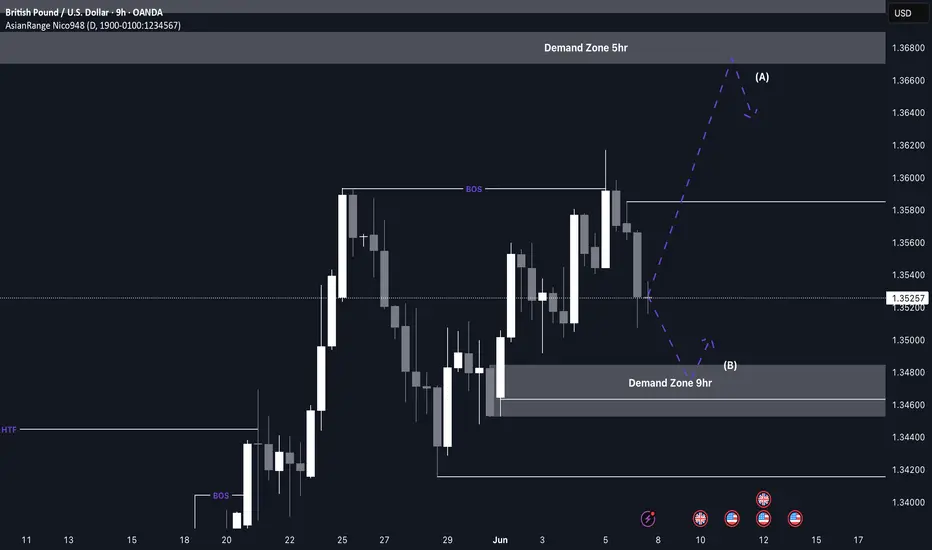
GBP/USD Buys from 1.34800 This week’s analysis focuses on capitalising on the strong bullish structure forming on GU. After a clear break of structure to the upside, price has been forming consistent higher highs and higher lows.
From this move, a key Point of Interest has been left around the 1.34800 level, which aligns with a clean 9H demand zone. As price now needs to retrace after the recent bullish push, this 9H zone becomes a likely area for accumulation and a potential continuation rally.
Confluences for GU Buys:
- GU has been very bullish overall on the higher timeframes
- The 9H demand zone caused the latest break of structure to the upside
- There’s plenty of liquidity and imbalance above that needs to be taken
- The DXY is moving bearish, supporting GU upside
P.S. If price pushes higher before retracing, it may enter a premium supply zone, where I’ll be watching for any significant reaction. Either way, patience is key — don’t hesitate to wait for your setup to fully form.
Wishing you a focused and profitable trading week!
GBP/USD bullish run still going?This week’s analysis for GU is centred around the current pro-trend momentum and where we could see potential entries to continue riding it.
To begin with, there’s a refined 3D supply zone located at a premium level which could cause a short-term bearish reaction. I’ll be monitoring this area for any possible short setups — but only with strong confirmation.
However, the overall structure remains predominantly bullish, as shown by a series of higher highs and higher lows, along with significant breaks of structure. The most relevant point of interest for a bullish continuation sits around the 1.34200 level, where a clean 9H demand zone resides. This is where I’ll be looking to enter long positions if price retraces to that area.
Confluences for GU Buys:
- Clear formation of higher highs and higher lows, confirming bullish structure
- Strong 9H demand zone that initiated the recent break of structure
- Liquidity above still yet to be cleared
- DXY remains bearish, supporting continued bullish momentum on GBP/USD
P.S. Don’t get too caught up chasing countertrend moves. The real edge lies in identifying the nearest POI that aligns with the overall trend and waiting for your setup to unfold there.

GBPUSD: Bulls Are Gearing Up For The Next RallyBullish Confirmations:
- Double bottom formed at QP at end of last week
- Creating HLs and HHs
- Bullish Choch
- Multiple bullish FVGs (showing bullish momentum)
- Multiple bullish breaker blocks
🟢ENTRY 1.33578
SL 1.331
TP1 1.33778
TP2 1.34078
TP3 1.34578
There's a chance we may get a deeper pullback. If so no big deal, we'll just catch a better entry.

BUY GBPUSDBUY Confirmations....
- Bullish CHoCH
- Trading above QP 1.275 (Next stop 1.3?)
- M15 Bullish FVG
- H1 Bullish FVG
- USD news was negative
My entry, stop loss, and final target is on the chart

GBP/USD "The Cable" Forex Market Bullish Heist Plan🌟Hi! Hola! Ola! Bonjour! Hallo!🌟
Dear Money Makers & Robbers, 🤑 💰
Based on 🔥Thief Trading style technical and fundamental analysis🔥, here is our master plan to heist the GBP/USD "The Cable" Forex market. Please adhere to the strategy I've outlined in the chart, which emphasizes long entry. Our aim is the high-risk Red Zone. Risky level, overbought market, consolidation, trend reversal, trap at the level where traders and bearish robbers are stronger. 🏆💸Be wealthy and safe trade.💪🏆🎉
Entry 📈 : "The vault is wide open! Swipe the Bullish loot at any price - the heist is on!
however I advise placing Buy limit orders within a 15 or 30 minute timeframe. Entry from the most recent or closest low or high level should be in retest.
Stop Loss 🛑: Thief SL placed at 1.22500 (swing Trade) Using the 2H period, the recent / nearest low level.
SL is based on your risk of the trade, lot size and how many multiple orders you have to take.
Target 🎯: 1.6700 (or) Escape Before the Target
Scalpers, take note 👀 : only scalp on the Long side. If you have a lot of money, you can go straight away; if not, you can join swing traders and carry out the robbery plan. Use trailing SL to safeguard your money 💰.
📰🗞️Fundamental, Macro, COT, Sentimental Outlook:
GBP/USD "The Cable" Forex Market market is currently experiencing a bullish trend,., driven by several key factors.
📊 Fundamental Analysis
The British government's upcoming budget may introduce a "more flexible fiscal policy," boosting GDP by 0.5% in 2025/26, according to Pantheon Macroeconomics . This could lead to higher interest rates and support the pound.
📊 Macroeconomics
The UK's economic growth is expected to slow down, but the Bank of England may maintain higher interest rates to control inflation. This could impact the GBP/USD pair
📊 COT Report
The latest COT report shows that large speculators have increased their net long positions in the GBP/USD pair, indicating a bullish sentiment
📊 Market Sentiment
The market sentiment for GBP/USD is currently bullish, with 60% of traders expecting a rise in prices. However, some analysts warn that the pair may be overbought
📊 Institutional and Retail Banks Positioning
Institutional traders are currently net long on GBP/USD, while retail traders are net short. This divergence in positioning could lead to a potential bullish move in the pair.
📊 GBP/USD Trader Sentiment
- Bullish Traders: 62% (Institutional: 70%, Retail: 55%)
- Bearish Traders: 31% (Institutional: 20%, Retail: 40%)
- Neutral Traders: 7% (Institutional: 10%, Retail: 5%)
📊 Positioning
- Institutional Traders: Net Long (Ratio: 2.5:1)
- Retail Traders: Net Short (Ratio: 1.2:1)
- Leverage: Average leverage used by traders is 10:1
📊 Market Sentiment Indicators
- SWFX Sentiment Index: 1.23 (Bullish)
- OANDA Sentiment Tool: 61% Bullish, 39% Bearish
- FX Blue Trader Sentiment: 60% Bullish, 40% Bearish
Please note that these numbers are subject to change and might not reflect the current market situation. Always conduct thorough research and analysis before making any trading decisions.
Overall Outlook
Based on the analysis, the GBP/USD pair is expected to move in a bullish trend, with a 60% chance of an uptrend and a 40% chance of a downtrend. However, it's essential to monitor market news and events, as they can impact the pair's direction
⚠️Trading Alert : News Releases and Position Management 📰 🗞️ 🚫🚏
As a reminder, news releases can have a significant impact on market prices and volatility. To minimize potential losses and protect your running positions,
we recommend the following:
Avoid taking new trades during news releases
Use trailing stop-loss orders to protect your running positions and lock in profits
📌Please note that this is a general analysis and not personalized investment advice. It's essential to consider your own risk tolerance and market analysis before making any investment decisions.
📌Keep in mind that these factors can change rapidly, and it's essential to stay up-to-date with market developments and adjust your analysis accordingly.
💖Supporting our robbery plan will enable us to effortlessly make and steal money 💰💵 Tell your friends, Colleagues and family to follow, like, and share. Boost the strength of our robbery team. Every day in this market make money with ease by using the Thief Trading Style.🏆💪🤝❤️🎉🚀
I'll see you soon with another heist plan, so stay tuned 🫂

GBP/USD Longs from 1.2700 for another potential rally.This week, I expect GBP/USD to continue its bullish trend. I’ve identified 5-hour and 4-hour demand zones as key areas where I anticipate a retracement. In these zones, I’ll be watching for potential Wyckoff accumulation, signaling the continuation of the uptrend. Once price reaches these demand zones, I’ll wait for further confirmations before entering any trades.
If the price continues rising without retracing, I’ll consider potential sells around the newly created 2-hour supply zone, though its validity isn’t strong. My decision will depend on how well the lower timeframe execution model develops in that area.
Confluences for GBP/USD Buys:
- Bullish Momentum: The pair has been in an uptrend for the past two weeks.
- Liquidity Above: There’s still a significant amount of upside liquidity to be taken.
- Weekly Supply Zone Mitigation: Price has reacted and moved away from a major weekly supply zone.
- Demand Zone: A clean demand area below suggests a likely retracement point for price.
Note: As we approach mid-December, I expect market volume to decrease due to the upcoming holidays, which could lead to slower price movements. This is worth considering when planning entries and exits.

GBPUSD "The Cable" Forex Market Heist Plan on Bullish SideHello!! My Dear Robbers / Money Makers & Losers, 🤑 💰
This is our master plan to Heist GBPUSD "The Cable" Forex Market based on Thief Trading style Technical Analysis.. kindly please follow the plan I have mentioned in the chart focus on Long entry. Our target is Red Zone that is High risk Dangerous level, market is overbought / Consolidation / Trend Reversal / Trap at the level Bearish Robbers / Traders gain the strength. Be safe and be careful and Be rich.
Entry 📈 : Can be taken Anywhere, What I suggest you to Place Buy Limit Orders in 15mins Timeframe Recent / Nearest Low Point take entry should be in pullback.
Stop Loss 🛑 : Recent Swing Low using 2H timeframe
Attention for Scalpers : Focus to scalp only on Long side, If you've got a lot of money you can get out right away otherwise you can join with a swing trade robbers and continue the heist plan, Use Trailing SL to protect our money 💰.
Warning : Fundamental Analysis news 📰 🗞️ comes against our robbery plan. our plan will be ruined smash the Stop Loss 🚫🚏. Don't Enter the market at the news update.
Loot and escape on the target 🎯 Swing Traders Plz Book the partial sum of money and wait for next breakout of dynamic level / Order block, Once it is cleared we can continue our heist plan to next new target.
💖Support our Robbery plan we can easily make money & take money 💰💵 Follow, Like & Share with your friends and Lovers. Make our Robbery Team Very Strong Join Ur hands with US. Loot Everything in this market everyday make money easily with Thief Trading Style.
Stay tuned with me and see you again with another Heist Plan..... 🫂

Will the Pound Show a Slight Bullish Bias Today? (15/10/2024)The GBPUSD pair is expected to display a slight bullish bias today, 15/10/2024, based on the latest fundamental factors and market conditions. Traders and investors are closely watching the movements in the British pound against the U.S. dollar, as the market sentiment shifts amid key macroeconomic events. Here’s a breakdown of the key drivers supporting this outlook:
1. UK Economic Data: CPI Expectations
The UK inflation report, which is set to be released later this week, is on the radar for traders. Early forecasts indicate that inflation may remain slightly elevated, reinforcing expectations that the Bank of England (BoE) will maintain its hawkish stance on interest rates. This anticipation tends to lend strength to the pound, as higher interest rates make a currency more attractive to investors seeking better yields.
In recent months, the BoE has been steadfast in its approach to combating inflation, a stance that has provided support for the British pound, making GBPUSD sensitive to any inflation-related news. With inflation still a concern, a bullish bias for the pound can be justified, particularly in the lead-up to the CPI report.
2. US Dollar Softness: Lower Treasury Yields
On the U.S. side, the U.S. dollar (USD) has seen some softness due to declining Treasury yields and mixed signals from the Federal Reserve regarding the future of interest rates. Last week’s economic data pointed to potential cooling in the U.S. labor market and lower inflationary pressures, which have reduced the market's expectations for further rate hikes in 2024.
With the Federal Reserve signaling that it may be nearing the end of its aggressive rate hike cycle, the U.S. dollar’s recent rally has stalled, giving room for pairs like GBPUSD to gain traction. This contributes to the bullish bias in the pair for today.
3. UK Political Stability and Brexit Sentiment
Another factor supporting the pound’s slight bullish stance is the current phase of relative political stability in the UK. After the volatile post-Brexit years, the UK government is focused on stabilizing the economy. Any developments or positive sentiment surrounding trade agreements with the EU or other major trading partners could further boost the pound's strength.
Brexit-related concerns have been less dominant recently, which has helped reduce the uncertainty that previously weighed on the pound. If this political calm continues, the GBPUSD pair could benefit from increased investor confidence in the pound.
4. Technical Analysis: Support at 1.2150
From a technical analysis perspective, the GBPUSD has found solid support around the 1.2150 level, which has held strong in recent trading sessions. As long as this support remains intact, the pair has the potential to make upward moves. Additionally, momentum indicators such as the RSI are showing signs of recovery from oversold conditions, hinting at a potential short-term bullish reversal.
If the pair manages to break above the 1.2200 resistance level, we could see further gains towards the next key resistance level of 1.2300.
5. Global Market Sentiment
In the broader market context, risk sentiment is playing a significant role in driving currency movements. If global markets continue to show risk-on sentiment, with equity markets rising and risk assets in favor, the British pound could see additional support against the U.S. dollar.
Given the factors of strong inflation expectations in the UK, a softer U.S. dollar, and a technical setup that supports higher prices, the GBPUSD may be positioned for slight bullish movement today.
Conclusion
In conclusion, today’s GBPUSD outlook points towards a slightly bullish bias . While the U.S. dollar continues to show signs of weakness amid lower Treasury yields and potential pauses in the Federal Reserve’s rate hikes, the British pound is drawing strength from expected higher inflation in the UK, the BoE’s hawkish stance, and a generally stable political environment. Traders should watch the upcoming inflation data and key resistance levels to confirm this bullish trend.
Keywords for SEO:
GBPUSD forecast,
GBPUSD analysis,
GBPUSD today,
British Pound outlook,
GBPUSD bullish,
UK inflation report,
Federal Reserve,
GBPUSD technical analysis,
Bank of England,
Treasury yields,
Brexit sentiment,
Forex trading,
GBPUSD trend 15/10/2024,
GBPUSD prediction,
Forex market news,
currency trading

GBPUSD Analysis: Slightly Bullish Bias on 08/10/2024.In today's analysis of the GBPUSD pair, we anticipate a slightly bullish bias driven by a combination of fundamental and technical factors. As we move through the trading session on 08/10/2024, traders are closely monitoring key economic releases and geopolitical developments that are expected to influence market sentiment. Let’s explore the primary drivers behind this expected bullish movement.
Key Fundamental Drivers
1. Hawkish Sentiment from the Bank of England (BoE)
The recent comments from the Bank of England (BoE) officials have been hawkish, signaling that further rate hikes could be on the horizon to combat inflation. With UK inflation remaining above target levels, the BoE's focus on tightening monetary policy to bring it down is a key factor supporting the British Pound (GBP). The market is pricing in the possibility of at least one more rate hike in the near future, which adds upward pressure on GBPUSD.
2. US Dollar Weakness Amid Softening Data
The US Dollar (USD) has been showing signs of weakness as recent economic data from the US indicates a slowdown in key sectors, particularly the labor market and consumer spending. The Non-Farm Payrolls report released last week missed expectations, leading to speculation that the Federal Reserve may pause rate hikes sooner than anticipated. This dovish sentiment surrounding the Fed provides a tailwind for GBPUSD, as a weaker USD makes the pair more attractive for buyers.
3. Political Stability in the UK
Political stability in the UK, especially in comparison to the uncertainties in the US, has helped maintain investor confidence in the British Pound. The UK government’s recent fiscal policy announcements have been well-received by markets, with investors expecting that these measures will support economic growth, adding strength to GBP in the short term.
4. UK Economic Data
Today’s release of the UK’s GDP data will be crucial in setting the tone for GBPUSD. Positive GDP growth figures are expected to fuel further optimism around the British economy, reinforcing the bullish momentum for the Pound. Additionally, the services sector PMI data coming in stronger than forecasted last week suggests that the UK economy is performing better than many of its European counterparts.
Technical Outlook
From a technical perspective, GBPUSD is trading above its 50-day moving average, which is a bullish signal. The pair is also hovering near a key support level of 1.2150, and as long as this level holds, we could see further upside potential. RSI indicators also suggest that the pair is not yet overbought, leaving room for additional gains throughout the trading day.
Key Levels to Watch:
- Support Level: 1.2150
- Resistance Level: 1.2275
A break above the 1.2275 resistance level could signal further upward momentum, pushing GBPUSD towards 1.2300 in the near term.
Conclusion: Slightly Bullish Bias for GBPUSD
In conclusion, based on today’s fundamental factors and market conditions, we anticipate a slightly bullish bias for GBPUSD. With hawkish sentiment from the BoE, weakening USD, and positive economic data from the UK, traders can expect the pair to inch higher as the day progresses. Keeping an eye on key levels and economic releases will be crucial for capturing potential trading opportunities.
Keywords:
GBPUSD, GBPUSD analysis, GBPUSD trading, GBPUSD forecast, Bank of England, GBPUSD bullish, UK inflation, US Dollar weakness, forex trading, GBPUSD technical analysis, GBPUSD support levels, GBPUSD resistance levels, GBPUSD 08/10/2024, GBPUSD outlook, forex trading ideas, forex strategy, forex market analysis, forex trader

GBP/USD Longs from 1.2700 back up to supplyI'm eyeing a long opportunity for GU at the 5-hour demand zone around 1.2700. The price has changed character to the upside, leaving a clean, unmitigated demand zone with a small imbalance above.
While price might dip into a supply zone or move up to mitigate the 22-hour supply zone for a potential sell-off, I’m more inclined to see it return to the demand level for a possible buy, targeting the Asia high and liquidity above.
Confluences for GU Buys:
- Price shifted to the upside, leaving a clean 5-hour demand zone.
- Imbalance above the demand zone that needs filling.
- Significant liquidity above, including the Asia high and trend line.
- Bearish pressure seems to be weakening.
P.S. If price breaks the demand zone, it will confirm a stronger bearish trend, and I’ll wait for a new supply zone to join the trend.
Have a great trading week, everyone!

GBPUSD Short Term Buy IdeaH4 - Bullish trend pattern
Currently it looks like a pullback is happening
Until the two strong support zones hold my short term view remains bullish here.

April 29 Weekly Outlook: DXY & GBPUSD High-Impact News Week!!!Greetings Traders,
This week promises significant market movement with a series of high-impact news releases, including the Non-Farm Employment Change and the Unemployment Rate among others. In this video, we'll delve into what to expect in DXY and GBPUSD trading, recognizing that such weeks often exhibit manipulative or accumulative behavior. It's crucial to approach analysis with precision and critical thinking, which I've aimed to provide in this video.
Stay tuned for updates throughout the week.
Best Regards,
The_Architect

GBPUSD: False Break Prompts Bullish MomentumCurrently, GBPUSD has exhibited a false break of structure, commonly known as Turtle Soup, suggesting a potential bullish draw towards the daily Fair Value Gap (FVG) . Price has retested an m15 bullish order block, indicating a possible bullish continuation.
Alternatively, price may reach the H1 Order block, where a confirmation entry can be sought for a buy opportunity.
Please note that I will be closing my trade at 12 PM NY Time as I cease trading for the day.
Kind Regards,
The_Architect

GBPUSD Longs from 1.24000 up towards 1.25500This week, my bias for GBPUSD is to pursue buying opportunities to address significant imbalances above and to target the recent supply zone. Given the proximity of price to my 10-hour demand zone, I anticipate a temporary bullish move toward the supply area. With price currently exhibiting slower movement, I'll wait for an accumulation phase to develop before entering buy positions.
Once in buys, I aim to drive price up toward the 18-hour supply zone, where I'll consider selling positions to capitalize on the pronounced bearish trend. While the trend is strongly bearish at present, I expect a pullback to occur before initiating any actions in line with this strategy.
Confluences for GU Buys are as follows:
- Price left so many imbalances above that need to be filled.
- In order for price to continue the bearish trend price must pullback up
- Approaching a really nice 10hr demand that has caused a BOS to the upside.
- DXY is also near a good supply zone so could expect the dollar to drop a bit this week.
P.S. If price breaks below the 10-hour demand zone, which I anticipate holding, there is a robust daily demand level below that. However, if this scenario does not materialize, I will simply wait for a pullback to consider potential selling opportunities.
Have a great trading week ahead guys!

GBPUSD: Shift to Bullish Order Flow (CPI High Impact News)GBPUSD has recently shifted to a bullish institutional order flow, prompting us to identify key areas of interest conducive to the bullish bias . Currently, we're observing a mitigation block situated at premium prices , serving as an initial entry point for our bullish trajectory. Alternatively, should the premium point not materialize, we await a dip into the discount sell stops , offering viable buying opportunities post-confirmation.
This bullish sentiment is reinforced by a low resistance liquidity zone, strategically positioning us to capitalize on favorable trading conditions. By aligning our strategies with areas of low resistance, we enhance our chances of success in navigating the market dynamics.
Today, we're also expecting the CPI News release , which may inject high volatility into the market , potentially favoring bullish movements . Stay tuned for updates.
Please watch my GBPUSD analysis from long-term to short-term below.
Kind Regards,
The_Architect

GBPUSD: Exploring Buy OpportunitiesCurrently, I'm observing a continuation of bullish institutional order flow , particularly towards the H1 Buy Stops , which serves as our Draw On Liquidity . Price action is positioned at a crucial juncture, resting upon a significant H1 Bullish Order Block , aligned with a reclaimed order block — an institutional support zone.
In this scenario, I anticipate this area to serve as a stronghold as we persist in our pursuit of a bullish trajectory.
Furthermore, below the current price action lies a compelling H4 Bullish Order Block, characterized by a Liquidity Void. Should price action gravitate towards this zone, I'll be vigilant for a confirmation entry, signaling potential buying opportunities.
Stay tuned for further updates and analysis.
Kind Regards,
The_Architect

GBPUSD: Pending Buy Order at H1 Bullish Order BlockAt the moment, I have initiated a pending buy order at the H1 Bullish Order Block . My anticipation is to enter buy positions aiming to reach the Daily Fair Value Gap (FVG), which serves as my Draw On Liquidity . The institutional order flow on GBPUSD currently indicates a bullish sentiment , and I intend to align with this narrative.
Stay tuned for further updates.
Kind Regards,
The_Architect

GBPUSD - Looking To Buy Pullbacks In The Short TermH1 - Strong bullish momentum.
Higher highs.
No opposite signs.
Until the strong support zone holds I expect the price to move higher further after pullbacks.

Bullish Outlook on GBPUSD - 3rd NovemberOn the H4 timeframe, price has broken above upside confirmation level of 1.2280, which could see a throwback to the key support level at 1.2190, which coincides with the 61.8% Fibonacci Retracement. A throwback to this zone could send prices higher towards next key resistance level at 1.2320, which is in line with the 161.8% Fibonacci extension. Price is hovering above the Ichimoku cloud and 20 EMA, supporting bullish bias.

GBPUSD BullishOn Thursday, DXY was become stronger and put GBPUSD down, but If you look on the chart, we can see huge Bearish candle which is abnormal as compared to another candle. I believe GBPUSD may rise more. Every support is an opportunity to buy.
