GBPUSD Long FlipAfter previously posting a short trade and stating a break of 1.376 on the 4 hour would result in a change of bias we have now moved to long a long position. Adaptability in this industry is key. Our short losses have already been covered and everything onwards is profit.
Follow for more analysis.
Gbpusdbuy

GBP/USD Correction Offers Another Long OpportunityThe GBP is correcting across most pairs, this offers the chance to add long positions or enter longs if not already in them. I marked out 1.37948 on this previously as a possible area of resistance and it has pulled back just short of here. I have marked out the lower trendline as the area to look to add long positions. I expect the downward move to slow down now so I do not think it will drop further than the previous low of 1.35200 (marked by orange dot), but we need to wait for confirmation before entering more longs.
My TP has not changed from the previous idea - 1.40

buy GBPUSDBuy GBPUSD based on
1: bounce of a major key level
2: double bottom formation
3: RSI divergence

GBP/USD BUY IDEAHey tradomaniacs,
welcome to another free trading-setup.
Notice: This is mean to be a preparation for you! as always we will have to wait for a confirmation!
GBP/USD: Daytrade-Preparation
Market-Buy: 1,36590
Stop-Loss: 1,36270
Point Of Risk-Reduction: 1,36850
Take-Profit: 1,37300
Stop-Loss: 32 pips
Risk: 0,5% - 1%
Risk-Reward: 2,20
LEAVE A LIKE AND A COMMENT - I appreciate every support! =)
Peace and good trades
Irasor
Wanna see more? Don`t forget to follow me!

GBPUSD Long IdeaGBPUSD Long Idea
you should note that entering this trade should be after the price closing above 1.3678 in 30 minutes time frame

GBPUSD Close to Break Resistance 1.3700Hi Traders,
I am waiting that price can make new uptrend and break this level soon. If this will happen we can open long position targeting to 1.38500


GBPUSD - SWING - 18. JANU. 2021Welcome to our weekly trade setup ( GBPUSD )!
-
1 HOUR
Bearish price action from previous highs.
4 HOUR
Broke above main sr level, expecting more upside!
DAILY
Overall sideways waving market structure.
-
FOREX SWING
BUY GBPUSD
ENTRY LEVEL @ 1.35520
SL @ 1.34650
TP @ 1.36810
Max Risk: 0.5% - 1%!
(Remember to add a few pips to all levels - different Brokers!)
Leave us a comment or like to keep our content for free and alive.
Have a great week everyone!
ALAN

gbpusdsince the start of january gbpusd is moving on this 250 pips range .
im waiting for buys in gbpusd , these 2 demand zones are perfect zones to enter.

GBPUSD Break and retest was expected around .618 FibonacciGBPUSD
*********
⏳1 Hour chart
🎲 Possible entry analysis
⛳️ Possible bull/bear target
📚Educational
—————-❇️——————-
Detailed analysis 💬
1️⃣ Negative USD-Positive brexit talks will boost this pair upwards
2️⃣ GBPUSD Has break the downward channel
3️⃣ 1.37000 acting as strong resistance level
4️⃣ 1.37000 Major upper side resistance Key reversal area
5️⃣ 1.36100 acting as key support .618 Fibonacci
6️⃣ 02 nd Sub micro Elliot wave is formed
7️⃣ Technical support - Bull
8️⃣1.37700 will acted as key reversal-bearish
9️⃣ Series of HH HL HH HL patterns
🔟 Possible swing target-1.37700 (1.217 Fibonacci)
#️⃣ Overall bullish trend (Brexit optimism)
—————-❇️——————-
📉 Technical bias-H4-Bullish
Price is above 50,100,200 Exponential moving average
50 Exponential moving average will act as support-Bull
Ichimoku cloud -cloud is still green-Cloud support(Bull)
Bollinger band- Price reached around lower band and short term pullback was expected
Relative strength index - Reached around 40-Medium term bearish correction was expected
MACD -Turned red and fell below the signal line ,oscillators about to cross soon
Stochastic - Reached around 40- Oscillators are pointing upward
—————-✳️——————-
Key reversal area's
1.36000 psychological level
1.37000 January high
1.37500 Key reversal area/psychological level
1.360950 61.8% Fibonacci retracement level
1.35770 50% Fibonacci retracement level
1.35400 series of support level
1.35400 Price action level/Possible entry- Bull
1.37700 1.217 Fibonacci/Alternative bearish entry
—————-✳️——————-
Bullish entry #pound #gbpusd
Entry price - 1.36100
Take profit 01 - 1.37000
Take profit 02 - 1.37700
🚫 Stop lose 1.35830
⬆️ 1.19% Growth expected
⤴️ Account growth 0.19: 1.19
✅ Risk reward ratio 1 : 6.2
—————-⚜️——————-
Push the like button , And cheer up if you found useful


GBPUSD - SWING - 12. JANU. 2021Welcome to our weekly trade setup ( GBPUSD )!
-
1 HOUR
Very bullish price action and pressure.
4 HOUR
Closure above main sr level, expecting more upside now.
DAILY
Overall bullish waving market structure, good long entries!
-
FOREX SWING
BUY GBPUSD
ENTRY LEVEL @ 1.35970
SL @ 1.35420
TP @ 1.36840
Max Risk: 0.5% - 1%!
(Remember to add a few pips to all levels - different Brokers!)
Leave us a comment or like to keep our content for free and alive.
Have a great week everyone!
ALAN

GBPUSDBUY setup for gbpusp price is at 50% retracement of the higher high , am looking to Go Long on this pair

GBPUSD Long OpportunityGU is looking bullish, with the dollar continuing to weaken. Some retracement is happening but potentially looking for a rally in the long run.


GBPUSD - SWING - 22. DECE. 2020Welcome to our weekly trade setup ( GBPUSD )!
-
1 HOUR
Very bullish price action..
4 HOUR
Closed above main sr level.
DAILY
Overall bullish market about to rush towards previous highs!
-
FOREX SWING
BUY GBPUSD
ENTRY LEVEL @ 1.34200
SL @ 1.32980
TP @ 1.35850
Max Risk. 0.5% - 1%!
(Remember to add a few pips to all levels - different Brokers!)
Leave us a comment or like to keep our content for free and alive.
Have a great week everyone!
ALAN


GBPUSD - BUY OPPORTUNITYBUYING GBPUSD in BUY AREA and looking to close position in TARGET AREAS (+40 PIPS)
- TARGET AREA 1 - 40 PIPS
- TARGET AREA 2 - 90 PIPS
Trade at your own risk!!!


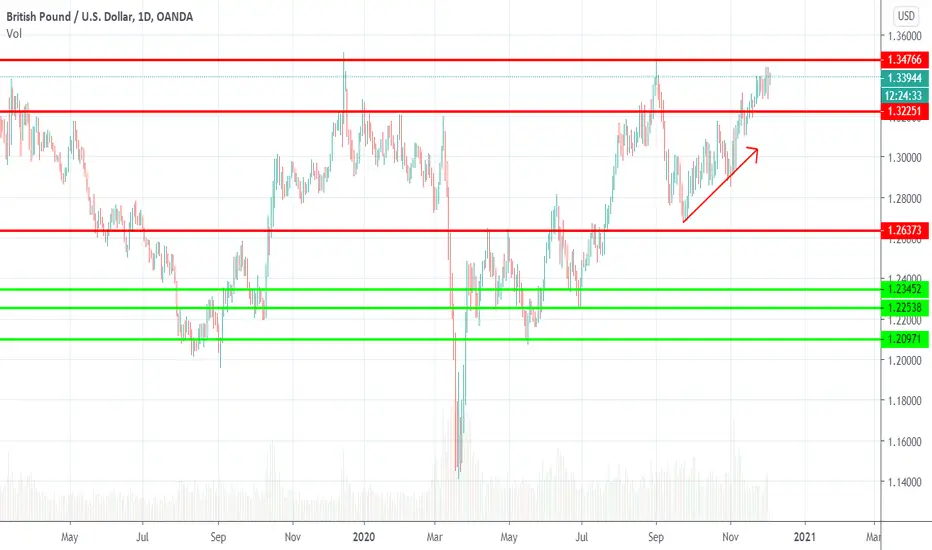
GbpUsd- to break or not to break?I've been bullish GbpUsd since it broke above 1.3 and I said that it can rise towards 1.35
Now the pair is trading at 1.34 or so and we may wonder if it will turn or break above?
Looking at price action in the past days Gbp seems very well bid and I believe a break up would occur for this pair.
Also looking at DXY weakness and the fact that FTSE can break resistance is probable that would be the case for GbpUsd also
Fron the technical point of view 1.3250 zone is support now and dips towards this zone should be bought for a swing trade and this anticipated break


GBPUSD Is trading within rising channel 1.34000 Key level aheadGBPUSD
*********
⏳1 Hour chart
🎲 Possible entry analysis
⛳️ Possible bull/bear target
📚Educational
—————-❇️——————-
Detailed analysis 💬
1️⃣ Negative USD-Positive brexit talks will boost this pair upwards
2️⃣GBPUSD was trading within broad rising channel
3️⃣ 1.32500 50% Fibonacci Acting as Dynamic support and resistance
4️⃣ 1.34000 Major upper side resistance Key reversal area
5️⃣ 1.33100 acting as key support and resistance level
6️⃣ 1.33150 78.6% Recent support level for Bull
7️⃣ Technical support - Bull
8️⃣1.34000 will acted as key reversal-bearish
9️⃣ Series of HH HL HH HL patterns
🔟 Possible swing target-1.34500 Upper side trendline resistance
#️⃣ Overall bullish trend-Within Broad rising channel pattern
—————-❇️——————-
📉 Technical bias-H4-Bullish
Price is above 50,100,200 Exponential moving average
50 Exponential moving average will act as support-Bull
Ichimoku cloud -cloud is still green-About to turn red Cloud support(Bull)
Bollinger band- Price reached around middle band is about to break out soon
Relative strength index - Reached around 50 neutral area 50- Will act as support for bullish trend
MACD -Turned red and fell below the signal line ,oscillators about to cross soon
Stochastic - Reached around 60- Oscillators are converging
—————-✳️——————-
Key reversal area's
1.33000 psychological level
1.33800 Today high
1.34000 Key reversal area/psychological level
1.33350 78.6% Fibonacci retracement level
1.32860 61.8% Fibonacci retracement level
1.32510 50% Fibonacci retracement level
1.32000 Major psychological level
1.33100 Price action level/Possible entry- Bull
1.34500 Trendline resistance/Alternative bearish entry
—————-✳️——————-
Bullish entry #pound #gbpusd
Entry price - 1.33200
Take profit 01 - 1.33800 (60 PIPS)
Take profit 02 - 1.34500 130 PIPS)
🚫 Stop lose 1.32800 (40 PIPS)
⬆️ 1% Growth expected
⤴️ Account growth .30: .98
✅ Risk reward ratio 1 : 3
—————-⚜️——————-
Push the like button , And cheer up if you found useful
