GBP/USD Buys from 1.34800 This week’s analysis focuses on capitalising on the strong bullish structure forming on GU. After a clear break of structure to the upside, price has been forming consistent higher highs and higher lows.
From this move, a key Point of Interest has been left around the 1.34800 level, which aligns with a clean 9H demand zone. As price now needs to retrace after the recent bullish push, this 9H zone becomes a likely area for accumulation and a potential continuation rally.
Confluences for GU Buys:
- GU has been very bullish overall on the higher timeframes
- The 9H demand zone caused the latest break of structure to the upside
- There’s plenty of liquidity and imbalance above that needs to be taken
- The DXY is moving bearish, supporting GU upside
P.S. If price pushes higher before retracing, it may enter a premium supply zone, where I’ll be watching for any significant reaction. Either way, patience is key — don’t hesitate to wait for your setup to fully form.
Wishing you a focused and profitable trading week!
Gbpusdlong
GBPUSD Trading Analysis ### 1. Overall Trend & Market Context
- Bullish Momentum: GBPUSD is in a strong bullish trend, driven by DXY weakness (U.S. Dollar Index declining) and GBP strength. Key factors include:
- Fundamental Drivers:
- UK manufacturing contraction (less severe than expected) and rising housing prices.
- U.S. dollar weakness due to manufacturing slowdown (ISM PMI at 48.5), trade tensions, and fiscal concerns.
- Fed policy uncertainty (rates likely to remain unchanged post-May cut).
- Technical Drivers: Higher lows and higher highs on the 4-hour chart, indicating trend continuation.
### 2. Key Technical Levels & Patterns
- Support Zones:
- 1.3490–1.3500: A critical support area (pullback retracement, 61.8% Fibonacci level).
- 1.34420: Stop-loss level for long positions (below the liquidity pocket).
- Resistance Levels:
- 1.3580: Target for bullish breakout.
- 1.37370: Next major resistance (1:2 risk-reward setup).
- Patterns:
- Bullish Flag: Breakout above key resistance (1.3430) followed by consolidation.
- Broadening Wedge: High volatility pattern with widening highs/lows; potential for breakout (bullish or bearish).
- Bullish Engulfing: Confirmed entry after breaking key support/resistance.
### 3. Trading Opportunities
- Buy Zones:
- 1.3490–1.3500: Entry on breakout from consolidation range (1.3500).
- 1.35260: Buy limit for a liquidity hunt below minor intraday lows.
- Take Profit:
- 1.3580 (first resistance) and 1.37370 (measured move target).
- Risk Management:
- Stop-loss at 1.34420 (below support).
- 1:2 risk-reward ratio for long positions.
### 4. Key Risks & Considerations
- Bearish Scenarios:
- Failure to hold above the breakout zone (1.3500).
- Pressure from resistance at 1.3580.
- Return to consolidation range, delaying the upside move.
- Volatility: Broadening wedge patterns may fake out traders, emphasizing the need for strict risk management.
### 5. Fundamental Outlook
- GBP Strength: UK economic data (housing, manufacturing) supports GBP.
- USD Weakness: U.S. manufacturing slowdown, trade tensions, and fiscal concerns weigh on the dollar.
- Fed Policy: Markets expect rate cuts to continue, further pressuring USD.
### 6. Final Notes & Disclaimers
Stay disciplined, manage risk, and let the market confirm your trades. 📈
*Disclaimer: This is for educational purposes only. Trading involves risk; ensure you understand the risks before trading.*

GBPUSD(20250604)Today's AnalysisMarket news:
Fed Logan: We should focus on achieving the 2% inflation target rather than trying to make up for past inflation shortfalls; Bostic: We still think there may be a rate cut this year.
Technical analysis:
Today's buying and selling boundaries:
1.3521
Support and resistance levels:
1.3588
1.3563
1.3547
1.3496
1.3480
1.3455
Trading strategy:
If the price breaks through 1.3547, consider buying, with the first target price at 1.3563
If the price breaks through 1.3521, consider selling, with the first target price at 1.3496

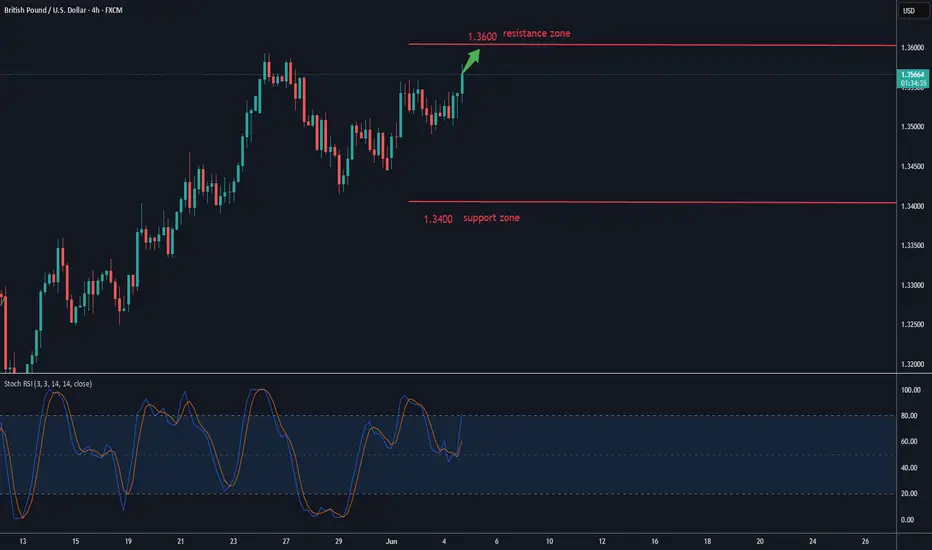
Can it break through 1.36?The GBP/USD exchange rate continued to trade in a high-range consolidation during the North American session, currently hovering near the 1.353 level with a slight intraday rebound. The US Dollar Index turned lower following the release of weak ADP employment data, providing some support for the British Pound. The US added only 37,000 jobs in the private sector in May, far below the market expectation of 115,000, reinforcing market bets on future Federal Reserve rate cuts. In the short term, the exchange rate may continue to consolidate within the range of 1.3450 to 1.3600. If the US non-farm payroll data remains weak, the exchange rate is expected to break above the 1.3600 level, opening up further upside potential.
Humans need to breathe, and perfect trading is like breathing—maintaining flexibility without needing to trade every market swing. The secret to profitable trading lies in implementing simple rules: repeating simple tasks consistently and enforcing them strictly over the long term.
EURUSD and GBPUSD Breakout?Hello traders, this is a complete multiple timeframe analysis of this pair. We see could find significant trading opportunities as per analysis upon price action confirmation we may take this trade. Smash the like button if you find value in this analysis and drop a comment if you have any questions or let me know which pair to cover in my next analysis.

Consolidation ahead of the next bullish rallyThe GBP/USD exchange rate has edged lower below the three-year high of 1.3592 set in May. To sustain the upward momentum, prices need to decisively close above the resistance line of 1.3597 since July 2023 (which capped gains last week). A breakthrough above the key resistance zone of 1.3658 could trigger a stronger rally, targeting the 2022 high of 1.3747. Further breakthroughs may shift market focus to the upward trendline (around 1.3865). Technically, short-term risks remain biased to the upside, supported by the rebound of the stochastic oscillator.
Humans need to breathe, and perfect trading is like breathing—maintaining flexibility without needing to trade every market swing. The secret to profitable trading lies in implementing simple rules: repeating simple tasks consistently and enforcing them strictly over the long term.
Trading Strategy:
buy@1.3490-1.3500
TP:1.3550-1.3600

EUR USD Trade Setup 1 hour timeframe EUR USD Trade Setup 1 hour timeframe
EUR USD has formed a Bullish Break and Retest pattern on the 1 hour timeframe and the price is currently at the retest level.
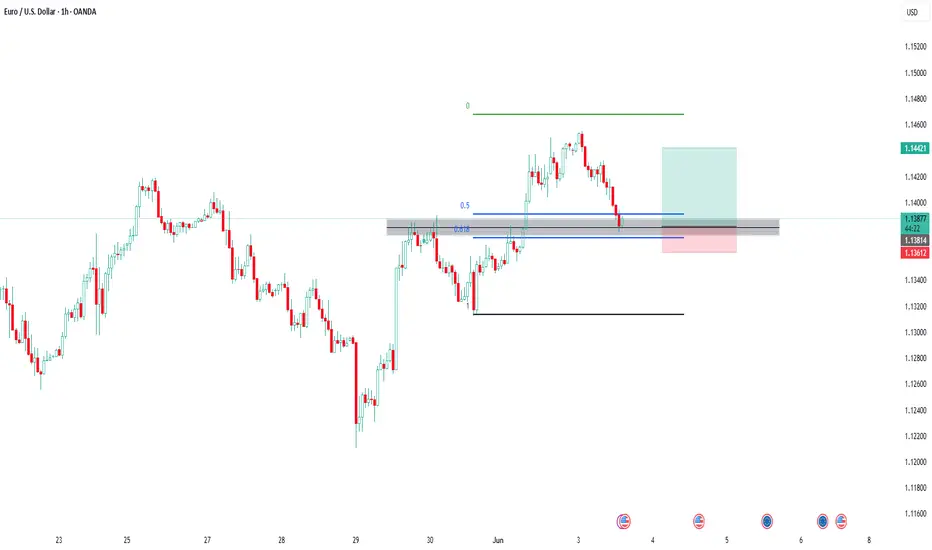
The current trend of the US dollar remains bullish.During the European session, the US Dollar Index extended its weakness, falling 0.67% intraday to 98.7731, approaching the low seen on April 22nd. GBP/USD rose synchronously by 0.61% to 1.3538.
Key Drivers:
Tariff rhetoric reignites market concerns
Potential impact of the S899 clause
Diverging expectations on Federal Reserve policy
ING analyst Chris Turner noted: "The risk of early termination of the trade agreement and the S899 clause have created dual pressures, causing the US dollar to continue weakening. GBP/USD is likely to remain bullish-dominated."
Humans need to breathe, and perfect trading is like breathing—maintaining flexibility without needing to trade every market swing. The secret to profitable trading lies in implementing simple rules: repeating simple tasks consistently and enforcing them strictly over the long term.
Trading Strategy:
buy@1.13400-1.13450
TP:1.13550-1.13600

GBP/USD Bullish Channel Holding–Pullback Before the Next Leg Up?This is a 4-hour chart of the British Pound vs US Dollar (GBP/USD) from FXCM, showing a strong bullish market structure within a rising parallel channel.
🔍 Key Technical Insights:
Uptrend Channel: Price has been consistently making higher highs and higher lows within a well-defined ascending channel.
Support Zones: Three horizontal levels are marked at 1.348, 1.333, and 1.326 — likely acting as short-term demand zones or reaction points.
Projection Path (Red Line): A pullback into the lower part of the channel (likely near 1.333–1.326 zone) is anticipated, followed by a bullish continuation toward the upper channel resistance.
🧭 Market Outlook:
Bias: Bullish while above channel support.
Buy Area: Ideal long setup may develop around the 1.333–1.326 support region.
Target Zone: Potential continuation toward 1.410+ if the structure holds.
This chart favors trend continuation after a correction, aligning with smart money accumulation and institutional flow behavior within a bullish channel.

Fundamental Market Analysis for May 29, 2025 GBPUSDEvent to pay attention today:
15:30 EET. USD - Initial jobless claims
22:00 EET. USD - Bank of England Governor Andrew Bailey will deliver a speech.
GBPUSD:
GBP/USD pared further gains on Wednesday, stumbling for the second session in a row and falling below 1.3500 after failing to regain 1.3600 earlier this week. Sterling markets are retreating from the upper limit of the bullish trend that lifted GBPUSD to multi-year highs, but the momentum remains favourable for sterling buyers.
The latest minutes of the Federal Reserve (Fed) interest rate meeting held on 6-7 May showed that the Fed's wait-and-see stance has deep roots. At the last Fed meeting, policymakers noted that the US dollar's (USD) status as a safe haven has suffered recently. They warned that a more ‘durable change’ in the dollar's status could have long-term consequences for the US economy.
Almost all FOMC members at the May rate meeting agreed that inflation risks could prove to be more ‘persistent than expected.’ Fed officials directly pointed to tariffs as a key factor in the FOMC's downgrade of its outlook for the US economy, and the FOMC blamed the Trump administration and its inconsistent tariff policy for the deterioration in the US economic situation and uncertain outlook for inflation and growth.
The rest of the trading week remains tense for the US. On Thursday, US gross domestic product (GDP) growth for the first quarter will be released. On Friday, the trading week will end with the release of US personal consumption expenditure (PCE) inflation data for April. Markets are hoping for a continued easing of key inflation indicators before the effects of the Trump administration's tariff policy begin to be reflected in the core data.
Trading recommendation: BUY 1.3450, SL 1.3430, TP 1.3540

LONG GBP/USD — Trade IdeaLONG GBP/USD — Three Talking Points
Macro & Central-Bank Divergence
UK growth beats, retail sales jump and service-CPI re-accelerates to 5.4 % y/y. Markets have pushed BoE-cut odds to near-zero for June and just one 25 bp trim by year-end, while the Fed is still priced for two cuts in 2025.
IMF nudges 2025 UK GDP up to 1.2 %. In contrast, the dollar narrative is hampered by ballooning U.S. deficit worries and tariff-policy whiplash. Net policy path favours sterling over the dollar.
Technical Structure Remains Bullish
Price action is riding a January-origin ascending channel; Monday’s spike to 1.3600 set a new three-year high, but the pull-back stalled exactly where the 21-DMA, prior breakout shelf and channel floor cluster (mid-1.34s).
14-day RSI ≥ 60 yet still shy of overbought, signalling bullish momentum with room to run.
Holding the 1.3440/70 zone keeps the next leg toward 1.3600/1.3750 in play; only a daily close below 1.3370 would break the channel and negate the setup.
Event Risk Favouring Upside Skew
BoE speakers (Pill today, Bailey tomorrow) are likely to echo the “cautious & gradual” line—supportive, not dovish.
FOMC minutes may sound hawkish, but the market has largely heard it; any dovish nuance quickly re-ignites dollar selling.
Friday’s PCE vs. Tokyo CPI: a soft U.S. core PCE print alongside sticky Japan inflation would weigh on USDJPY and bleed into broader USD softness, lifting cable toward our T1/T2 objectives.
GBP/USD Correction Potentially Complete – Key Breakout LevelsHi everyone,
GBP/USD has been undergoing a short-term correction since the start of the week. Our view is that this correction may now be complete, with the bullish trend potentially resuming.
For confirmation, we’re watching for a break above the 1.35195 level, followed by a move through 1.35934.
If these levels are cleared, we anticipate further upside. We’ll continue to share updates on the projected path for GBP/USD should price action reach our key zone.
The longer-term outlook remains bullish, and we expect the rally to extend further from the 1.20991 January low.
We’ll be keeping you updated throughout the week with how we’re managing our active ideas. Thanks again for all the likes/boosts, comments and follows — we appreciate the support!
All the best for the week ahead. Trade safe.
BluetonaFX

GBPUSD potential longMulti-Timeframe Market Outlook
3-Month (3M) Timeframe
• Price broke below key psychological/liquidity level at 1.2100 in Q3 2022, reaching 1.0500, where significant bullish order flow was triggered.
• Bullish momentum brought price back above 1.2100, but lacked strength to reach next liquidity zone at 1.3900.
• After retracing to collect orders at 1.2100 again, price advanced to 1.3400, met resistance, and returned to 1.2100.
• Recent price action shows a break above 1.3400, signaling renewed bullish intent and momentum toward higher targets.
Monthly Timeframe
• Fully aligned with the 3M structure; no additional significant divergences to note.
• Continuation of higher timeframe bullish structure remains intact.
Weekly Timeframe
• Last week, price broke and closed above major resistance at 1.3400 with strong bullish momentum.
• Next liquidity target: 1.3650.
• Price consolidated below 1.3400 for 4 weeks, suggesting accumulation of bullish orders.
• Current retracement likely a pause to collect more orders before resuming towards 1.3650.
Daily Timeframe
• Strong order flow observed at 1.3150, followed by consolidation between 1.3250 – 1.3300 before breaking 1.3400.
• Price has retraced ~100 pips since yesterday, likely seeking a liquidity zone.
• 1.3400 remains the key level to monitor for renewed bullish interest and continuation toward 1.3650.
4H Timeframe
• Notable bullish order block formed at 1.3400, resulting in nearly 200-pip upside.
• Price appears to be retracing to this region, likely to collect more buy-side liquidity before another leg up.
• Confluence across timeframes suggests strong bullish bias if price holds above or reclaims 1.3400.
My thesis is long but I am very mindful of FOMC minutes today and I am waiting to see the impact that it will have on price action.

GBPUSD Near Key Resistance – Watching for PullbackGBPUSD has surged to test the 1.3538 resistance, forming a strong impulsive rally supported by higher lows and tight bullish consolidation patterns. However, price is now pressing into a major horizontal resistance and rising trendline, setting up for either continuation or correction.
Key Levels:
Major Resistance: 1.35389 (previous high, potential double top)
Trendline Support: ~1.3440 (ascending structure)
Downside Target (if break occurs): 1.3140 (range floor)
Scenarios to Watch:
🔹 Bearish Scenario (Primary Watch)
Price reacts to 1.3538 and forms a rejection candle
Break of the ascending trendline may trigger a retracement
Downside target zones:
1.3440 (initial structure)
1.3140 (major support zone)
🔹 Bullish Breakout (Alternate Scenario)
Clean break and close above 1.3538
Would invalidate short-term correction and open path to new highs
Momentum continuation possible toward 1.3600–1.3700
Pattern Notes:
Bullish structure with minor flags and wedges in the uptrend
But rally is extended and hitting overbought territory near resistance
RSI divergence or reversal patterns around this level would strengthen short case
Conclusion:
📌 GBPUSD is at a major resistance. Watch for rejection or breakout.
📌 If it holds below 1.3538 and breaks trendline, short setup is favored.
📌 If it breaks out above 1.3538 with volume, stay out of shorts and wait for retest.

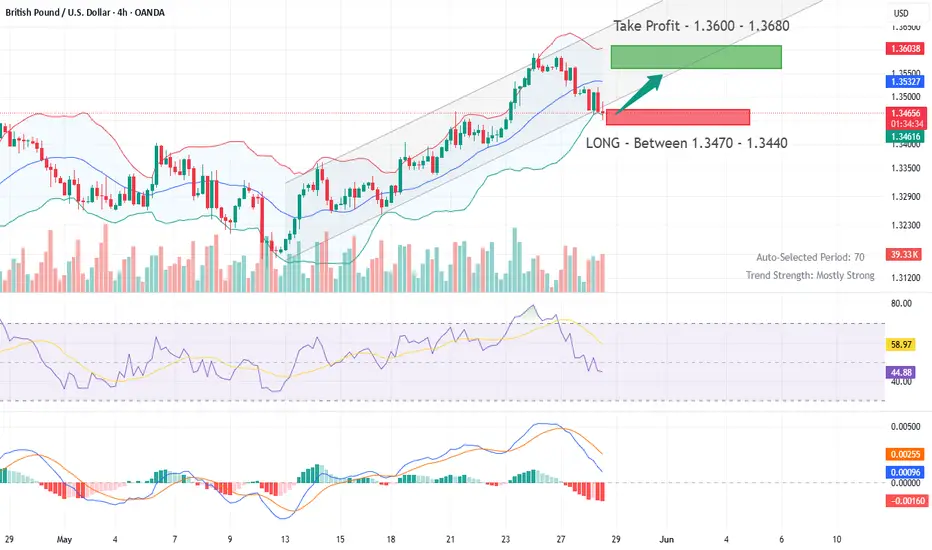
GBPUSD Trade IdeaThe GBPUSD pair is showing a strong bullish trend on the 4-hour chart. However, the price currently looks overextended. This suggests the market may be due for a corrective pullback.
I’m watching for a pullback into a discounted zone near the fair value gap.
If the price moves back into this zone, I’ll look for a bullish break of market structure as a signal to enter long.
This plan emphasizes patience and the importance of waiting for a favorable entry rather than chasing an extended move. As always, this is my personal strategy and not financial advice. Proper risk management and discretion are essential.

EURUSD,GBPUSD,AUDUSD and NZDUSD possible bounce?Hello traders, this is a complete multiple timeframe analysis of this pair. We see could find significant trading opportunities as per analysis upon price action confirmation we may take this trade. Smash the like button if you find value in this analysis and drop a comment if you have any questions or let me know which pair to cover in my next analysis.

Fundamental Market Analysis for May 26, 2025 GBPUSDGBPUSD:
The GBP/USD pair is building on last week's strong upward movement and gaining positive momentum during Monday's Asian session. This momentum is lifting spot prices above the 1.3550 level, to the highest level since February 2022, and is supported by a combination of factors.
The British Pound (GBP) continues to show relative outperformance on the back of Friday's favourable UK retail sales data, which showed that consumer spending remains a bright spot despite the gloomy economic outlook. This, along with higher-than-expected inflation in April, fuelled speculation that the Bank of England (BoE) will take a pause at its next meeting on 18 June and will not be in a rush to reduce borrowing costs further.
The US Dollar (USD), on the other hand, continues to struggle to attract meaningful buyers amid concerns that the tax and spending bill will increase the US budget deficit at a faster pace than previously expected. Furthermore, growing confidence that the Federal Reserve (Fed) will further cut interest rates in 2025 has driven the Dollar to near one-month lows and is fuelling positive movement in GBP/USD.
This week, investors will face the release of important US macroeconomic data, with the release of Durable Goods Orders data on Tuesday and preliminary GDP data on Thursday. These data, as well as the FOMC meeting minutes on Wednesday and the Personal Consumption Expenditure (PCE) price index on Friday, may provide insight into the prospects of a Fed rate cut, which will have an impact on the USD and GBP/USD.
Trading recommendation: BUY 1.3590, SL 1.3570, TP 1.3690

PERHAPS IT'S TIME TO STOP SHORTING GBPUSD LONG FORECAST W22 Y25PERHAPS IT'S TIME TO STOP SHORTING GBPUSD LONG FORECAST W22 Y25
Hey traders ✌️
welcome to your market analysis by FRGNT! 🙌
Professional Risk Managers👋
Welcome back to another FRGNT chart update📈
Diving into some Forex setups using predominantly higher time frame order blocks alongside confirmation breaks of structure.
Let’s see what price action is telling us today!
🔑 Remember, to participate in trading comes always with a degree of risk, therefore as professional risk managers it remains vital that we stick to our risk management plan as well as our trading strategies.
💡Trade confluences provided during the week 📝
✅Bullish weekly close above recent highs & Orderblock
✅ Within Weekly Orderblock. Potential shorts after bearish price action.
📈The rest, we leave to the balance of probabilities.
💡Fail to plan. Plan to fail.
🏆It has always been that simple.
❤️Good luck with your trading journey, I shall see you at the very top.
🎯Trade consistent, FRGNT X

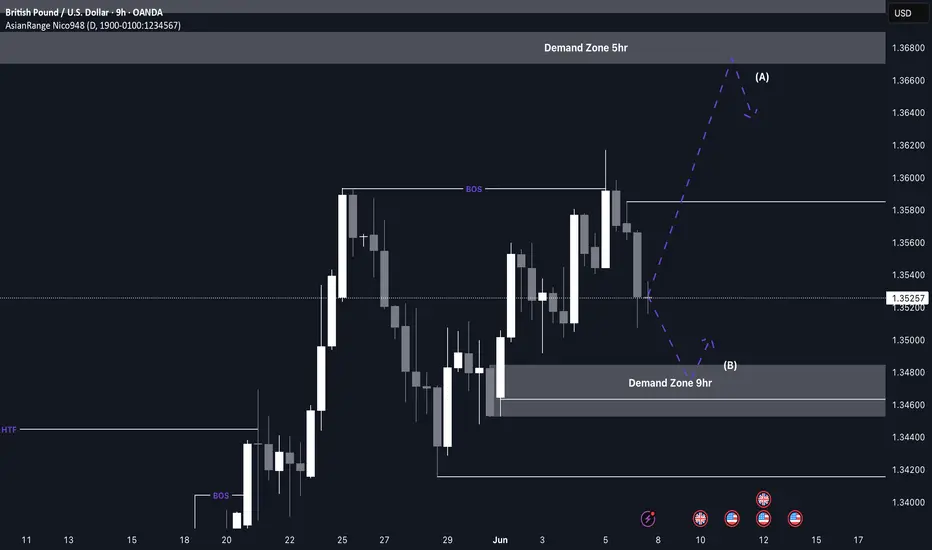
GBP/USD bullish run still going?This week’s analysis for GU is centred around the current pro-trend momentum and where we could see potential entries to continue riding it.
To begin with, there’s a refined 3D supply zone located at a premium level which could cause a short-term bearish reaction. I’ll be monitoring this area for any possible short setups — but only with strong confirmation.
However, the overall structure remains predominantly bullish, as shown by a series of higher highs and higher lows, along with significant breaks of structure. The most relevant point of interest for a bullish continuation sits around the 1.34200 level, where a clean 9H demand zone resides. This is where I’ll be looking to enter long positions if price retraces to that area.
Confluences for GU Buys:
- Clear formation of higher highs and higher lows, confirming bullish structure
- Strong 9H demand zone that initiated the recent break of structure
- Liquidity above still yet to be cleared
- DXY remains bearish, supporting continued bullish momentum on GBP/USD
P.S. Don’t get too caught up chasing countertrend moves. The real edge lies in identifying the nearest POI that aligns with the overall trend and waiting for your setup to unfold there.

GBPUSD Trend Analysis On The 4H Chart Profit SurgingThe GBPUSD currency pair, as observed on the 4-hour timeframe, is currently exhibiting signs of a potential bullish reversal, with a suggested entry near the 1.32696 price level. This analysis outlines retracement considerations, key target levels, and invalidation criteria based on technical structure and price behavior.
✦ Current Market Overview
As of May 18, 2025, GBPUSD is priced at 1.32696. The market has formed a recent consolidation structure, showing attempts to hold above key support. The setup presented encourages buying opportunities based on the expectation of a bullish continuation or breakout from the current price zone.
✦ Retracement Zone and Entry Strategy
The green highlighted area on the chart represents the **retracement or demand zone**. If price dips into this area, it is seen as a potential accumulation point for buyers. Key takeaways include:
• **Retracement Zone Range**: Approximated between **1.31394** (low) and the lower edge of the green zone.
• **Candle Close Below Green Zone**: If price closes below this zone, the bullish setup becomes invalid.
• **Stop Loss (SL)**: Set at 20 pips below entry to minimize downside risk.

GBP/USD - Triangle Breakout (23.05.2025)The GBP/USD pair on the M30 timeframe presents a Potential Buying Opportunity due to a recent Formation of a Triangle Pattern. This suggests a shift in momentum towards the upside and a higher likelihood of further advances in the coming hours.
Possible Long Trade:
Entry: Consider Entering A Long Position around Trendline Of The Pattern.
Target Levels:
1st Resistance – 1.3502
2nd Resistance – 1.3534
🎁 Please hit the like button and
🎁 Leave a comment to support for My Post !
Your likes and comments are incredibly motivating and will encourage me to share more analysis with you.
Best Regards, KABHI_TA_TRADING
Thank you.
Disclosure: I am part of Trade Nation's Influencer program and receive a monthly fee for using their TradingView charts in my analysis.

GBPUSD Trade Setup – Entry at 1.34708 with Target at 1.27735Entry Point: ~1.34708
Stop Loss Zone: ~1.35734 (roughly 100 pips above entry)
Target Points:
EA Target Point One: 1.31769
EA Final Target Point: 1.27735
---
Technical Observations:
1. Price Action:
The price is consolidating below the 1.34708 resistance level.
Multiple failed attempts to break above suggest selling pressure around this zone.
2. Moving Averages:
Two MAs (possibly 50 EMA and 200 EMA) show a recent crossover, potentially indicating a shift in momentum.
3. Bearish Bias:
Based on the annotated targets, the trader anticipates a reversal from the current level.
A drop to 1.27735 represents a 5.09% move from the entry point.
4. Risk-Reward Ratio:
Risk (Entry to Stop Loss): ~100 pips
Reward (Entry to Final TP): ~700+ pips
Risk-reward is highly favorable (~1:7)
Confluence & Support Zones:
1.31769: Previously tested support/resistance level – a logical intermediate target
1.27735: Historical support zone from early March – final bearish target.
Summary:
This setup is a swing short trade with an attractive risk-reward profile.
Confirmation via bearish reversal candlesticks near 1.34708 would strengthen the case.
Watch out for news catalysts or USD data that might impact volatility and invalidate the setup.

GBPUSD Short-Term Top Forming Target 1.3360GBPUSD has bounced slightly, but the structure remains heavy and indecisive. However, EURUSD and Gold 4H charts are starting to break down clearly.
EURUSD is dragging lower step by step.
Gold broke a key support zone.
Both are signaling that USD strength is returning — and GBPUSD is likely to follow.
🔍 Technical View
Price rejected from the 1.3465–1.3470 zone (FOMC CPI high)
Lower highs building on the 1H and 4H timeframes
Trading below the 50% retracement of the recent CPI rally
🧠 Key Observation
“A sharp drop on EURUSD from current price will confirm a top is in place on GBPUSD.”
If EURUSD breaks 1.1270 decisively, expect GBPUSD to follow with increased momentum.
🔽 Trade Bias
Bearish below 1.3435
Targets:
1.3360 (first fib cluster + liquidity pocket)
1.3330 (full wave completion)
Invalidation: Clear close above 1.3470
⚠️ Watch for:
U.S. PMI revisions or FOMC speakers to fuel USD move
GBP Retail Sales data tomorrow — potential catalyst
