GBP USD SHORTRisk 0.5%
TP1 = 1:2 RR
Disclaimer:
The contents in this Idea are intended for information purpose only and do not constitute investment recommendation or advice. Nor are they used to promote any specific products or services. They serve as an integral part of a case study to demonstrate fundamental concepts in risk management under given market scenarios. A full version of the disclaimer is available in our profile description.
Gbpusdlongsetup

GBPUSD BUYHi fellow traders, GBPUSD looks ready for a buy opportunity from the blue box area after completing this ABC correction. The trade will be invalidated if we break the red line. Target the resistance levels. Good luck and trade safe!

GBPUSD long coming up oh well..... i know some are probably still bitter after your OB failed but maybe you might see a chance to go long after all. So it looks the market actually left another valid OB and it might be coming back for a lil re-union. I'm not saying it's a chance for revenge but i'm just saying it might have just been another case of good idea wrong timing.

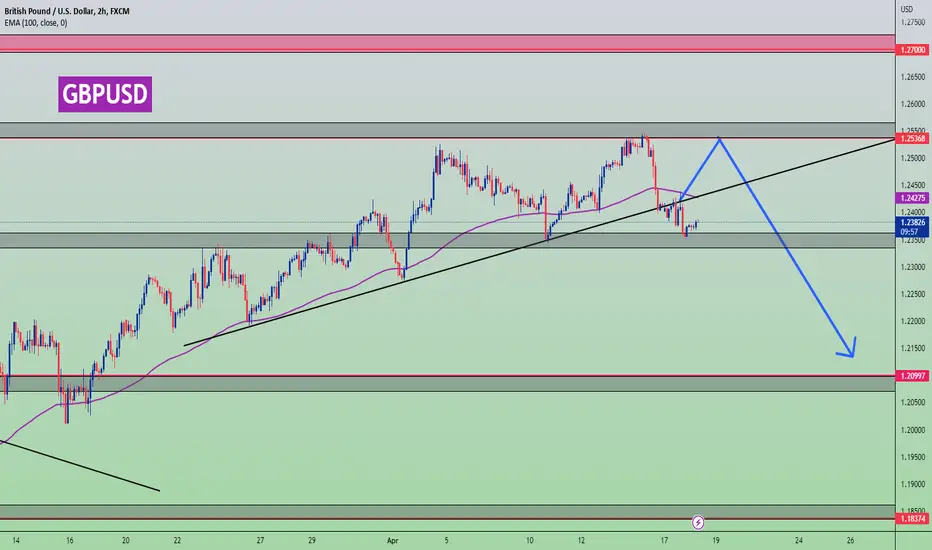
GBPUSD : Current Situation & Technical , Fundamental View#GBPUSD
- Currently the MARKET SENTIMENT for GBPUSD is slightly UP SIDE. All MARKETS including STOCKS and STOCKS may be UP due to MARKET RISK ON in the past days. It affects the POUND greatly. GBPUSD may be slightly UP this week. Anyway, XXXUSD PAIRS are being BUYed slightly higher because the FED is a bit dovish.
- The price can definitely move up to the resistance level above the GBPUSD. The reason for that is because there is a slightly UP BIAS in the MARKET for USD. But GBPUSD can be BUY until 1.2536 LEVEL. After that, you can SELL at 1.2099 LEVEL. So go to GBPUSD SELL ENTRIES.
GBPUSDIn the Daily time frame price shows a consolidation after making a significant bullish trend, we must keep waiting for a breakout from resistance, or the price still be in consolidation

GBPUSD IdeaThe overall trend is bullish. Price has taken inducement and will bounce back from extreme POI and target will be the HH

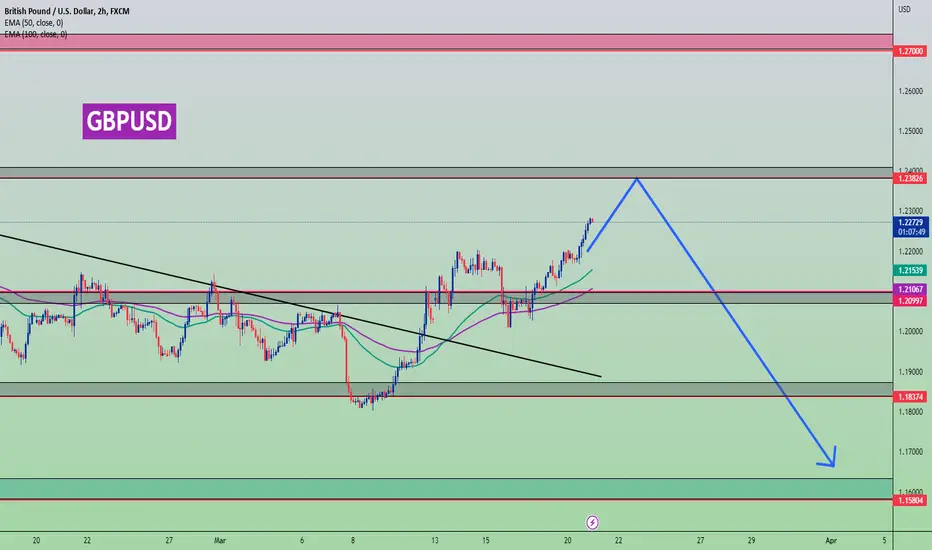
GBPUSD : Current Situation & Technical , Fundamental View#GBPUSD
- Currently the MARKET SENTIMENT for GBPUSD is slightly UP SIDE. All MARKETS including STOCKS and STOCKS may be UP due to MARKET RISK ON in the past days. It affects the POUND greatly. GBPUSD may be slightly UP this week. Anyway, XXXUSD PAIRS are being BUYed slightly higher because the FED is a bit dovish.
- The price can definitely move up to the resistance level above the GBPUSD. The reason for that is because there is a slightly UP BIAS in the MARKET for USD. But GBPUSD can be BUY until 1.2382 LEVEL. After that, you can SELL at 1.1580 LEVEL. So go for GBPUSD SHORT ENTRIES.
#GBPUSD-LONG-Expecting USD to be weaker as the banking crisis is still continued.
-GBP looks much safer currency for investors.

I have GU going to the 27 extension.I didn't see clear structure but now am seeing price bounced off the Moving Average after it hasd already crossed,also bounce off the 50extension fib level am just waiting for price to line up in all Timeframe to create a HL in the 4H and will take this trade all the way up

GBPUSD Showing Strong Bullish Reversal Structure1. GBPUSD Bounced from Fib 0.382 Retracement level, engulfing a daily Candle.
2. Trendline was broken around 1.20513 as an added confluence.
3. Price may seek to take out liquidity above the equal highs around 1.24459

GBPUSD Target 7/3/2023GBP/USD has managed to erase its daily gains after having tested 1.2000 in the European session on Monday. The renewed US Dollar weakness following Wall Street's opening bell helps the pair keep its footing ahead of FOMC Chairman Powell's testimony on Tuesday.
GBP/USD trades near 1.2050, where the 100-period Simple Moving Average (SMA) on the four-hour chart and the Fibonacci 23.6% retracement of the latest downtrend align. Slightly above that level at 1.2080, the descending trend line that sits above the lower-highs that seem to have formed on the four-hour chart forms strong resistance. Only a four-hour close above that level could be seen as a significant bullish development and open the door for an extended rebound to 1.2120 (Fibonacci 38.2% retracement).
On the downside, 1.2000 (psychological level, static level, 100-day SMA) is key support ahead of 1.1970 (static level) and 1.1930 (end-point of the latest downtrend, static level).

GBPUSD Long Term Analysis (Daily Chart)Technical Analysis Summary
GBP/USD
TREND ANALYSIS
We have 2 Downtrend in red color (Long Term and Short Term)
Be careful trends need to be modified when broken to the new peaks(Downtrend) and lows (Uptrend).
FUTURE PREDICTIONS
We have many resistance and support levels that I have mentioned above.
I use thickness as an indicator of strength of levels (ONLY FOR VISUALS).
Daily Level (In White) We have been respecting if we broken we will have a big drop downward toward the support levels.
White Levels are stop losses or levels and trends that were respected from the past.
Good luck everyone, stay safe!
If you need help don't hesitate to send me a message or comment
If you find this content beneficial please don't forget to LIKE and FOLLOW
Trading Involves High Risk
Not Financial Advice
Exercise Proper Risk Management


GBPUSD Short RecapIdentified an opportunity during London Session.
Price was looking to take out an old high
Identified the legs of an ABC structure
As it did we looked for a creation of structure before the liquidity grab
Moved to 15 Min
After the Liquidity grab, we looked for price to break past the creation of structure for a market structure shift MSS or CHoCH
Moved to 5 Min to ID FVG
Wait for price to enter FVG and set SL above recent High
Set TP at or near point B of wave
Targeting 1:2.5 RR risking 1(or 2) percent of account
Emotion:
Groggy as I randomly woke up between 1:30-2 am
ID Session Time and likely pair
Confident in what looked to be forming
Surprised that I woke up to what looks to be a perfect set up
Frustrated due to sleep time, and inability to understand/read to FXBook calculator
Trade MGMT:
Entered minutes later than expected due to calculator difficulties
Added the wrong lot size by a few as I was unfamiliar with mobile MT5
Created feelings of FOMO that I was missing money or wouldn't get an accurate reading with what looked to be a perfect setup
Finally figured out the correct lot size and that I added 1.00 lot initially, and only needed .13 more to risk the %1/2 intended
Was tired and didn't remember if I risked 1 or 2 percent
Added and additional .13 position far past the initial trade,
Looked at the additional .13 as a scale in opportunity, which is something I'd like to be apart of my overall plan

GBPUSD Long Term Predictions (4H Chart)Technical Analysis Summary
GBP/USD
TREND ANALYSIS
We have 1 Uptrend in green color (Long Term)
We have 1 Downtrend in red color (Long Term)
Be careful trends need to be modified when broken to the new peaks(Downtrend) and lows (Uptrend).
FUTURE PREDICTIONS
We have many resistance and support levels that I have mentioned above.
I use thickness as an indicator of strength of levels (ONLY FOR VISUALS).
White Levels are stop ;osses or levels that were respected from the past.
Good luck everyone, stay safe!
If you need help don't hesitate to send me a message or comment
If you find this content beneficial please don't forget to LIKE and FOLLOW
Trading Involves High Risk
Not Financial Advice
Exercise Proper Risk Management

GBPUSD showing bullish signsGBPUSD has been showing bullish signs in the recent days and it may be a good time to buy the currency as it has the tendency to rally up to 1.22500 and then 1.23000. One of the key factors supporting this prediction is the divergence on TDI (Traders Dynamic Index) which is a technical indicator that helps to identify trend strength and potential trend reversal.
Additionally, the pair had a stop hunt taken on Monday, away from the psychological Support and Resistance level which is another indication of bullish sentiment. A stop hunt is a technique used by market makers to push prices away from key levels in order to trigger stop-loss orders and create liquidity. The fact that the stop hunt was taken away from the psychological level, indicates that the buyers are in control and that the pair is likely to continue moving higher.
Furthermore, the stop hunt area was tested again in the Asian session today which confirms the strength of the support at this level, and increases the probability of a rally. My short term target is 1.22500, and my medium term target is 1.23000.

GBPUSDAs a student of SMC, I've just spotted GBPUSD might be having a reversal of trend on the Daily timeframe as it already formed an inverted H&S on a downtrend.There is liquidity before that, market might have just grab the liquidity and may reverse at anytime. There is also a divergence formed between Market Price and RSI.
Drop down what do you think of this idea of longing GBPUSD.

GBPUSD Bias Last Week GBPUSD Has Shown a Bullish strength Technically and fundamentally..Technically Mitigated a Demand Zone. Thereby Breaking a structure Off 1.2000 Round number.This week I look Forward to a short Term Sells into the Demand Zone and long term buys from the Demand zone..

GBPUSD CHANNEL BREAK H4Hello ! GBPUSD Broke The Channel Successfully
Now If GPBUSD Retest The Channel At 1.2050 Area Then You Can Take A Long Position For 1.2150 Area .
I Hope It Will Work And Give Us Good Pips .
Thank You


GBPUSD : Current Situation & Technical , Fundamental View#GBPUSD
- At present the MARKET SENTIMENT for GBPUSD is slightly on the DOWN SIDE. All MARKETS including STOCKS and STOCKS may be UP due to MARKET RISK being ON in the past days. It affects the POUND greatly. GBPUSD may be slightly UP this week. Anyway, because the FED is a bit HAWKISH, the XXXUSD PAIRS are getting slightly downward PRESSURE.
- The price can definitely move up to the SUPPORT LEVEL below the GBPUSD. The reason for that is because there is a bit of a DOWNSIDE BIAS in the MARKET for USD. But after that GBPUSD can BUY until 1.2901 LEVEL. Before that, you can SELL at 1.1837 LEVEL. So go for GBPUSD LONG ENTRIES.
Be sure to pay attention to the UK GEOPOLITICAL STATUS.
If that MARKET SENTIMENT changes and STOCKS and COMMODITIES start to DOWN, it is risky to BUY GBPUSD. So keep an eye on the MARKET SENTIMENT. gbpusd

GBPUSD Friday Buy SetupAs detailed on my chart, I am looking to sell for about 50pips, and then buy for about 80pips to conclude the bullish move for this week. It's been a good ride. Next week might see massive bearish moves.

GBPUSD Friday Buy Setup PT. 2I would be looking for a pullback setup to 88.6, then a sell before the final buy of this week. Price action is showing steady exhaustion to the bullish run of the week.
