Market Trap Alert! GBP/USD Bearish Robbery Plan🔥💸 "The Cable Heist" – GBP/USD Robbery Plan Using Thief Trading Style 💸🔥
— Unfiltered Forex Forecast with Risky Intentions —
🌍 Hey Money-Makers, Market Hustlers & Chart Bandits! 🤑✈️
Hola! Bonjour! Marhaba! Hallo! Ciao! Welcome to the Forex streets where the smart rob the charts, not banks.
Ready for the GBP/USD Heist? Let’s break it down with our infamous Thief Trading Style – raw, unapologetic, and built for profits.
💼 Operation Name: “The Cable Forex Bank Robbery”
🎯 Pair: GBP/USD – aka “The Cable”
⚔️ Style: Scalp / Day Trade / Swing Heist
📊 Bias: Short (Bearish Setup)
🛠 STRATEGY SETUP: "Follow the Shadows"
🔍 Analysis Basis:
Smart-Money Traps at Key Levels
Oversold ≠ Reversal (Read between the candles)
Liquidity Hunting Zones
Retail Stop Clusters Exposed
Thief-style DCA Entries (Staggered Entry Levels)
Multi-timeframe Confirmation
COT, Sentiment & News-Driven Volatility
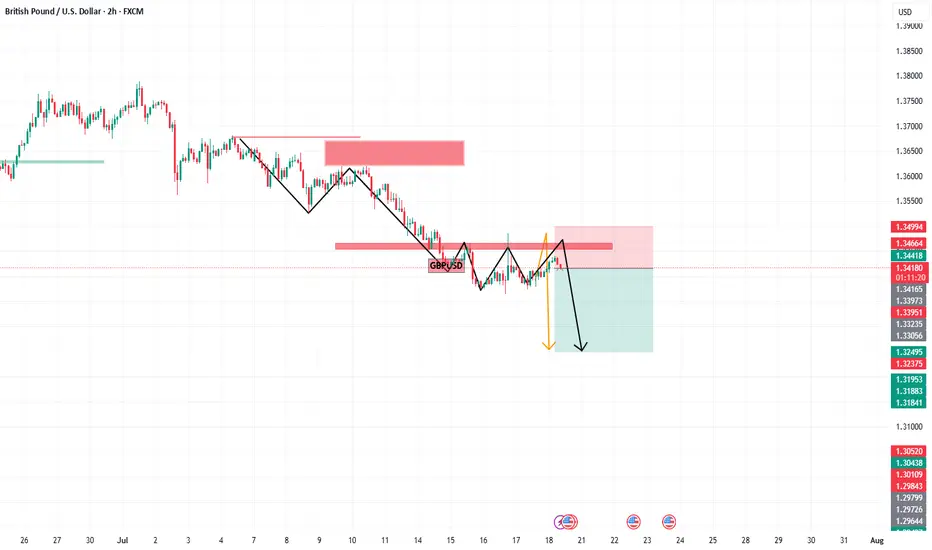
🎯 ENTRY ZONE:
Enter short (sell) using 15M or 30M chart.
Sell Limits near recent highs (pullback zone).
DCA (Layered Entry) recommended – Thief loves catching price slipping.
Let the liquidity work for us.
🛑 STOP LOSS (SL):
Base SL around 1.34000 on 4H Chart – above swing high.
Adjust SL per position size and total entries.
Manage risk, but remember: thieves don’t panic, they plan!
🎯 TARGET ZONE:
TP near 1.31000 or adjust using price action.
Escape before target if market mood flips – no need to be greedy.
Trail SLs if market momentum dies down.
👀 Scalpers' Special Note:
Only SHORT — don’t mess with long side unless you’re a liquidity donor.
Quick ins & outs. If you're loaded with capital, jump in big – else follow the swing team.
Use trailing SLs for safety — protect the loot.
📢 FUNDAMENTALS TO WATCH:
News Impacting GBP/USD
COT Reports
Sentiment Indicators
Macro Trends / Yield Spreads
US Dollar Strength Index (DXY)
UK Economic Reports (CPI, GDP, Rate Decisions)
⚠️ RISK MANAGEMENT TIPS:
🚨 Avoid new entries during news releases
🚨 Use trailing stops during volatility spikes
🚨 Secure running trades before major announcements
🚀 Boost the Robbery – Support the Strategy
💖 Smash that BOOST BUTTON if you're vibing with this setup. Help the Thief crew grow stronger!
Let’s keep milking the market 💸 – one “heist” at a time. Stay dangerous, stay smart.
🔓 NOTE: This isn't investment advice. Just a wild trading idea from a chart outlaw.
Always DYOR – Do Your Own Robbery (Research).
Market conditions shift fast. Stay alert, adapt, and respect your capital.
#ForexThiefStyle #CableHeist #GBPUSDShort #SmartMoneyMoves #LiquidityHunters #ChartOutlaws #TradingRebels #DayTradeLife #ScalpersParadise #ForexGang #FXHeistPlans
Gbpusdsell

GBPUSD Will Go Down!
HI,Traders !
#GBPUSD keeps falling down
And broke the
Key wide horizontal level
Around 1.33938 which is now
A resistance and the breakout
Is confirmed so we are very
Bearish biased and we will
Be expecting a bearish
Continuation !
Comment and subscribe to help us grow !

Market Trap Alert! GBP/USD Bearish Robbery Plan🔥💸 "The Cable Heist" – GBP/USD Robbery Plan Using Thief Trading Style 💸🔥
— Unfiltered Forex Forecast with Risky Intentions —
🌍 Hey Money-Makers, Market Hustlers & Chart Bandits! 🤑✈️
Hola! Bonjour! Marhaba! Hallo! Ciao! Welcome to the Forex streets where the smart rob the charts, not banks.
Ready for the GBP/USD Heist? Let’s break it down with our infamous Thief Trading Style – raw, unapologetic, and built for profits.
💼 Operation Name: “The Cable Forex Bank Robbery”
🎯 Pair: GBP/USD – aka “The Cable”
⚔️ Style: Scalp / Day Trade / Swing Heist
📊 Bias: Short (Bearish Setup)
🛠 STRATEGY SETUP: "Follow the Shadows"
🔍 Analysis Basis:
Smart-Money Traps at Key Levels
Oversold ≠ Reversal (Read between the candles)
Liquidity Hunting Zones
Retail Stop Clusters Exposed
Thief-style DCA Entries (Staggered Entry Levels)
Multi-timeframe Confirmation
COT, Sentiment & News-Driven Volatility
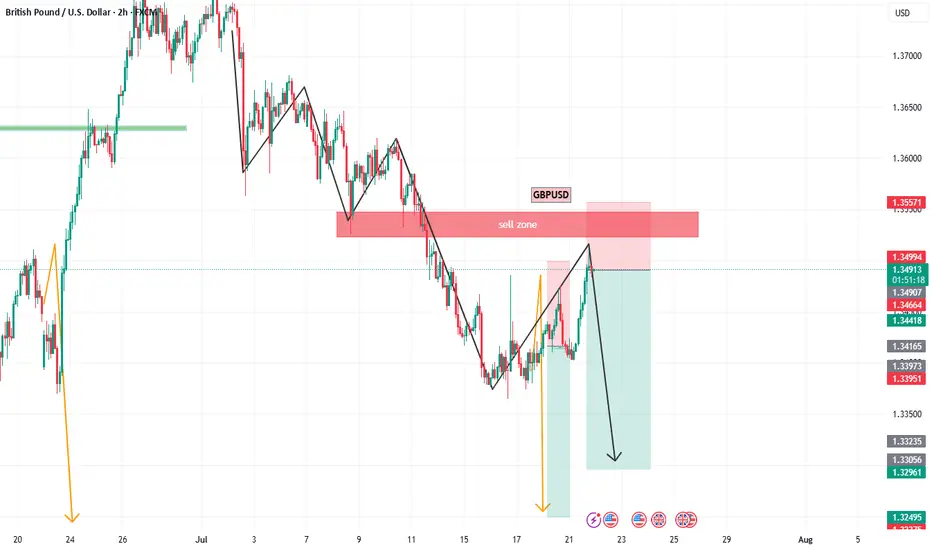
🎯 ENTRY ZONE:
Enter short (sell) using 15M or 30M chart.
Sell Limits near recent highs (pullback zone).
DCA (Layered Entry) recommended – Thief loves catching price slipping.
Let the liquidity work for us.
🛑 STOP LOSS (SL):
Base SL around 1.34850 on 4H Chart – above swing high.
Adjust SL per position size and total entries.
Manage risk, but remember: thieves don’t panic, they plan!
🎯 TARGET ZONE:
TP near 1.32500 or adjust using price action.
Escape before target if market mood flips – no need to be greedy.
Trail SLs if market momentum dies down.
👀 Scalpers' Special Note:
Only SHORT — don’t mess with long side unless you’re a liquidity donor.
Quick ins & outs. If you're loaded with capital, jump in big – else follow the swing team.
Use trailing SLs for safety — protect the loot.
📢 FUNDAMENTALS TO WATCH:
News Impacting GBP/USD
COT Reports
Sentiment Indicators
Macro Trends / Yield Spreads
US Dollar Strength Index (DXY)
UK Economic Reports (CPI, GDP, Rate Decisions)
⚠️ RISK MANAGEMENT TIPS:
🚨 Avoid new entries during news releases
🚨 Use trailing stops during volatility spikes
🚨 Secure running trades before major announcements
🚀 Boost the Robbery – Support the Strategy
💖 Smash that BOOST BUTTON if you're vibing with this setup. Help the Thief crew grow stronger!
Let’s keep milking the market 💸 – one “heist” at a time. Stay dangerous, stay smart.
🔓 NOTE: This isn't investment advice. Just a wild trading idea from a chart outlaw.
Always DYOR – Do Your Own Robbery (Research).
Market conditions shift fast. Stay alert, adapt, and respect your capital.
#ForexThiefStyle #CableHeist #GBPUSDShort #SmartMoneyMoves #LiquidityHunters #ChartOutlaws #TradingRebels #DayTradeLife #ScalpersParadise #ForexGang #FXHeistPlans

GBP/USD Longs to Shorts GU has been very bearish recently and is currently reacting from a clean demand zone with multiple confluences. While we may see a short-term push to the upside, I’ll be watching to see if price reaches the 3hr supply zone sitting at a premium level.
If price does reach that zone, I’ll be on the lookout for signs of Wyckoff distribution and a slowdown in momentum, which could signal the start of another bearish leg.
Confluences for GU Shorts:
Overall bearish trend remains intact — this is a pro-trend setup
Price may retrace to mitigate a 3hr supply zone
Liquidity to the downside still needs to be taken
Current demand zone may simply serve as a trigger for a retracement up to supply
P.S. If price fails to reach the supply zone and continues dropping, we’ll likely see a new break of structure and the formation of a fresh nearby supply zone, which we can then trade from.
Let’s stay sharp and have a profitable trading week ahead! 🔥📊💰

GBPUSD SELLBy utilizing levels, historical patterns, , we can formulate a hypothesis that the market might follow a similar trajectory if bearish sentiment prevails.
GBPUSD SELLBy utilizing levels, historical patterns, , we can formulate a hypothesis that the market might follow a similar trajectory if bearish sentiment prevails.
GBPUSD – Levels, Adjustments, and Scenario PlanningAs mentioned in our pinned analysis, we had two levels on GBPUSD —
✅ Both of them were broken.
📉 After the break of the first level, we shorted the pullback and took a great profit.
📍 Now after the second level has also broken, I’ve adjusted the level slightly —
There’s a chance price retraces to 1.35774 before continuing its drop.
🟢 Below, there’s a solid buy zone.
🔁 My Updated Scenarios:
✅ If price pulls back to the short level before hitting the buy zone → I’ll take the short.
⚠️ But if price touches the buy zone first, then any short afterward will just be partial or used for pyramiding — not a major trade.
Let’s stay patient and let the market tell us what to do.
📌 All previous scenarios are still valid.

GBPUSD Resistance Ahead!
HI,Traders !
#GBPUSD made a rebound
From the support and went
Up but will now retest a
Local horizontal level
Of 1.36793 from where
We will be expecting
A local bearish reaction !
Comment and subscribe to help us grow !

GBP/USD Potential Shorts from 1.37000This week, my analysis for GBP/USD focuses on the continuation of the bearish order flow. I currently have a clean 16-hour supply zone that remains unmitigated, where we may see a potential bearish reaction in alignment with the prevailing downtrend. If price breaks through this zone, I will shift focus to an extreme 2-hour supply zone higher up.
There are several imbalances and pools of liquidity resting below that serve as potential downside targets. Additionally, I’m noticing the formation of engineered liquidity beneath current price, which further supports the bearish outlook.
Confluences for GBP/USD Sells:
The U.S. Dollar has reacted from a strong demand zone, suggesting we could see continued bullish pressure on the dollar, which may weigh on GBP/USD.
GBP/USD has shown a clear change of character to the downside, confirming bearish market structure—this is a pro-trend trade setup.
We have both a clean 16-hour and an extreme 2-hour supply zone, offering high-probability entry points for potential shorts.
Multiple liquidity targets below, including Asia session lows and unfilled imbalances, align well with the bearish narrative.
P.S. My next potential long opportunity lies at the 6-hour demand zone near 1.34400. From there, I’ll be watching for price to slow down, accumulate orders, and potentially shift structure to the upside.
Wishing everyone a successful and profitable trading week!

GBP/USD Made A Double Top Pattern , Short After Breakout ? Here is my opinion on GBP/USD 4H Chart , we have a reversal pattern ( Double Top ) but until now we have not a closure below neckline ,so i`m waiting for 4H Closure below it to confirm the pattern and hen we can sell it , if we have not a closure below then this idea will not be valid .

#GBPUSD: Bulls are in control, DXY Dropping Sharply!Hello Team,
We have identified a promising opportunity with a favourable price movement. The Pound Sterling to US Dollar (GBPUSD) pair has exhibited strong bullish volume, indicating potential further appreciation.
The current geopolitical tensions, particularly the involvement of the United States in the Iran-Israel conflict, are expected to negatively impact the US Dollar. This decline could potentially lead to an appreciation of the GBPUSD pair and other USD-denominated currencies.
It is advisable to closely monitor the price behaviour of the GBPUSD pair and consider potential investment opportunities based on its current trend.
Best regards,
Team Setupsfx

GBPUSD– Rejection at Resistance: Technical and Macro PullbackGBPUSD has climbed back into a strong multi-week resistance zone just beneath 1.3670. While the recent rally was sharp, it now confronts both structural resistance and weakening UK fundamentals. The British economy is losing steam—GDP contracted more than expected, manufacturing output is weak, and the latest CBI survey paints a grim industrial outlook. Meanwhile, Fed officials continue to push back on early rate cut expectations, lending resilience to the USD. Technically, this aligns with a potential top forming near 1.3630–1.3670, offering a compelling risk-reward for sellers.
🔻 Bias: Bearish
• Favoring short setups from resistance, backed by weak UK data and a sticky Fed narrative.
🔑 Key Fundamentals
🇬🇧 UK:
May GDP: –0.3% m/m (worse than forecast)
CBI Industrial Trends: Output volumes and orders well below long-run average
Inflation slowing, but BoE hesitant amid stagnant growth – classic stagflation
🇺🇸 US:
Fed officials (Barkin, Collins, Cook) emphasize caution
Core services inflation still elevated
Fed rate cuts now expected in September, not July
⚠️ Risks to the Bearish View
Hawkish surprise from the BoE (if they hike or signal tightening)
U.S. Core PCE comes in soft, pressuring the USD
Sustained global risk-on rally pulling GBP higher via equities
📅 Important Events to Watch
June 25–26: Fed Chair Powell testimony to Congress
June 28: U.S. Core PCE inflation report
UK CPI revisions, retail sales, and BoE commentary
U.S. jobs and consumer confidence (early July)
📉 Technical Setup – Short from Key Supply Zone
Chart Structure:
Major confluence resistance at 1.3625–1.3665 (blue zone)
Multiple rejection wicks + ascending wedge structure
Bearish divergence building on momentum (not shown)
🎯 Trade Setup:
Entry Zone:
🔹 Sell between 1.3625 and 1.3665, ideally after a bearish engulfing/pin bar or 4H rejection
Take Profits:
TP1: 1.3535 – local support
TP2: 1.3465 – fib and horizontal confluence
TP3: 1.3390 – wedge breakdown target
Stop Loss / Invalidation:
🔸 SL above 1.3685**
A 4H/1D candle close above invalidates the setup and opens the door to new highs.
Risk-Reward:
RR to TP1: ~1.8
RR to TP3: 3.5+
🧭 Summary:
GBPUSD is technically stretched and facing key resistance. With UK macro data deteriorating and Fed members holding the line, this rally looks increasingly vulnerable. As long as 1.3685 holds, sellers may dominate with clear downside targets over the next 1–2 weeks.

GBP/USD Breakout Done , Best Place To Get 150 Pips Clear !Here is my opinion on GBP/USD On 2H T.F , We have a very good breakout now clear not as the old one and we have a very good bearish price action , so i think it will be a good entry if the price go back to retest my res with the news today and give us a good touch and go to downside , and also we might see a random move and fake wicks to take all stop losses before going down or even back to upside so be careful today and use a good risk , i`m waiting the price to back to retest the broken support and new res and then i will enter a sell trade with a very small lot size .

Analysis of GBPUSD 1-Hour Chart Signaling Bullish TrendAnalysis of GBP/USD 1-Hour Chart Signaling Bullish Trend 📈
I. Support Levels & Chart Patterns
Support Confirmation
After testing the 1.34135 support zone, price rebounded sharply with consecutive bullish candles 🚀, forming a potential "double bottom" pattern (or wave low). This successful defense of support reinforces the foundation for upward movement 🏗️.
Resistance Breakout Potential
Price is currently advancing from the 1.34600 short-term support. The key resistance lies at 1.35160. A decisive breakout above this level would validate the bullish projection indicated by the upward arrows on the chart 🎯
⚡️⚡️⚡️ GBPUSD ⚡️⚡️⚡️
🚀 Buy@ 1.33500 - 1.34000
🚀 TP 1.35000 - 1.35500
Accurate signals are updated every day 📈 If you encounter any problems during trading, these signals can serve as your reliable guide 🧭 Feel free to refer to them! I sincerely hope they'll be of great help to you 🌟 👇

GBP/USD Bearish Rejection at Resistance Zone – Downside Targets GBP/USD Bearish Rejection at Resistance Zone – Downside Targets Ahead 🚨
This chart analysis of GBP/USD reveals a clear bearish structure unfolding after the pair tested a strong resistance zone near the 1.36000 level. Here's the professional breakdown:
🔴 Key Resistance Zone: 1.36000 – 1.36200
Price has been rejected multiple times from this upper zone (marked in red).
Repeated upper wicks and lower closes signal selling pressure.
Recent candle formations suggest a potential reversal from this level.
🟢 Major Support Zones:
1.33090 (Mid-Level Support)
This level has acted as a reaction zone in the past.
Could provide temporary consolidation or bounce.
1.31500 – 1.32000
Strong historical support, price bounced here previously.
Bears might slow down in this area before continuation.
1.28000 – 1.29000
Deeper support zone; if broken, could indicate a major trend shift.
📉 Bearish Projection
Price is expected to descend toward 1.33090, and if momentum continues, potentially down to the 1.28 region.
The zigzag projection in the black box reflects a stair-step pattern typical of strong bearish legs.
🧠 Market Psychology & Price Action
Sellers are defending the resistance aggressively.
Lower highs and consistent rejection candles imply weakening bullish momentum.
This setup aligns with a distribution phase before a drop.
📌 Conclusion
🔻 As long as the price remains below the 1.36000 resistance, the bias remains bearish. Watch for confirmations at 1.33090 and 1.32000 – these are crucial zones where price decisions will unfold.
📆 Short to mid-term traders may look for sell setups on retracements with stop-losses above the resistance and targets near support zones.

GBPUSD consolidates resistance zone and declinesPlan GBPUSD day: 16 June 2025
Related Information: !!!
The Pound Sterling (GBP) ticks up to near 1.3590 against the US Dollar (USD) so far on Monday, remaining inside Friday’s trading range. The GBP/USD pair is expected to keep trading within a tight range as investors have sidelined ahead of monetary policy announcements by the Federal Reserve (Fed) and the Bank of England (BoE), due on Wednesday and Thursday, respectively.
At the start of the week, the US Dollar Index (DXY), which tracks the Greenback’s value against six major currencies, edges down to near 98.00.
Investors will closely monitor the interest rate guidance from both central banks, while they are expected to leave those unchanged at their current levels
personal opinion:!!!
At the beginning of the week, there was not much important news. GBPUSD price was sideways and reacted to resistance and support zones.
Important price zone to consider :
SELL point: zone 1.35950
Sustainable trading to beat the market

GBP/USD Technical Analysis – Bearish Setup Developing!GBP/USD Technical Analysis – Bearish Setup Developing! 🔻
Chart Breakdown (H4):
📌 Resistance Zone (🔴 1.35800 – 1.36000):
The pair has been rejected multiple times from this strong resistance area, marked by multiple upper wicks and bearish pressure. Most recent price action shows another rejection, forming a lower high.
📌 Support Level (🟣 1.34732):
This key horizontal level has acted as a strong support multiple times (highlighted with 🟠 circles), suggesting bulls are attempting to defend this zone.
📉 Bearish Structure Formation:
Price recently tested resistance again and was rejected sharply.
A potential double-top or lower high structure is forming.
A break and close below the 1.34732 support will likely confirm bearish momentum.
📍 Next Target (🔻):
If support breaks, price may fall towards the support demand zone around 1.34150 – 1.34300, aligning with the marked red support box.
📈 Invalidation Point:
A clean breakout and hold above 1.36000 would invalidate this bearish bias and potentially signal continuation higher.
⚠️ Summary:
🔼 Resistance Rejection at 1.36000
🔽 Watching for break below 1.34732
🎯 Bearish target: 1.34300 zone
🔄 Invalidation: Break above 1.36000
Bias: 📉 Bearish Below 1.34732

GBPUSD 4H MAJOR REVERSAL SETUP – WATCH FOR THE BREAK!Hey There;
The Head & Shoulders (H&S) pattern in GBPUSD is becoming more defined, approaching a critical neckline level. If a breakout occurs, it could trigger a strong downward move, pushing the price toward new support levels.
Right now, sellers are gaining strength while buyers attempt to defend key support zones. A confirmed close below the neckline could accelerate the sell-off.
📌 If the breakout happens, I’ll share target levels with you—stay tuned for updates
I meticulously prepare these analyses for you, and I sincerely appreciate your support through likes. Every like from you is my biggest motivation to continue sharing my analyses.
I’m truly grateful for each of you—love to all my followers💙💙💙

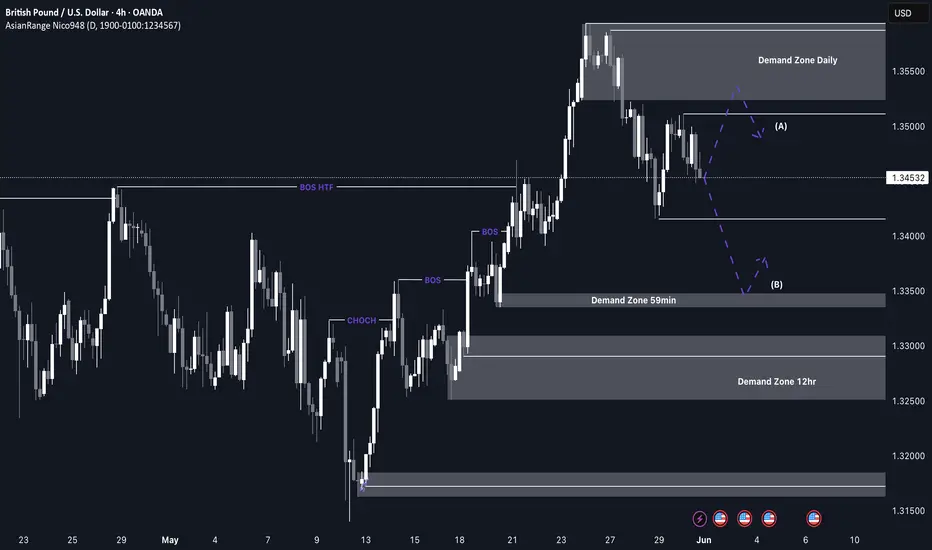
GBP/USD Shorts from the daily supplyI’m anticipating a potential retracement as price has been heavily bullish and is now beginning to show signs of being overbought. After recently breaking major structure to the upside, there’s room for a temporary sell-off as price corrects before continuing higher.
I’ll be watching for possible reactions from the 59-minute demand zone for a minor bounce, but the more ideal long opportunity would be at the 12H demand zone around 1.3300, where structure is cleaner and confluences align.
Confluences for Short-Term Sells:
- A recent change of character (CHOCH) to the downside signals a shift in momentum
- A clean daily supply zone has been left behind that could initiate a deeper pullback
- Significant liquidity below, including the Asia low, ready to be swept
- For price to maintain long-term bullish movement, it must first correct, fill imbalances, and mitigate valid demand levels
P.S. If price drops further and breaks structure, we’ll likely see a new supply zone form. This will provide a closer and more refined opportunity to participate in the move.
Stay sharp and trade safe! 📉📈
GBPUSD Near Key Resistance – Watching for PullbackGBPUSD has surged to test the 1.3538 resistance, forming a strong impulsive rally supported by higher lows and tight bullish consolidation patterns. However, price is now pressing into a major horizontal resistance and rising trendline, setting up for either continuation or correction.
Key Levels:
Major Resistance: 1.35389 (previous high, potential double top)
Trendline Support: ~1.3440 (ascending structure)
Downside Target (if break occurs): 1.3140 (range floor)
Scenarios to Watch:
🔹 Bearish Scenario (Primary Watch)
Price reacts to 1.3538 and forms a rejection candle
Break of the ascending trendline may trigger a retracement
Downside target zones:
1.3440 (initial structure)
1.3140 (major support zone)
🔹 Bullish Breakout (Alternate Scenario)
Clean break and close above 1.3538
Would invalidate short-term correction and open path to new highs
Momentum continuation possible toward 1.3600–1.3700
Pattern Notes:
Bullish structure with minor flags and wedges in the uptrend
But rally is extended and hitting overbought territory near resistance
RSI divergence or reversal patterns around this level would strengthen short case
Conclusion:
📌 GBPUSD is at a major resistance. Watch for rejection or breakout.
📌 If it holds below 1.3538 and breaks trendline, short setup is favored.
📌 If it breaks out above 1.3538 with volume, stay out of shorts and wait for retest.

GBP/USD SELL IDEA (R:R=7)Selling GBP/USD now. Just formed a wonderful butterfly formation on the 4 hour chart. Also, it took out the DAILY D extension yesterday.
Stop Loss: 1.34850
Please move SL to break even when trade is 100+ pips in profit.
Target: 1.30880
Happy Trading! :)

GBPUSD: Will DXY Bounce Back? |GBPUSD Swing Sell|The GBPUSD pair is currently rallying towards a potential selling zone, where sellers could push the price down. However, the main concern is the current state of the DXY, which clearly indicates another sell-off and could lead to another lower low. Please remember to use risk management while trading forex pairs.
There are three take-profit targets that can be set according to your trading plan. This analysis doesn’t guarantee that the price will move as described.
Good luck and trade safely!
Thank you for your unwavering support! 😊
If you’d like to contribute, here are a few ways you can help us:
- Like our ideas
- Comment on our ideas
- Share our ideas
Team Setupsfx_
❤️🚀

GBPUSD Analysis – Bearish Setup Into Key ResistanceGBP/USD is trading into a key multi-week resistance zone between 1.3360 and 1.3413. The pair has failed to break this area multiple times, and current price action shows signs of compression and hesitation. With elevated UK inflation limiting BoE easing flexibility and renewed USD support following bond yield spikes, this setup offers a compelling bearish opportunity. Clean downside targets lie at 1.3177, 1.3016, and potentially 1.2890. The trade remains valid unless price breaks and holds above 1.3413.
🔍 Technical Analysis
Structure:
Price is testing a significant resistance zone (1.3360–1.3413) that’s held since early April.
Bearish trendline from May highs remains intact.
A descending structure is forming with lower highs and failed breakouts.
Support Levels to Watch:
1.3177 – Previous structure low
1.3016 – Strong horizontal support
1.2890 – March swing low and fib extension target
Confluence:
EUR/USD overlay shows rejection at similar highs, reinforcing risk-off dollar strength
Price failing to hold above fib retracement levels from prior swings
🌍 Fundamental Context
🇬🇧 British Pound (GBP):
UK inflation is climbing again (expected 3.0% CPI for April), delaying BoE's ability to cut further.
BoE’s Pill has pushed back on rapid easing, citing persistent service inflation.
UK-EU trade agreement provides medium-term support, but short-term upside appears priced in.
🇺🇸 U.S. Dollar (USD):
Despite Moody’s downgrade, U.S. yields are rising, supporting USD demand.
Trump’s tariff threats have injected global risk-off tones, lifting the dollar as a safe haven.
Fed remains cautious — no rate cuts expected soon.
🎯 Trade Setup
Bias: Bearish
Entry Zone: Near 1.3360–1.3413 resistance (wait for rejection candle confirmation)
Targets:
First: 1.3177
Second: 1.3016
Third: 1.2890
Invalidation: A daily close above 1.3413 would invalidate the bearish thesis
⚠️ Risk & Management Tips
Don’t short blindly into resistance — wait for strong wick or bearish engulfing candle.
Watch upcoming UK inflation data or Fed commentary for macro triggers.
Avoid over-leveraging: false breakouts near highs are common.
🧭 Conclusion
GBP/USD is coiling near a powerful resistance area. A confirmed rejection opens the door for a multi-leg downside move into 1.30 and below. As long as price holds beneath 1.3413, the risk-reward profile favors sellers. Patience and precision are key at this stage.
