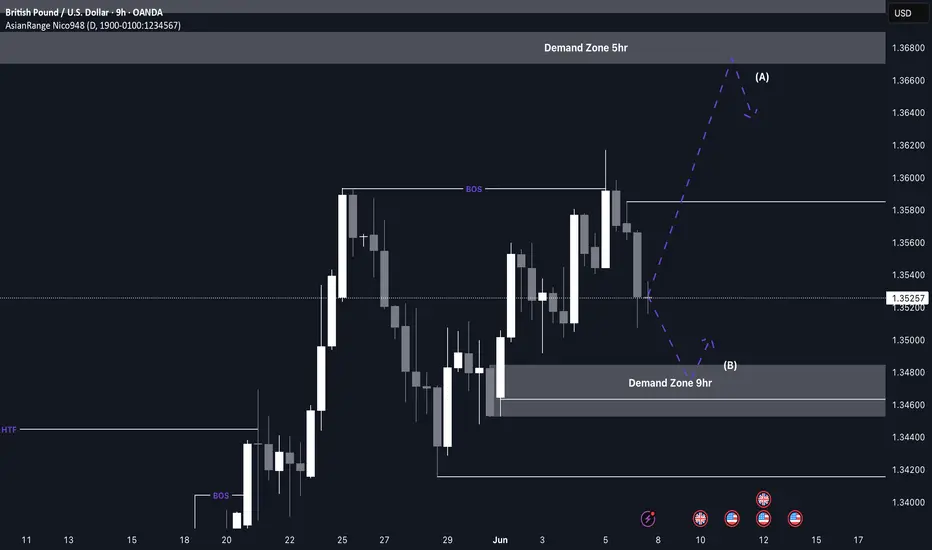
GBP/USD Buys from 1.34800 This week’s analysis focuses on capitalising on the strong bullish structure forming on GU. After a clear break of structure to the upside, price has been forming consistent higher highs and higher lows.
From this move, a key Point of Interest has been left around the 1.34800 level, which aligns with a clean 9H demand zone. As price now needs to retrace after the recent bullish push, this 9H zone becomes a likely area for accumulation and a potential continuation rally.
Confluences for GU Buys:
- GU has been very bullish overall on the higher timeframes
- The 9H demand zone caused the latest break of structure to the upside
- There’s plenty of liquidity and imbalance above that needs to be taken
- The DXY is moving bearish, supporting GU upside
P.S. If price pushes higher before retracing, it may enter a premium supply zone, where I’ll be watching for any significant reaction. Either way, patience is key — don’t hesitate to wait for your setup to fully form.
Wishing you a focused and profitable trading week!
Gbpusdsetup
GBPUSD Holds Above 1.34 – Is 1.35 the Launch Pad?In last week’s GBPUSD outlook, I pointed to the 1.34 zone as a potential buy area and likely end of the correction.
The market reacted as expected, reversing from 1.34 and rallying to 1.35. Toward the end of the week, a brief correction followed — but price held above 1.34 and has now returned to 1.35, printing a higher low in the process.
📌 From both a technical and psychological standpoint, 1.35 remains a key level. A confirmed break above could lead to a retest of the recent high — or even push for a new high.
✅ My bias stays bullish as long as 1.34 support remains intact.
Disclosure: I am part of TradeNation's Influencer program and receive a monthly fee for using their TradingView charts in my analyses and educational articles.

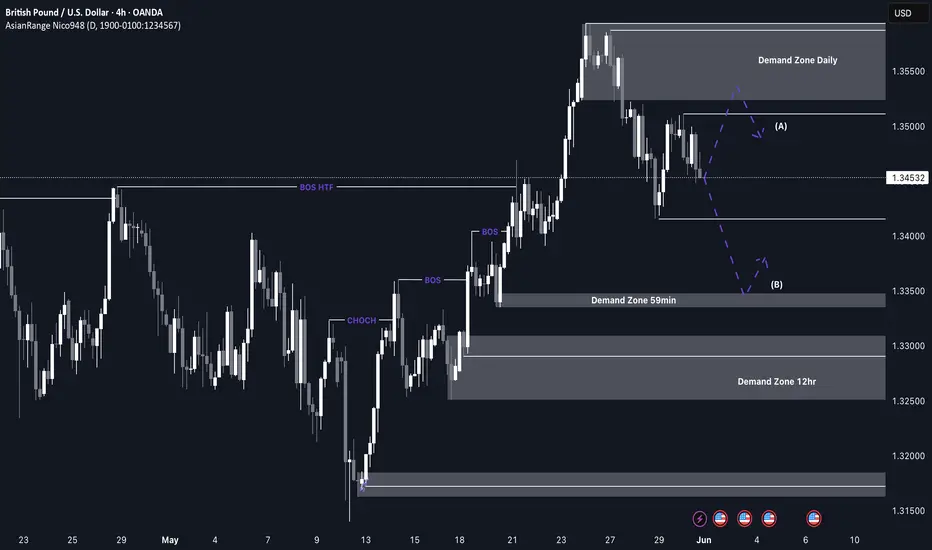
GBP/USD Shorts from the daily supplyI’m anticipating a potential retracement as price has been heavily bullish and is now beginning to show signs of being overbought. After recently breaking major structure to the upside, there’s room for a temporary sell-off as price corrects before continuing higher.
I’ll be watching for possible reactions from the 59-minute demand zone for a minor bounce, but the more ideal long opportunity would be at the 12H demand zone around 1.3300, where structure is cleaner and confluences align.
Confluences for Short-Term Sells:
- A recent change of character (CHOCH) to the downside signals a shift in momentum
- A clean daily supply zone has been left behind that could initiate a deeper pullback
- Significant liquidity below, including the Asia low, ready to be swept
- For price to maintain long-term bullish movement, it must first correct, fill imbalances, and mitigate valid demand levels
P.S. If price drops further and breaks structure, we’ll likely see a new supply zone form. This will provide a closer and more refined opportunity to participate in the move.
Stay sharp and trade safe! 📉📈
GBP/USD Analysis: Price Searching for SupportGBP/USD Analysis: Price Searching for Support
In the second half of May, the British pound showed notable strength: from its 12 May low, GBP/USD climbed to a peak on 26 May — marking its highest level in over three years.
Demand for the pound has been driven by several factors:
→ A surge in inflation. CPI data released last Wednesday came in above expectations. As a result, market participants interpreted this as a reason for the Bank of England to remain cautious about cutting interest rates. Holding rates at elevated levels is generally considered bullish for the pound.
→ The pound’s relative resilience amid trade tensions, particularly following a newly signed agreement with the US, as well as strengthening trade ties between the UK and the EU.
Can the pound continue to rise? The GBP/USD chart offers reasons for doubt.
Technical Analysis of the GBP/USD Chart
Recent price movements have formed an ascending channel (outlined in blue), and earlier this week, demand was so strong that the pair briefly moved above the upper boundary. But what happened next?
That strong buying momentum appears to have faded — resulting in a sequence of lower highs (A→B→C→D), suggesting that the market may be searching for a foothold. Today’s bounce (highlighted by the arrow) hints that such a foothold may have been found. But how reliable is it? And can the uptrend be resumed?
→ From a bullish perspective: Support may be provided by the lower boundary of the channel, reinforced by the 1.345 level.
→ From a bearish perspective: The 1.352 level is acting as resistance, further strengthened by the median line.
It is possible that the area marked by lower highs (A→B→C→D) could ultimately prove to be an insurmountable barrier for the developing uptrend on the GBP/USD chart.
This article represents the opinion of the Companies operating under the FXOpen brand only. It is not to be construed as an offer, solicitation, or recommendation with respect to products and services provided by the Companies operating under the FXOpen brand, nor is it to be considered financial advice.

GBPUSD|SHORT"I’m sharing this analysis with you based on Fibonacci tools, a retraced descending channel, and key supply and demand zones."
its just my idea so use m/m

GBPUSD Near Key Resistance – Watching for PullbackGBPUSD has surged to test the 1.3538 resistance, forming a strong impulsive rally supported by higher lows and tight bullish consolidation patterns. However, price is now pressing into a major horizontal resistance and rising trendline, setting up for either continuation or correction.
Key Levels:
Major Resistance: 1.35389 (previous high, potential double top)
Trendline Support: ~1.3440 (ascending structure)
Downside Target (if break occurs): 1.3140 (range floor)
Scenarios to Watch:
🔹 Bearish Scenario (Primary Watch)
Price reacts to 1.3538 and forms a rejection candle
Break of the ascending trendline may trigger a retracement
Downside target zones:
1.3440 (initial structure)
1.3140 (major support zone)
🔹 Bullish Breakout (Alternate Scenario)
Clean break and close above 1.3538
Would invalidate short-term correction and open path to new highs
Momentum continuation possible toward 1.3600–1.3700
Pattern Notes:
Bullish structure with minor flags and wedges in the uptrend
But rally is extended and hitting overbought territory near resistance
RSI divergence or reversal patterns around this level would strengthen short case
Conclusion:
📌 GBPUSD is at a major resistance. Watch for rejection or breakout.
📌 If it holds below 1.3538 and breaks trendline, short setup is favored.
📌 If it breaks out above 1.3538 with volume, stay out of shorts and wait for retest.

GBPUSD Trade IdeaThe GBPUSD pair is showing a strong bullish trend on the 4-hour chart. However, the price currently looks overextended. This suggests the market may be due for a corrective pullback.
I’m watching for a pullback into a discounted zone near the fair value gap.
If the price moves back into this zone, I’ll look for a bullish break of market structure as a signal to enter long.
This plan emphasizes patience and the importance of waiting for a favorable entry rather than chasing an extended move. As always, this is my personal strategy and not financial advice. Proper risk management and discretion are essential.

GBPUSD Breaks Out – Is 1.40 Next?In my previous analysis, I highlighted that GBPUSD was trading in a strong resistance zone and warned of a potential correction toward the sub-1.31 support area.
While we did see a brief correction, bears lacked follow-through, and the pair reversed from 1.3136, never quite reaching the expected support zone.
🚀 Break Confirmed – Bulls in Control
After bouncing from just above the support zone at 1.3136, GBPUSD began to consolidate and build pressure right under the key resistance area.
That build-up acted as a launchpad, and now we have a clean breakout, with price trading well above 1.35, currently around 1.3577.
This is a genuine breakout, following a textbook sequence: rejection above support, tight consolidation, and then a decisive push higher — all favoring continuation to the upside.
🎯 W hat’s Next?
The next obvious target is the psychological level at 1.40, which aligns with previous key levels and the overall momentum.
📊 Trading Plan:
The strategy remains simple: buying dips is preferred.
The 1.3450 area is an ideal zone to look for long opportunities, especially if the breakout is retested and confirmed as support.
📌 Don’t chase — let the market pull back, then follow the strength. Momentum is clearly with the bulls. 🚀
Disclosure: I am part of Trade Nation's Influencer program and receive a monthly fee for using their TradingView charts in my analyses and educational articles.

PERHAPS IT'S TIME TO STOP SHORTING GBPUSD LONG FORECAST W22 Y25PERHAPS IT'S TIME TO STOP SHORTING GBPUSD LONG FORECAST W22 Y25
Hey traders ✌️
welcome to your market analysis by FRGNT! 🙌
Professional Risk Managers👋
Welcome back to another FRGNT chart update📈
Diving into some Forex setups using predominantly higher time frame order blocks alongside confirmation breaks of structure.
Let’s see what price action is telling us today!
🔑 Remember, to participate in trading comes always with a degree of risk, therefore as professional risk managers it remains vital that we stick to our risk management plan as well as our trading strategies.
💡Trade confluences provided during the week 📝
✅Bullish weekly close above recent highs & Orderblock
✅ Within Weekly Orderblock. Potential shorts after bearish price action.
📈The rest, we leave to the balance of probabilities.
💡Fail to plan. Plan to fail.
🏆It has always been that simple.
❤️Good luck with your trading journey, I shall see you at the very top.
🎯Trade consistent, FRGNT X

GBP/USD "The Cable" Forex Bank Money Heist (Bearish)🌟Hi! Hola! Ola! Bonjour! Hallo! Marhaba!🌟
Dear Money Makers & Robbers, 🤑💰✈️
Based on 🔥Thief Trading style technical and fundamental analysis🔥, here is our master plan to heist the GBP/USD "The Cable" Forex Market. Please adhere to the strategy I've outlined in the chart, which emphasizes short entry. Our aim is the high-risk GREEN MA Zone. It's a Risky level, oversold market, consolidation, trend reversal, trap at the level where traders and bullish robbers are stronger. 🏆💸"Take profit and treat yourself, traders. You deserve it!💪🏆🎉
Entry 📈 : "The heist is on! Wait for the Neutral Level breakout then make your move at (1.32500) - Bearish profits await!"
however I advise to Place sell stop orders above the Moving average (or) after the Support level Place sell limit orders within a 15 (or) 30 minute timeframe most NEAREST (or) SWING low or high level for Pullback entries.
📌I strongly advise you to set an "alert (Alarm)" on your chart so you can see when the breakout entry occurs.
Stop Loss 🛑: "🔊 Yo, listen up! 🗣️ If you're lookin' to get in on a sell stop order, don't even think about settin' that stop loss till after the breakout 🚀. You feel me? Now, if you're smart, you'll place that stop loss where I told you to 📍, but if you're a rebel, you can put it wherever you like 🤪 - just don't say I didn't warn you ⚠️. You're playin' with fire 🔥, and it's your risk, not mine 👊."
📌Thief SL placed at the nearest/swing High or Low level Using the 1H timeframe (1.33400) Day/Scalping trade basis.
📌SL is based on your risk of the trade, lot size and how many multiple orders you have to take.
Target 🎯: 1.31600
💰💵💸GBP/USD "The Cable" Forex Market Heist Plan (Scalping/Day Trade) is currently experiencing a Bearish trend.., driven by several key factors.👇👇👇
📰🗞️Read the Fundamental, Macro Economics, COT Report, Seasonal Factors, Intermarket Analysis, Inventory and Storage Analysis, Sentimental Outlook, Future trend predict.
Before start the heist plan read it. go ahead to check 👉👉👉🔗🔗🌎🌏🗺
⚠️Trading Alert : News Releases and Position Management 📰 🗞️ 🚫🚏
As a reminder, news releases can have a significant impact on market prices and volatility. To minimize potential losses and protect your running positions,
we recommend the following:
Avoid taking new trades during news releases
Use trailing stop-loss orders to protect your running positions and lock in profits
💖Supporting our robbery plan 💥Hit the Boost Button💥 will enable us to effortlessly make and steal money 💰💵. Boost the strength of our robbery team. Every day in this market make money with ease by using the Thief Trading Style.🏆💪🤝❤️🎉🚀
I'll see you soon with another heist plan, so stay tuned 🤑🐱👤🤗🤩

GBP/USD SELL IDEA (R:R=7)Selling GBP/USD now. Just formed a wonderful butterfly formation on the 4 hour chart. Also, it took out the DAILY D extension yesterday.
Stop Loss: 1.34850
Please move SL to break even when trade is 100+ pips in profit.
Target: 1.30880
Happy Trading! :)

GBPUSD: Will DXY Bounce Back? |GBPUSD Swing Sell|The GBPUSD pair is currently rallying towards a potential selling zone, where sellers could push the price down. However, the main concern is the current state of the DXY, which clearly indicates another sell-off and could lead to another lower low. Please remember to use risk management while trading forex pairs.
There are three take-profit targets that can be set according to your trading plan. This analysis doesn’t guarantee that the price will move as described.
Good luck and trade safely!
Thank you for your unwavering support! 😊
If you’d like to contribute, here are a few ways you can help us:
- Like our ideas
- Comment on our ideas
- Share our ideas
Team Setupsfx_
❤️🚀

GBP/USD Cable Heist:Join the Thief Trading Style to Raid Profit!GBP/USD Cable Heist Plan - Thief Trading Style 😎💸
Greetings, wealth chasers and market bandits! 👋💰
Welcome to the Thief Trading Style, blending sharp technicals with savvy fundamentals to raid the GBP/USD "Cable" Forex Market. 📊 Follow the strategy outlined in the chart, focusing on long entries targeting the high-stakes Red Zone. 🌋 Expect an overbought market, consolidation, or trend reversal where bears might set traps. 🐻 Nail the plan, grab your profits, and treat yourself—you’ve earned it! 🎯💵🎉
Entry 📈: The heist begins! 🚨 Wait for the MA breakout at 1.34700, then strike for bullish gains. 🐂 Set buy stop orders above the moving average or place buy limit orders within a 15/30-minute timeframe at the recent swing high/low. ⏰ Don’t miss the move—set a chart alert to catch the breakout! 🔔
Stop Loss 🛑: Listen up, crew! 🗣️ For buy stop orders, hold off on setting your stop loss until after the breakout. 🚀 Place it at the recent swing low on the 4H timeframe (1.33300) for swing/day trades. 📍 Adjust based on your risk, lot size, and number of orders. Play smart, or you’re dancing with danger! 🔥😈
Target 🎯: Aim for 1.37000 or bail early if the market shifts. 🏃♂️ Scalpers, stick to long-side trades. 👀 Got deep pockets? Jump in now. 💪 Otherwise, join the swing traders and execute the plan with a trailing stop loss to secure your loot. 🔒💰
Market Outlook: GBP/USD is riding a bullish wave, fueled by key fundamentals. 🐃 Dive into the COT Report, macro data, sentiment, intermarket analysis, and future trend targets via the linkss below for the full scoop. 🔗👉
Why This Trade?: The bullish setup on GBP/USD is backed by strong technical signals, with the MA breakout confirming upward momentum. 📈 Fundamentals, including favorable COT positioning and positive macro data, suggest sustained strength in the pound. 💪 Intermarket correlations and sentiment analysis further align with a bullish outlook, making this an ideal moment to strike the Cable for potential high rewards. 🌟 The Red Zone target at 1.37000 offers a prime risk-to-reward ratio for disciplined traders. 🤑
⚠️ Trading Alert: News & Position Management 📰:
News releases can shake up prices and volatility. 🌪️ To stay safe:
Skip new trades during news events. 🚫
Use trailing stops to lock in profits and protect open positions. 🔐
Boost the Heist! 🚀: Support our plan by hitting the Boost Button to supercharge our market raids. 💥 With the Thief Trading Style, we’re stacking profits daily. 📈 Join the crew, execute the plan, and let’s make money moves! 💪🤝😺
Stay sharp for the next heist plan. Until then, keep robbing the markets! 🤑🐱👤

GBPUSD Analysis – Bearish Setup Into Key ResistanceGBP/USD is trading into a key multi-week resistance zone between 1.3360 and 1.3413. The pair has failed to break this area multiple times, and current price action shows signs of compression and hesitation. With elevated UK inflation limiting BoE easing flexibility and renewed USD support following bond yield spikes, this setup offers a compelling bearish opportunity. Clean downside targets lie at 1.3177, 1.3016, and potentially 1.2890. The trade remains valid unless price breaks and holds above 1.3413.
🔍 Technical Analysis
Structure:
Price is testing a significant resistance zone (1.3360–1.3413) that’s held since early April.
Bearish trendline from May highs remains intact.
A descending structure is forming with lower highs and failed breakouts.
Support Levels to Watch:
1.3177 – Previous structure low
1.3016 – Strong horizontal support
1.2890 – March swing low and fib extension target
Confluence:
EUR/USD overlay shows rejection at similar highs, reinforcing risk-off dollar strength
Price failing to hold above fib retracement levels from prior swings
🌍 Fundamental Context
🇬🇧 British Pound (GBP):
UK inflation is climbing again (expected 3.0% CPI for April), delaying BoE's ability to cut further.
BoE’s Pill has pushed back on rapid easing, citing persistent service inflation.
UK-EU trade agreement provides medium-term support, but short-term upside appears priced in.
🇺🇸 U.S. Dollar (USD):
Despite Moody’s downgrade, U.S. yields are rising, supporting USD demand.
Trump’s tariff threats have injected global risk-off tones, lifting the dollar as a safe haven.
Fed remains cautious — no rate cuts expected soon.
🎯 Trade Setup
Bias: Bearish
Entry Zone: Near 1.3360–1.3413 resistance (wait for rejection candle confirmation)
Targets:
First: 1.3177
Second: 1.3016
Third: 1.2890
Invalidation: A daily close above 1.3413 would invalidate the bearish thesis
⚠️ Risk & Management Tips
Don’t short blindly into resistance — wait for strong wick or bearish engulfing candle.
Watch upcoming UK inflation data or Fed commentary for macro triggers.
Avoid over-leveraging: false breakouts near highs are common.
🧭 Conclusion
GBP/USD is coiling near a powerful resistance area. A confirmed rejection opens the door for a multi-leg downside move into 1.30 and below. As long as price holds beneath 1.3413, the risk-reward profile favors sellers. Patience and precision are key at this stage.

GBPUSD: Bulls Are Gearing Up For The Next RallyBullish Confirmations:
- Double bottom formed at QP at end of last week
- Creating HLs and HHs
- Bullish Choch
- Multiple bullish FVGs (showing bullish momentum)
- Multiple bullish breaker blocks
🟢ENTRY 1.33578
SL 1.331
TP1 1.33778
TP2 1.34078
TP3 1.34578
There's a chance we may get a deeper pullback. If so no big deal, we'll just catch a better entry.

GBPUSD pullbackOANDA:GBPUSD
As shown in our pinned analysis, this level was previously considered for a short trade. But after being broken, according to our plan, it has now turned into a buy zone.
We are ready to enter a long position,
but if the price drops below and holds, this level will lose its validity and the analysis will be invalid.
Follow us for more trades analysis!
For detailed entry points, trade management, and high-probability setups, follow the channel:
ForexCSP

GBP/USD potential shorts back downMy analysis revolves around a possible bearish reaction from the 2‑hour supply zones. If price does respect these zones, I’ll look for a sell setup to drive price lower—though I’ll approach with caution because there’s liquidity resting just above those points of interest.
Should price push downward, my next target is the 10‑hour demand zone that triggered the recent change of character. This discounted area could spark a bullish response.
Confluences for GU sells are as follows:
- An unmitigated 4‑hour supply zone overhead.
- A “sell‑to‑buy” scenario fits: price sits closer to supply and still needs a retracement.
- Imbalance and untapped liquidity lie below, inviting a move south.
- Liquidity has just been swept above, leaving a clean supply zone behind.
P.S. If price punches through these supply zones and breaks structure to the upside, I’ll watch for the new zone that forms—there could be a nearer‑term long opportunity from there.

GBPUSD SHORT FORECAST Q2 W20 D16 Y25GBPUSD SHORT FORECAST Q2 W20 D16 Y25
Professional Risk Managers👋
Welcome back to another FRGNT chart update📈
Diving into some Forex setups using predominantly higher time frame order blocks alongside confirmation breaks of structure.
Let’s see what price action is telling us today!
💡Here are some trade confluences📝
✅Weekly order block rejection
✅Daily order block rejection
✅Intraday 15' order blocks
✅Tokyo ranges to be filled
🔑 Remember, to participate in trading comes always with a degree of risk, therefore as professional risk managers it remains vital that we stick to our risk management plan as well as our trading strategies.
📈The rest, we leave to the balance of probabilities.
💡Fail to plan. Plan to fail.
🏆It has always been that simple.
❤️Good luck with your trading journey, I shall see you at the very top.
🎯Trade consistent, FRGNT X

GBPUSD TRIPPLE TOP BEARISH PATTERNGBPUSD TRIPPLE TOP BEARISH PATTERN
Market Finds the Specific Adjustment where it can get possible values
This market moves towards bearish trend making a Tripple Top bearish pattern.
GBPUSD market want to reach some targets, resistance and support level.
1st Target Zone 1.31400
Final Target Zone 1.30000
Resistance level. 1.34300
Support level. 1.27600

#GBPUSD: Risk Entry Vs Safe Entry, Which One Would You Chose? The GBPUSD currency pair presents two promising opportunities for entry, potentially generating gains exceeding 500 pips. However, entering these markets carries a substantial risk of stop-loss hunting during the commencement of the week. Conversely, adopting a safe entry strategy offers a favourable chance for a bullish position.
We encourage you to share your thoughts and feedback on our ideas. ❤️🚀
Team Setupsfx_

GBPUSD Analysis🔁 GBPUSD update!
As our followers know,
we previously took a great profit from this level (see pinned idea below).💸
Now, that level is broken and we are patiently waiting for a pullback to enter a short trade.🔻
***If the price breaks above, we may switch to a buy setup — let’s wait for a clear signal!🕵️
For detailed entry points, trade management, and high-probability setups, follow the channel:
ForexCSP

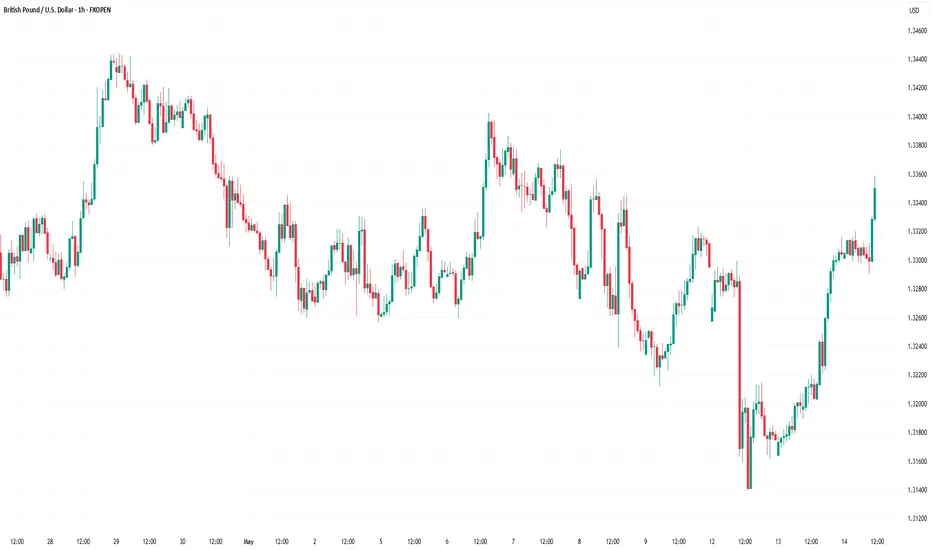
Market Analysis: GBP/USD Edges HigherMarket Analysis: GBP/USD Edges Higher
GBP/USD is attempting a fresh increase above the 1.3270 resistance.
Important Takeaways for GBP/USD Analysis Today
- The British Pound is attempting a fresh increase above 1.3250.
- There was a break above a key bearish trend line with resistance at 1.3270 on the hourly chart of GBP/USD at FXOpen.
GBP/USD Technical Analysis
On the hourly chart of GBP/USD at FXOpen, the pair declined after it failed to clear the 1.3440 resistance. As mentioned in the previous analysis, the British Pound traded below the 1.3200 support against the US Dollar.
Finally, the pair tested the 1.3140 zone and is currently attempting a fresh increase. The bulls were able to push the pair above the 50-hour simple moving average and 1.3215.
There was a break above a key bearish trend line with resistance at 1.3270. The pair surpassed the 50% Fib retracement level of the downward move from the 1.3402 swing high to the 1.3139 low. It is now showing positive signs above 1.3300.
On the upside, the GBP/USD chart indicates that the pair is facing resistance near 1.3340 and the 76.4% Fib retracement level of the downward move from the 1.3402 swing high to the 1.3139 low.
The next major resistance is near 1.3400. A close above the 1.3400 resistance zone could open the doors for a move toward 1.3440. Any more gains might send GBP/USD toward 1.3500.
On the downside, immediate support is near 1.3270. If there is a downside break below 1.3270, the pair could accelerate lower. The first major support is near the 1.3215 level and the 50-hour simple moving average.
The next key support is seen near 1.3140, below which the pair could test 1.3080. Any more losses could lead the pair toward the 1.3000 support.
This article represents the opinion of the Companies operating under the FXOpen brand only. It is not to be construed as an offer, solicitation, or recommendation with respect to products and services provided by the Companies operating under the FXOpen brand, nor is it to be considered financial advice.
GBPUSD SHORT FORECAST Q2 W20 D14 Y25GBPUSD SHORT FORECAST Q2 W20 D14 Y25
Professional Risk Managers👋
Welcome back to another FRGNT chart update📈
Diving into some Forex setups using predominantly higher time frame order blocks alongside confirmation breaks of structure.
Let’s see what price action is telling us today!
💡Here are some trade confluences📝
✅Weekly order block rejection
✅Daily order block rejection
✅Intraday 15' order blocks
✅Tokyo ranges to be filled
🔑 Remember, to participate in trading comes always with a degree of risk, therefore as professional risk managers it remains vital that we stick to our risk management plan as well as our trading strategies.
📈The rest, we leave to the balance of probabilities.
💡Fail to plan. Plan to fail.
🏆It has always been that simple.
❤️Good luck with your trading journey, I shall see you at the very top.
🎯Trade consistent, FRGNT X
