Market Analysis: GBP/USD RalliesMarket Analysis: GBP/USD Rallies
GBP/USD started a fresh increase above the 1.3520 zone.
Important Takeaways for GBP/USD Analysis Today
- The British Pound is eyeing more gains above the 1.3600 resistance.
- There is a key bullish trend line forming with support at 1.3540 on the hourly chart of GBP/USD at FXOpen.
GBP/USD Technical Analysis
On the hourly chart of GBP/USD at FXOpen, the pair formed a base above the 1.3350 level. The British Pound started a steady increase above the 1.3450 resistance zone against the US Dollar, as discussed in the previous analysis.
The pair gained strength above the 1.3500 level. The bulls even pushed the pair above the 1.3550 level and the 50-hour simple moving average. The pair tested the 1.3585 zone and is currently consolidating gains.
GBP/USD is stable above the 23.6% Fib retracement level of the upward move from the 1.3390 swing low to the 1.3586 high. There is also a key bullish trend line forming with support at 1.3540.
It seems like the bulls might aim for more gains. The RSI moved above the 60 level on the GBP/USD chart and the pair is now approaching a major hurdle at 1.3600.
An upside break above the 1.3600 zone could send the pair toward 1.3650. Any more gains might open the doors for a test of 1.3720. If there is a downside correction, immediate support is near the 1.3540 level and the trend line.
The first major support sits near the 50% Fib retracement level of the upward move from the 1.3390 swing low to the 1.3586 high at 1.3485. The next major support is 1.3450. If there is a break below 1.3450, the pair could extend the decline. The next key support is near the 1.3390 level. Any more losses might call for a test of the 1.3345 support.
This article represents the opinion of the Companies operating under the FXOpen brand only. It is not to be construed as an offer, solicitation, or recommendation with respect to products and services provided by the Companies operating under the FXOpen brand, nor is it to be considered financial advice.
Gbpusdshort

GBP/USD "The Cable" Forex Bank Money Heist (Bearish)🌟Hi! Hola! Ola! Bonjour! Hallo! Marhaba!🌟
Dear Money Makers & Robbers, 🤑💰✈️
Based on 🔥Thief Trading style technical and fundamental analysis🔥, here is our master plan to heist the GBP/USD "The Cable" Forex Market. Please adhere to the strategy I've outlined in the chart, which emphasizes short entry. Our aim is the high-risk GREEN MA Zone. It's a Risky level, oversold market, consolidation, trend reversal, trap at the level where traders and bullish robbers are stronger. 🏆💸"Take profit and treat yourself, traders. You deserve it!💪🏆🎉
Entry 📈 : "The heist is on! Wait for the Neutral Level breakout then make your move at (1.32500) - Bearish profits await!"
however I advise to Place sell stop orders above the Moving average (or) after the Support level Place sell limit orders within a 15 (or) 30 minute timeframe most NEAREST (or) SWING low or high level for Pullback entries.
📌I strongly advise you to set an "alert (Alarm)" on your chart so you can see when the breakout entry occurs.
Stop Loss 🛑: "🔊 Yo, listen up! 🗣️ If you're lookin' to get in on a sell stop order, don't even think about settin' that stop loss till after the breakout 🚀. You feel me? Now, if you're smart, you'll place that stop loss where I told you to 📍, but if you're a rebel, you can put it wherever you like 🤪 - just don't say I didn't warn you ⚠️. You're playin' with fire 🔥, and it's your risk, not mine 👊."
📌Thief SL placed at the nearest/swing High or Low level Using the 1H timeframe (1.33400) Day/Scalping trade basis.
📌SL is based on your risk of the trade, lot size and how many multiple orders you have to take.
Target 🎯: 1.31600
💰💵💸GBP/USD "The Cable" Forex Market Heist Plan (Scalping/Day Trade) is currently experiencing a Bearish trend.., driven by several key factors.👇👇👇
📰🗞️Read the Fundamental, Macro Economics, COT Report, Seasonal Factors, Intermarket Analysis, Inventory and Storage Analysis, Sentimental Outlook, Future trend predict.
Before start the heist plan read it. go ahead to check 👉👉👉🔗🔗🌎🌏🗺
⚠️Trading Alert : News Releases and Position Management 📰 🗞️ 🚫🚏
As a reminder, news releases can have a significant impact on market prices and volatility. To minimize potential losses and protect your running positions,
we recommend the following:
Avoid taking new trades during news releases
Use trailing stop-loss orders to protect your running positions and lock in profits
💖Supporting our robbery plan 💥Hit the Boost Button💥 will enable us to effortlessly make and steal money 💰💵. Boost the strength of our robbery team. Every day in this market make money with ease by using the Thief Trading Style.🏆💪🤝❤️🎉🚀
I'll see you soon with another heist plan, so stay tuned 🤑🐱👤🤗🤩

GBPUSD Short-Term Top Forming Target 1.3360GBPUSD has bounced slightly, but the structure remains heavy and indecisive. However, EURUSD and Gold 4H charts are starting to break down clearly.
EURUSD is dragging lower step by step.
Gold broke a key support zone.
Both are signaling that USD strength is returning — and GBPUSD is likely to follow.
🔍 Technical View
Price rejected from the 1.3465–1.3470 zone (FOMC CPI high)
Lower highs building on the 1H and 4H timeframes
Trading below the 50% retracement of the recent CPI rally
🧠 Key Observation
“A sharp drop on EURUSD from current price will confirm a top is in place on GBPUSD.”
If EURUSD breaks 1.1270 decisively, expect GBPUSD to follow with increased momentum.
🔽 Trade Bias
Bearish below 1.3435
Targets:
1.3360 (first fib cluster + liquidity pocket)
1.3330 (full wave completion)
Invalidation: Clear close above 1.3470
⚠️ Watch for:
U.S. PMI revisions or FOMC speakers to fuel USD move
GBP Retail Sales data tomorrow — potential catalyst

GBP/USD SELL IDEA (R:R=7)Selling GBP/USD now. Just formed a wonderful butterfly formation on the 4 hour chart. Also, it took out the DAILY D extension yesterday.
Stop Loss: 1.34850
Please move SL to break even when trade is 100+ pips in profit.
Target: 1.30880
Happy Trading! :)

GBPUSD: Will DXY Bounce Back? |GBPUSD Swing Sell|The GBPUSD pair is currently rallying towards a potential selling zone, where sellers could push the price down. However, the main concern is the current state of the DXY, which clearly indicates another sell-off and could lead to another lower low. Please remember to use risk management while trading forex pairs.
There are three take-profit targets that can be set according to your trading plan. This analysis doesn’t guarantee that the price will move as described.
Good luck and trade safely!
Thank you for your unwavering support! 😊
If you’d like to contribute, here are a few ways you can help us:
- Like our ideas
- Comment on our ideas
- Share our ideas
Team Setupsfx_
❤️🚀

GBPUSD I Technical and Fundamental Forecast Welcome back! Let me know your thoughts in the comments!
** GBPUSD Analysis - Listen to video!
We recommend that you keep this pair on your watchlist and enter when the entry criteria of your strategy is met.
Please support this idea with a LIKE and COMMENT if you find it useful and Click "Follow" on our profile if you'd like these trade ideas delivered straight to your email in the future.
Thanks for your continued support!Welcome back! Let me know your thoughts in the comments!

GBPUSD: Bearish Order FlowSpread out across multiple days, GBPUSD has been ranging now. Maybe it's time GBPUSD reached the peak of this distribution with this Shark Pattern. Let's see how it plays out.

BEST PRICE TO SHORT GU - GBPUSD SHORT FORECAST W21 D21 Y25
GBPUSD SHORT FORECAST Q2 W21 D21 Y25
BEST PRICE TO SHORT GBPUSD
Professional Risk Managers👋
Welcome back to another FRGNT chart update📈
Diving into some Forex setups using predominantly higher time frame order blocks alongside confirmation breaks of structure.
Let’s see what price action is telling us today!
💡Here are some trade confluences📝
✅Weekly order block rejection
✅Daily order block rejection
✅Intraday 15' order blocks
✅Tokyo ranges to be filled
🔑 Remember, to participate in trading comes always with a degree of risk, therefore as professional risk managers it remains vital that we stick to our risk management plan as well as our trading strategies.
📈The rest, we leave to the balance of probabilities.
💡Fail to plan. Plan to fail.
🏆It has always been that simple.
❤️Good luck with your trading journey, I shall see you at the very top.
🎯Trade consistent, FRGNT X

GBPUSDHello traders!
There’s currently an opportunity for a Sell trade on GBPUSD, and the position is now active.
🔍 Trade Details:
✔️ Timeframe: 15-Minute
✔️ Risk-to-Reward Ratio: 1:2
✔️ Trade Direction: Sell
✔️ Entry Price: 1.33695
✔️ Take Profit: 1.33531
✔️ Stop Loss: 1.33777
🔔 Disclaimer: This is not financial advice. I’m simply sharing a trade I’m personally taking based on my own strategy. It is intended purely for educational purposes.
📌 Interested in a more systematic and data-driven approach to trading?
💡 Follow the page and turn on notifications to stay updated with future trade ideas and market breakdowns.

GBPUSD Analysis – Bearish Setup Into Key ResistanceGBP/USD is trading into a key multi-week resistance zone between 1.3360 and 1.3413. The pair has failed to break this area multiple times, and current price action shows signs of compression and hesitation. With elevated UK inflation limiting BoE easing flexibility and renewed USD support following bond yield spikes, this setup offers a compelling bearish opportunity. Clean downside targets lie at 1.3177, 1.3016, and potentially 1.2890. The trade remains valid unless price breaks and holds above 1.3413.
🔍 Technical Analysis
Structure:
Price is testing a significant resistance zone (1.3360–1.3413) that’s held since early April.
Bearish trendline from May highs remains intact.
A descending structure is forming with lower highs and failed breakouts.
Support Levels to Watch:
1.3177 – Previous structure low
1.3016 – Strong horizontal support
1.2890 – March swing low and fib extension target
Confluence:
EUR/USD overlay shows rejection at similar highs, reinforcing risk-off dollar strength
Price failing to hold above fib retracement levels from prior swings
🌍 Fundamental Context
🇬🇧 British Pound (GBP):
UK inflation is climbing again (expected 3.0% CPI for April), delaying BoE's ability to cut further.
BoE’s Pill has pushed back on rapid easing, citing persistent service inflation.
UK-EU trade agreement provides medium-term support, but short-term upside appears priced in.
🇺🇸 U.S. Dollar (USD):
Despite Moody’s downgrade, U.S. yields are rising, supporting USD demand.
Trump’s tariff threats have injected global risk-off tones, lifting the dollar as a safe haven.
Fed remains cautious — no rate cuts expected soon.
🎯 Trade Setup
Bias: Bearish
Entry Zone: Near 1.3360–1.3413 resistance (wait for rejection candle confirmation)
Targets:
First: 1.3177
Second: 1.3016
Third: 1.2890
Invalidation: A daily close above 1.3413 would invalidate the bearish thesis
⚠️ Risk & Management Tips
Don’t short blindly into resistance — wait for strong wick or bearish engulfing candle.
Watch upcoming UK inflation data or Fed commentary for macro triggers.
Avoid over-leveraging: false breakouts near highs are common.
🧭 Conclusion
GBP/USD is coiling near a powerful resistance area. A confirmed rejection opens the door for a multi-leg downside move into 1.30 and below. As long as price holds beneath 1.3413, the risk-reward profile favors sellers. Patience and precision are key at this stage.

GBPUSD SHORT FORECAST Q2 W21 D20 Y25GBPUSD SHORT FORECAST Q2 W21 D20 Y25
Professional Risk Managers👋
Welcome back to another FRGNT chart update📈
Diving into some Forex setups using predominantly higher time frame order blocks alongside confirmation breaks of structure.
Let’s see what price action is telling us today!
💡Here are some trade confluences📝
✅Weekly order block rejection
✅Daily order block rejection
✅Intraday 15' order blocks
✅Tokyo ranges to be filled
🔑 Remember, to participate in trading comes always with a degree of risk, therefore as professional risk managers it remains vital that we stick to our risk management plan as well as our trading strategies.
📈The rest, we leave to the balance of probabilities.
💡Fail to plan. Plan to fail.
🏆It has always been that simple.
❤️Good luck with your trading journey, I shall see you at the very top.
🎯Trade consistent, FRGNT X

GBPUSD inverted head and shoulder?Hello traders, this is a complete multiple timeframe analysis of this pair. We see could find significant trading opportunities as per analysis upon price action confirmation we may take this trade. Smash the like button if you find value in this analysis and drop a comment if you have any questions or let me know which pair to cover in my next analysis.

DON'T MISS OUT ON GBPUSD SHORTS IN W21 OF Q2 Y25GBPUSD SHORT FORECAST Q2 W21 Y25
DON'T MISS OUT ON GBPUSD SHORTS IN W21 OF Q2 Y25
Professional Risk Managers👋
Welcome back to another FRGNT chart update📈
Diving into some Forex setups using predominantly higher time frame order blocks alongside confirmation breaks of structure.
Let’s see what price action is telling us today!
💡Here are some trade confluences📝
✅Weekly order block rejection
✅Daily order block rejection
✅Intraday 15' order blocks
✅Tokyo ranges to be filled
🔑 Remember, to participate in trading comes always with a degree of risk, therefore as professional risk managers it remains vital that we stick to our risk management plan as well as our trading strategies.
📈The rest, we leave to the balance of probabilities.
💡Fail to plan. Plan to fail.
🏆It has always been that simple.
❤️Good luck with your trading journey, I shall see you at the very top.
🎯Trade consistent, FRGNT X

GBP/USD potential shorts back downMy analysis revolves around a possible bearish reaction from the 2‑hour supply zones. If price does respect these zones, I’ll look for a sell setup to drive price lower—though I’ll approach with caution because there’s liquidity resting just above those points of interest.
Should price push downward, my next target is the 10‑hour demand zone that triggered the recent change of character. This discounted area could spark a bullish response.
Confluences for GU sells are as follows:
- An unmitigated 4‑hour supply zone overhead.
- A “sell‑to‑buy” scenario fits: price sits closer to supply and still needs a retracement.
- Imbalance and untapped liquidity lie below, inviting a move south.
- Liquidity has just been swept above, leaving a clean supply zone behind.
P.S. If price punches through these supply zones and breaks structure to the upside, I’ll watch for the new zone that forms—there could be a nearer‑term long opportunity from there.

GBPUSD SHORT FORECAST Q2 W20 D16 Y25GBPUSD SHORT FORECAST Q2 W20 D16 Y25
Professional Risk Managers👋
Welcome back to another FRGNT chart update📈
Diving into some Forex setups using predominantly higher time frame order blocks alongside confirmation breaks of structure.
Let’s see what price action is telling us today!
💡Here are some trade confluences📝
✅Weekly order block rejection
✅Daily order block rejection
✅Intraday 15' order blocks
✅Tokyo ranges to be filled
🔑 Remember, to participate in trading comes always with a degree of risk, therefore as professional risk managers it remains vital that we stick to our risk management plan as well as our trading strategies.
📈The rest, we leave to the balance of probabilities.
💡Fail to plan. Plan to fail.
🏆It has always been that simple.
❤️Good luck with your trading journey, I shall see you at the very top.
🎯Trade consistent, FRGNT X

GBPUSD: Bearish OverflowWe got this potential Deep Crab Pattern that aligns with FVG on the Daily timeframe. It's possible we'll continue to break structure to the low if the Dollar continues to rises.

GBPUSD SHORT FORECAST Q2 W20 D15 Y25GBPUSD SHORT FORECAST Q2 W20 D15 Y25
Professional Risk Managers👋
Welcome back to another FRGNT chart update📈
Diving into some Forex setups using predominantly higher time frame order blocks alongside confirmation breaks of structure.
Let’s see what price action is telling us today!
💡Here are some trade confluences📝
✅Weekly order block rejection
✅Daily order block rejection
✅Intraday 15' order blocks
✅Tokyo ranges to be filled
🔑 Remember, to participate in trading comes always with a degree of risk, therefore as professional risk managers it remains vital that we stick to our risk management plan as well as our trading strategies.
📈The rest, we leave to the balance of probabilities.
💡Fail to plan. Plan to fail.
🏆It has always been that simple.
❤️Good luck with your trading journey, I shall see you at the very top.
🎯Trade consistent, FRGNT X

GBPUSD TRIPPLE TOP BEARISH PATTERNGBPUSD TRIPPLE TOP BEARISH PATTERN
Market Finds the Specific Adjustment where it can get possible values
This market moves towards bearish trend making a Tripple Top bearish pattern.
GBPUSD market want to reach some targets, resistance and support level.
1st Target Zone 1.31400
Final Target Zone 1.30000
Resistance level. 1.34300
Support level. 1.27600

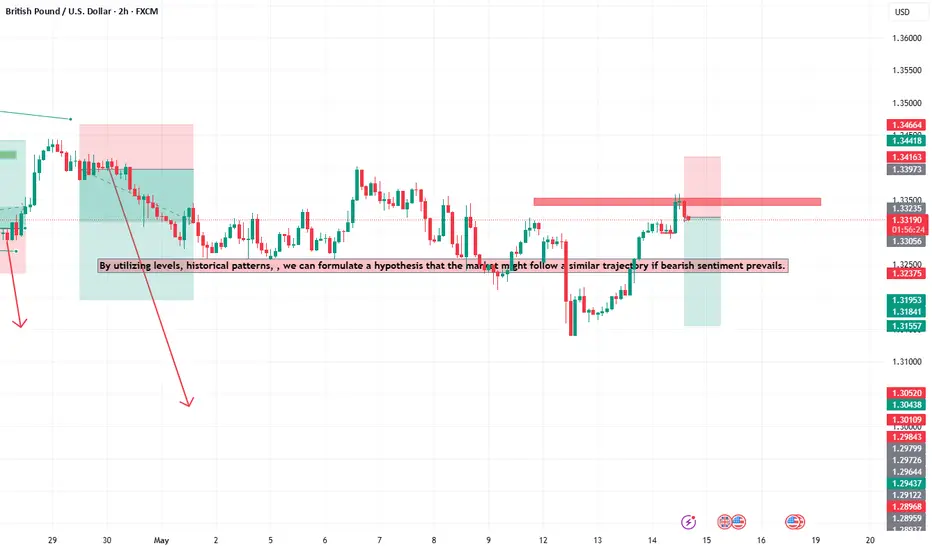
GBPUSD SELL/SHORTBy utilizing levels, historical patterns, , we can formulate a hypothesis that the market might follow a similar trajectory if bearish sentiment prevails.
GBPUSD Analysis🔁 GBPUSD update!
As our followers know,
we previously took a great profit from this level (see pinned idea below).💸
Now, that level is broken and we are patiently waiting for a pullback to enter a short trade.🔻
***If the price breaks above, we may switch to a buy setup — let’s wait for a clear signal!🕵️
For detailed entry points, trade management, and high-probability setups, follow the channel:
ForexCSP

GBPUSD SHORT FORECAST Q2 W20 D14 Y25GBPUSD SHORT FORECAST Q2 W20 D14 Y25
Professional Risk Managers👋
Welcome back to another FRGNT chart update📈
Diving into some Forex setups using predominantly higher time frame order blocks alongside confirmation breaks of structure.
Let’s see what price action is telling us today!
💡Here are some trade confluences📝
✅Weekly order block rejection
✅Daily order block rejection
✅Intraday 15' order blocks
✅Tokyo ranges to be filled
🔑 Remember, to participate in trading comes always with a degree of risk, therefore as professional risk managers it remains vital that we stick to our risk management plan as well as our trading strategies.
📈The rest, we leave to the balance of probabilities.
💡Fail to plan. Plan to fail.
🏆It has always been that simple.
❤️Good luck with your trading journey, I shall see you at the very top.
🎯Trade consistent, FRGNT X

GBPUSD Brace for a Sharp Drop to 1.3000! Free signal!Hello everyone.
I want share my idea about GBPUSD.
The U.S.-China trade deal breakthrough has fueled USD strength, pressuring GBP/USD after a surge to 1.3330. BoE’s dovish stance, with a potential 25 bps rate cut priced in, contrasts with a hawkish Fed, favoring USD. Upcoming UK CPI and U.S. CPI data this week could drive volatility—soft UK inflation may weaken GBP, while high U.S. inflation could bolster USD further. UK wage growth (5.9%) offers GBP support, but weak PMI and employer sentiment cap gains. Watch U.S.-UK trade deal news for potential GBP upside.
With technical we can see last week we had some consolidation and this week started with high volatility and brake support. at the moment price testing resistance + 4h FVG.
Scenario 1 (Bearish – Primary View): Price rejects the 1.3200–1.3275 FVG/resistance zone and resumes its downtrend, targeting the next major support at 1.3000—a psychological and structural level. This aligns with USD strength from the trade deal and BoE’s dovish stance . Trade Setup: Short below 1.3200, target 1.3000, stop above 1.3300 (above FVG).
Scenario 2 (Bullish – Less Likely): Buyers break above the FVG (1.3275) and 1.3300, targeting 1.3350–1.3400. This would require a catalyst like soft U.S. CPI data weakening USD, but current fundamentals favor bears.
Trade Setup:
Entry below - 1.3190 (current price 1.32048) ensures confirmation of rejection.
Stop above - 1.3280 (above FVG) protects against a bullish breakout.
Target - I will follow trend with trail stop.
For collaboration text me private!
Always make your own research!!!

GBPUSD: Strong Sell Momentum Built Up! What is next?GBPUSD is building strong sell momentum, increasing sell volume. At the same time, DXY is in correction mode, so keep that in mind. If DXY plummets again, it may invalidate our first entry. However, there’s a second entry that could be a safer zone for those looking for a stable entry.
There are three take profit targets that can be set according to your trading plan. This analysis doesn’t guarantee that the price will move as described.
Good luck and trade safely!
Thank you for your unwavering support! 😊
If you’d like to contribute, here are a few ways you can help us:
- Like our ideas
- Comment on our ideas
- Share our ideas
Team Setupsfx_
❤️🚀
