GBPUSD(20250716)Today's AnalysisMarket news:
① The annual rate of the overall CPI in the United States in June rose to 2.7%, the highest since February, in line with market expectations, and the monthly rate was 0.3%, the highest since January, in line with market expectations; the annual rate of the core CPI rose to 2.9%, the highest since February, lower than the expected 3%, but slightly higher than 2.8% last month, and the monthly rate was 0.2%, lower than the market expectation of 0.3%.
② Interest rate futures still show that the Fed is unlikely to cut interest rates this month, but there is a high possibility of a 25 basis point cut in September.
③ Fed mouthpiece: The CPI report will not change the Fed's policy direction.
④ Trump: Consumer prices are low and the federal funds rate should be lowered immediately. The Fed should cut interest rates by 3 percentage points.
⑤ Fed Collins: The core inflation rate is expected to remain at about 3% by the end of the year, and the Fed should maintain active patience.
Technical analysis:
Today's buying and selling boundaries:
1.3409
Support and resistance levels:
1.3497
1.3464
1.3443
1.3375
1.3354
1.3321
Trading strategy:
If the price breaks through 1.3409, consider buying, the first target price is 1.3443
If the price breaks through 1.3375, consider selling, the first target price is 1.3354
Gbpusdsignal

DeGRAM | GBPUSD broke down the channel📊 Technical Analysis
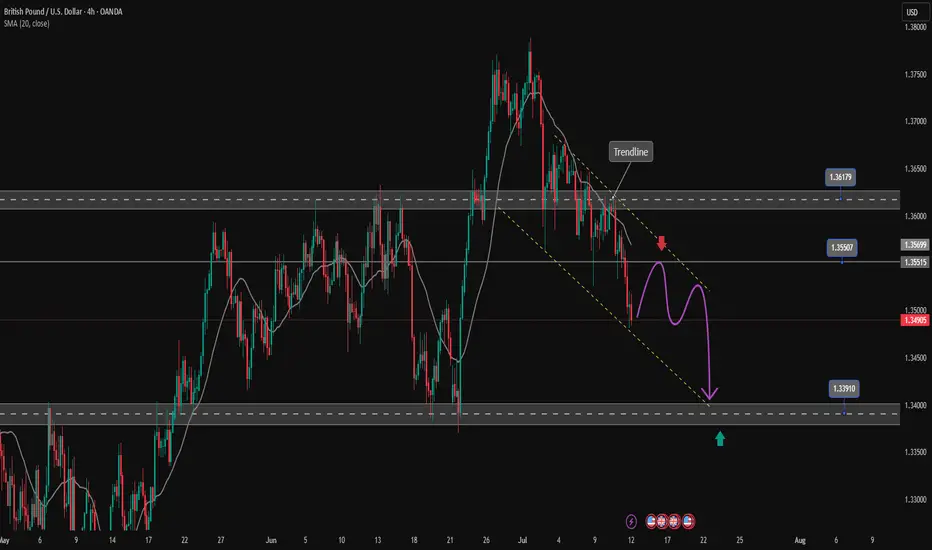
● Cable’s bounce stalled at the channel base (≈1.3500); price is now carving a bear flag beneath that rail and the prior wedge-break line, signalling failure to regain trend support.
● A 4 h close under 1.3415 confirms channel loss, opening the mid-May pivot 1.3271; flag top at 1.3470 caps risk while lower-high sequence stays intact.
💡 Fundamental Analysis
● Friday’s firm US consumer-sentiment and Fed Gov. Waller’s “no urgency to cut” comments nudged 2-yr yields back toward 4.80 %, reviving dollar demand.
● UK June payrolls contracted for a third month and wage growth cooled, boosting August BoE-cut odds and weighing on sterling.
✨ Summary
Sell 1.3460-1.3490; sustained trade below 1.3415 targets 1.3271. Short view void on a 4 h close above 1.3470.
-------------------
Share your opinion in the comments and support the idea with a like. Thanks for your support!

GBPUSD downtrend continuesOANDA:GBPUSD is trading in a bearish channel heading towards the important support zone of 1.340. This is the bottom support zone of last month so there is a lot of buying pressure in this zone. Any recovery of GBPUSD is considered a good opportunity to enter a SELL signal to the target. When the price breaks 1.361, the downtrend will really break.
Support: 1.340
Resistance: 1.355-1.361
SELL Trigger: rejection 1.355 with bearish confirmation
SELL zone 1.361 (Strong Resistance zone)
Target: 1.340
Leave your comments on the idea. I am happy to read your views.
GBPUSD(20250714)Today's AnalysisMarket news:
① Fed's Goolsbee: The latest tariff threat may delay rate cuts. ② The Fed responded to the White House's "accusations": The increase in building renovation costs partly reflects unforeseen construction conditions. ③ "Fed's megaphone": The dispute over building renovations has challenged the Fed's independence again, and it is expected that no rate cuts will be made this month. ④ Hassett: Whether Trump fires Powell or not, the Fed's answer to the headquarters renovation is the key.
Technical analysis:
Today's buying and selling boundaries:
1.3518
Support and resistance levels:
1.3621
1.3583
1.3558
1.3479
1.3454
1.3415
Trading strategy:
If the price breaks through 1.3518, consider buying in, with the first target price at 1.3558
If the price breaks through 1.3479, consider selling in, with the first target price at 1.3454

GBPUSD: Two Strong Bullish Area To Buy From ?GU is currently in a bullish trend when examined on a daily time frame. There are two potential areas for purchase. The first area is currently active, as we anticipate a price reversal from this point. There is a significant possibility that price could decline to the second area and subsequently reverse from there directly. The sole reason we believe price could drop to the second area is if the US Dollar experiences corrections, which could cause GU to drop to our second area and subsequently rebound.
If you appreciate our analysis, we kindly request that you consider the following actions:
-Liking the Ideas
-Commenting on the Ideas
-Sharing the Ideas
We extend our sincere gratitude for your continuous support. We trust that our insights have provided even a modicum of assistance.
Team Setupsfx_
❤️🚀

EURUSD and GBPUSD Analysis todayHello traders, this is a complete multiple timeframe analysis of this pair. We see could find significant trading opportunities as per analysis upon price action confirmation we may take this trade. Smash the like button if you find value in this analysis and drop a comment if you have any questions or let me know which pair to cover in my next analysis.

GBPUSD Bearish Signal | Technical + Custom AlgoSmart Trend Signal | Technical Analysis + Custom Algorithm
This signal is the result of a combination of classic technical trend analysis and a proprietary software I personally developed.
GBPUSDGBPUSD is close to giving us a good upward reaction, wait for an impulse for upside soon before you look for buys.
Disclosure: We are part of Trade Nation's Influencer program and receive a monthly fee for using their TradingView charts in our analysis.

GBPUSD Long From Rising Support !
HI,Traders !
#GBPUSD is trading along
The rising support line
And the pair will soon hit
A trend-line from where we
Will be expecting a local
Bullish rebound and a
Further bullish move up !
Comment and subscribe to help us grow !

GBPUSD Resistance Ahead!
HI,Traders !
#GBPUSD made a rebound
From the support and went
Up but will now retest a
Local horizontal level
Of 1.36793 from where
We will be expecting
A local bearish reaction !
Comment and subscribe to help us grow !

Market Trap Alert! GBP/USD Bearish Robbery Plan🔥💸 "The Cable Heist" – GBP/USD Robbery Plan Using Thief Trading Style 💸🔥
— Unfiltered Forex Forecast with Risky Intentions —
🌍 Hey Money-Makers, Market Hustlers & Chart Bandits! 🤑✈️
Hola! Bonjour! Marhaba! Hallo! Ciao! Welcome to the Forex streets where the smart rob the charts, not banks.
Ready for the GBP/USD Heist? Let’s break it down with our infamous Thief Trading Style – raw, unapologetic, and built for profits.
💼 Operation Name: “The Cable Forex Bank Robbery”
🎯 Pair: GBP/USD – aka “The Cable”
⚔️ Style: Scalp / Day Trade / Swing Heist
📊 Bias: Short (Bearish Setup)
🛠 STRATEGY SETUP: "Follow the Shadows"
🔍 Analysis Basis:
Smart-Money Traps at Key Levels
Oversold ≠ Reversal (Read between the candles)
Liquidity Hunting Zones
Retail Stop Clusters Exposed
Thief-style DCA Entries (Staggered Entry Levels)
Multi-timeframe Confirmation
COT, Sentiment & News-Driven Volatility
🎯 ENTRY ZONE:
Enter short (sell) using 15M or 30M chart.
Sell Limits near recent highs (pullback zone).
DCA (Layered Entry) recommended – Thief loves catching price slipping.
Let the liquidity work for us.
🛑 STOP LOSS (SL):
Base SL around 1.36200 on 2H Chart – above swing high.
Adjust SL per position size and total entries.
Manage risk, but remember: thieves don’t panic, they plan!
🎯 TARGET ZONE:
TP near 1.33800 or adjust using price action.
Escape before target if market mood flips – no need to be greedy.
Trail SLs if market momentum dies down.
👀 Scalpers' Special Note:
Only SHORT — don’t mess with long side unless you’re a liquidity donor.
Quick ins & outs. If you're loaded with capital, jump in big – else follow the swing team.
Use trailing SLs for safety — protect the loot.
📢 FUNDAMENTALS TO WATCH:
News Impacting GBP/USD
COT Reports
Sentiment Indicators
Macro Trends / Yield Spreads
US Dollar Strength Index (DXY)
UK Economic Reports (CPI, GDP, Rate Decisions)
⚠️ RISK MANAGEMENT TIPS:
🚨 Avoid new entries during news releases
🚨 Use trailing stops during volatility spikes
🚨 Secure running trades before major announcements
🚀 Boost the Robbery – Support the Strategy
💖 Smash that BOOST BUTTON if you're vibing with this setup. Help the Thief crew grow stronger!
Let’s keep milking the market 💸 – one “heist” at a time. Stay dangerous, stay smart.
🔓 NOTE: This isn't investment advice. Just a wild trading idea from a chart outlaw.
Always DYOR – Do Your Own Robbery (Research).
Market conditions shift fast. Stay alert, adapt, and respect your capital.
#ForexThiefStyle #CableHeist #GBPUSDShort #SmartMoneyMoves #LiquidityHunters #ChartOutlaws #TradingRebels #DayTradeLife #ScalpersParadise #ForexGang #FXHeistPlans

DeGRAM | GBPUSD forming the falling wedge📊 Technical Analysis
● Price is testing the rising-channel floor (≈1.3500) while carving a bullish falling-wedge; momentum divergence and prior green arrows hint buyers defend this rail.
● A break of 1.3590 (wedge roof / minor trendline) would confirm reversal, opening 1.3680 mid-band, with 1.3770 channel cap next. Risk is limited to a clean H4 close beneath 1.3450.
💡 Fundamental Analysis
● Softer US CPI trimmed two-year Treasury yields, eroding the dollar bid, while UK May GDP surprised to the upside and labour-market tightness keeps BoE “higher for longer” talk alive—narrowing the rate-gap that had weighed on sterling.
✨ Summary
Long 1.3500-1.3560; breakout above 1.3590 targets 1.3680 → 1.3770. Invalidate on H4 close under 1.3450.
-------------------
Share your opinion in the comments and support the idea with a like. Thanks for your support!

DeGRAM | GBPUSD will continue to correct📊 Technical Analysis
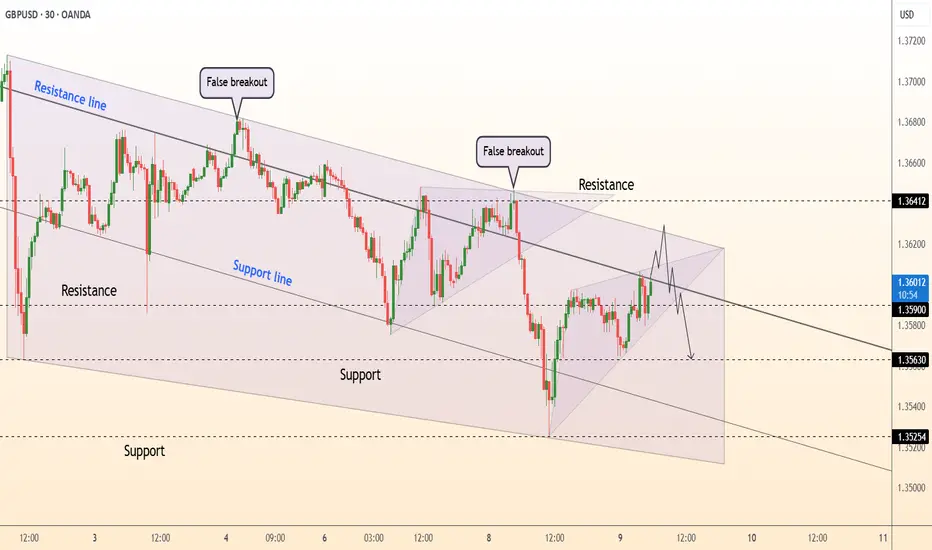
● Two false breakouts at the channel roof (1.3640 ±) underline supply; price is now carving successive lower-highs beneath the blue resistance line inside a 7-day falling channel.
● Fresh bearish rejection of 1.3605 leaves a descending triangle whose base aligns with 1.3563 support; a 30 min close below it exposes the lower rail / June pivot at 1.3525.
💡 Fundamental Analysis
● BoE Chief Economist Pill repeated that “further evidence of disinflation” is needed but rates are “sufficiently restrictive”, reviving August-cut bets, while firm US wage-inflation keeps Fed easing priced farther out—widening the short-rate gap in the dollar’s favour.
✨ Summary
Sell 1.3590-1.3610; break < 1.3563 targets 1.3525. Bear view void on an H1 close above 1.3640.
-------------------
Share your opinion in the comments and support the idea with a like. Thanks for your support!
GBPUSD📌 GBPUSD – Scenario-Based Plan
The first level I’ve marked is a short-term zone.
If we get a strong buy signal there with good R/R, I’ll enter and trail aggressively.
The second level is a stronger demand zone and a better area for potential long setups.
❗️Remember: These are just scenarios — not predictions.
We stay ready for whatever the market delivers.

GBP/USD Rebounds Inside Channel – Long Opportunity in MotionHi traders! Analyzing GBP/USD on the 30-minute timeframe, price is currently respecting a descending channel, showing signs of a bullish bounce after retesting lower support.
🔹 Entry: 1.3586
🔹 Take Profit (TP): 1.3618
🔹 Stop Loss (SL): 1.3555
Price is attempting to recover after holding at the bottom of the channel, and is now pushing toward the 20 EMA. If momentum builds, a retest of the upper trendline and the 1.3618 zone is likely. RSI is slightly recovering from neutral levels, adding confluence to this rebound setup.
This long trade offers a solid risk-to-reward ratio within a possible short-term counter-trend move. Watch closely as price approaches dynamic resistance.
⚠️ DISCLAIMER: This is not financial advice. Every trader is responsible for their own decisions and risk management.

DeGRAM | GBPUSD got out from the triangle📊 Technical Analysis
● Price pierced the blue-labelled trend-line and is threatening to exit a month-long contracting triangle; successive higher lows since 3 Jul show demand absorbing every dip.
● A confirmed H1 close above 1.3650 completes the pattern, unlocking the 1.3700-1.3720 supply zone (June range cap) with measured-move scope toward the broader channel midpoint at 1.3770.
💡 Fundamental Analysis
● Post-election political clarity and an uptick in UK 2-yr gilt yields narrow the policy-gap, while Friday’s softer US NFP trims Fed-rate expectations—both favouring sterling over the dollar.
✨ Summary
Buy 1.3620-1.3650; break >1.3650 targets 1.3700 → 1.3770. Long bias void on an H1 close below 1.3590.
-------------------
Share your opinion in the comments and support the idea with a like. Thanks for your support!

#GBPUSD: A strong bullish move incoming, comment your views The price has shown a possible price divergence, which could lead to a long-term move to 1.37. We expect the US dollar to weaken, which will likely push the price of GBPUSD to our target. Key economic data will be released later today and tomorrow, which could shape the price pattern.
Good luck and trade safely!
Team Setupsfx_

DeGRAM | GBPUSD will continue to correct📊 Technical Analysis
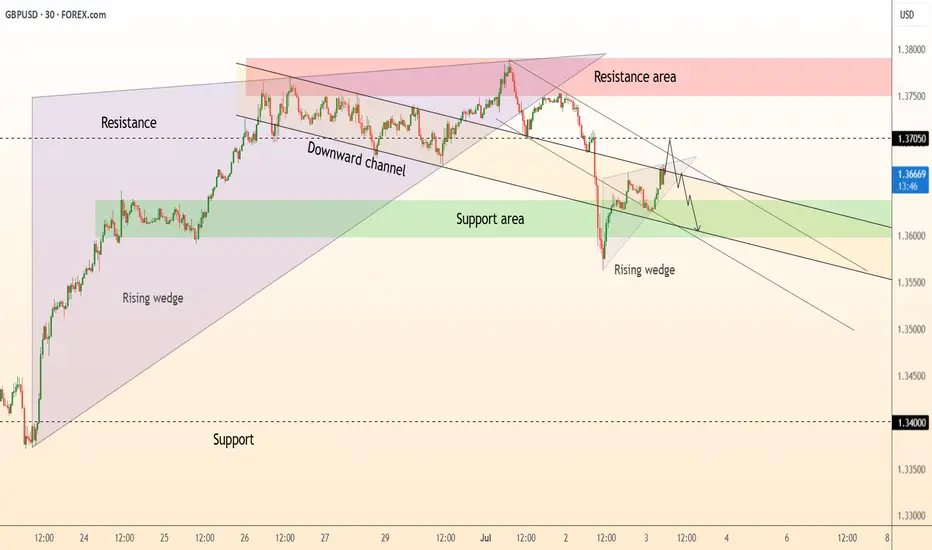
● Price retests the broken wedge-base & channel roof ≈ 1.370 inside a confluence resistance zone (pink). Lower-highs into this cap form a bear flag pointing toward 1.360.
● Intraday rising-wedge has already cracked; projected width and the broader descending channel intersect 1.352-1.355, reinforcing downside targets.
💡 Fundamental Analysis
● Softer UK PMI prices and pre-election caution keep BoE-cut probabilities elevated, while a stronger US JOLTS print plus hawkish FOMC minutes underpin the dollar, favouring renewed GBP/USD pressure.
✨ Summary
Fade rallies 1.368-1.372; slide below 1.360 unlocks 1.355 then 1.343. Bear thesis invalid on a 30 min close above 1.374.
-------------------
Share your opinion in the comments and support the idea with a like. Thanks for your support!
GBPUSD UPDATE (NICE CHART)Hello friends
Given the failure of the pain and the strong growth of the price, you can see that the price is in correction, which is a good opportunity for safe purchases at the indicated support points, of course with capital and risk management...
*Trade safely with us*

GBPUSDGBPUSD also needs one more push up once the correction is completed. Correction needs more time, perhaps this week drop and next week more upside.
Disclosure: We are part of Trade Nation's Influencer program and receive a monthly fee for using their TradingView charts in our analysis.

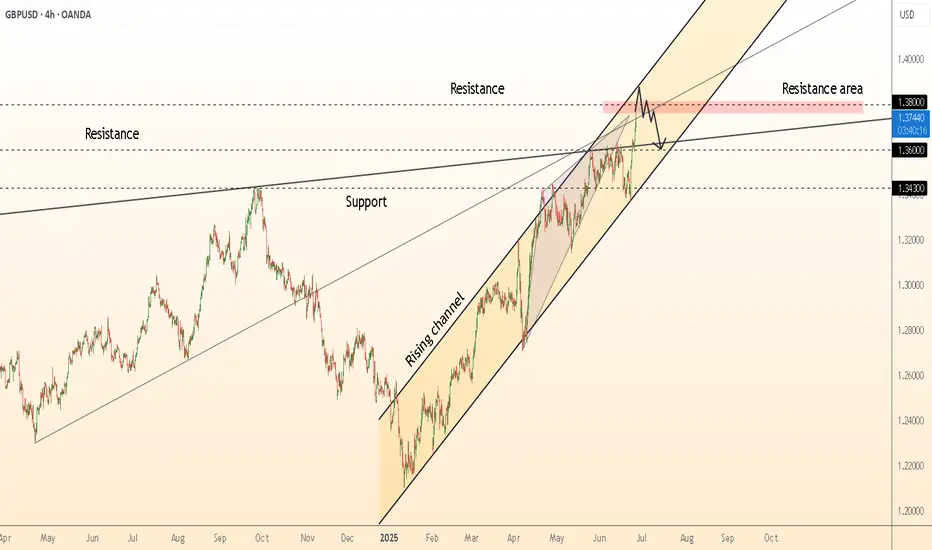
DeGRAM | GBPUSD preparing for a correction📊 Technical Analysis
● Cable is pressing the rising-channel ceiling together with the March swing-high supply at 1.378-1.380; successive long-upper-wicks plus fading 4 h RSI signal bull exhaustion at this dual resistance.
● A tiny evening-star has formed inside the pink resistance band and price is slipping back under the broken inner trend-line; first objective is the former breakout shelf / median line near 1.360, with the lower rail and April pivot at 1.343 next in view.
💡 Fundamental Analysis
● UK election blackout, soft retail-sales surprise and firmer month-end USD funding bids narrow the short-rate gap again, sapping fresh sterling demand.
✨ Summary
Short 1.374-1.380; sustain below 1.360 opens 1.343. Bear view void on a 4 h close above 1.380.
-------------------
Share your opinion in the comments and support the idea with a like. Thanks for your support!
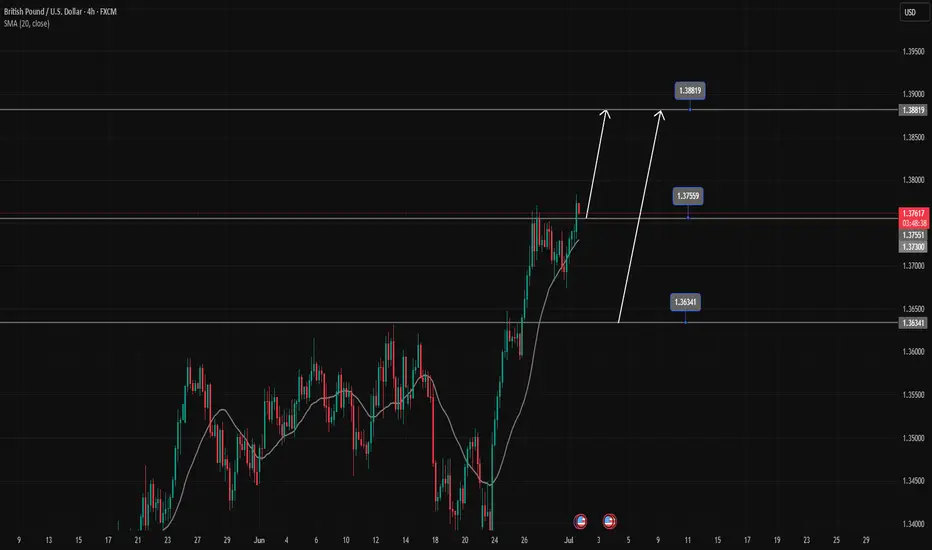
GBPUSD's strong uptrend continuesGBPUSD is in a strong uptrend, Price has just broken the resistance zone of 1.37500.
All the bullish momentum is heading towards the resistance zone of 1.388.
If there is a close of the h4 candle below the resistance zone of 1.375, there will likely be a Pullback to 1.363 to find more buying momentum towards the target at the resistance zone of 1.388
📈 Key Levels
Support: 1.375-1.363
Resistance: 1.388
📊 Recommended Trade Setups
BUY GBPUSD 1.375-1.373 Stoploss 1.37000
BUY GBPUSD 1.363-1.361 Stoploss 1.35800
SELL GBPUSD 1.388-1.390 Stoploss 1.39300
GBPUSD: Targeting 1.4200 Swing Move Target! Swing Trading GBPUSD: We’ve identified a key reversal zone where our long-term take-profit target is set at 1.4200. This is a long-term approach, but in the short term, we could target 1.3900, which is a reasonable take-profit area. Before taking any buying entry, please do your own analysis.
Good luck and trade safely!
Like
Comment
Share
Team Setupsfx_
