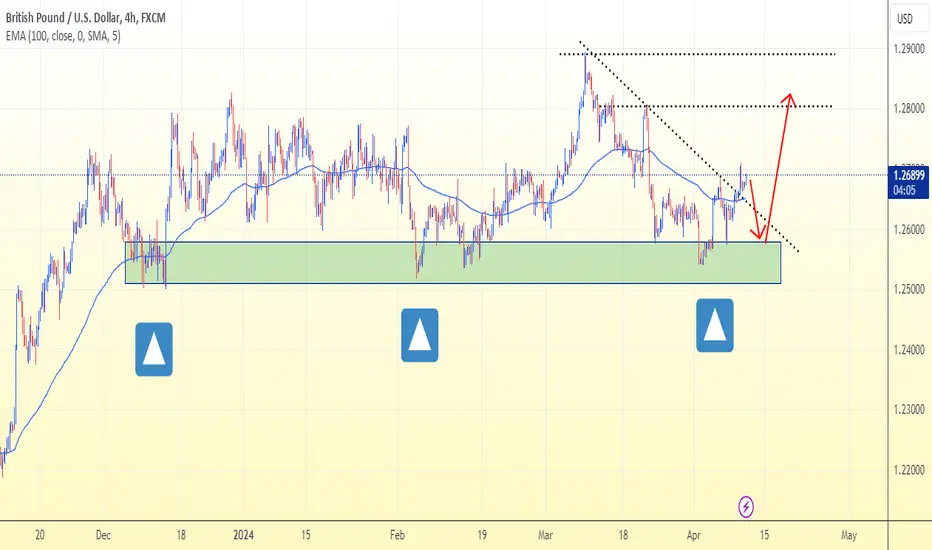
GBPUSD Long 100 pips target with 1.2540 SLGBPUSD Long 100 pips target with 1.2540 SL
There is a triple bottom which is pointed with green dots on 4H timeframe and there are triple bottom in 1H TF at 1.2542
Price breaching 1.2542 should trigger SL
Daily TF:
4H TF:
1H TF:
Gbpusdsignal

gbpusd long signalGBP/USD is the forex ticker that shows the value of the British Pound against the US Dollar. It tells traders how many US Dollars are needed to buy a British Pound. The Pound-Dollar is one of the oldest and most widely traded currency pairs in the world. Follow the live GBP/USD rate with the chart and keep up to date with Pound-Dollar news and analysis. Plan your trades with the GBP/USD forecast and key pivot points data and support and resistance levels.
GBP/USD extends losses and trades at fresh multi-month lows below 1.2450 even after the January month UK GDP was revised higher to 0.3%. The negative shift seen in risk mood fuels another leg higher in the USD and drags the pair lower.
GBP/USD stays in the lower half of the descending regression channel and the Relative Strength Index (RSI) indicator on the 4-hour chart holds slightly above 30, suggesting that the pair has some more room on the downside before turning technical oversold.
1.2500 (static level, psychological level) aligns as first support before 1.2450 (lower limit of the descending channel) and 1.2420 (static level from November). On the upside, first resistance is located at 1.2550 (mid-point of the descending channel) before 1.2590 (200-day Simple Moving Average).

GbpUsd could dive at least 500 pips if not even moreFor nearly six months, the price action of FX:GBPUSD has been rather dull, to say the least, with the pair confined within a 250-pip range. This stagnation is particularly notable for a pair as volatile as the cable.
However, upon examining a weekly chart, we can draw some conclusions and gain perspective on potential future movements. Three factors lead me to believe that a drop of at least 500 pips is in the cards for GBP/USD:
1. We've witnessed a false breakout to the upside, and typically, in the case of false breakouts, the asset tends to break in the opposite direction.
2. It's highly likely that this week will conclude with a bearish engulfing pattern on our chart.
3. Although not textbook-perfect, the structure of the last six months resembles a head and shoulders pattern.
Considering these factors collectively, I anticipate a downward break, with the initial support just above 1.2 coming into focus.
P.S: Given the pair's volatility and prolonged range-bound trading, in the event of a downward break, the movement could be quite violent. I wouldn't be surprised if we see a drop of 1,000 pips.

GBPUSD buy setupIf you're interested to trade Gbpusd look for buy opportunities. Set a buy limit at 1.24800

GBPUSD: UPDATE 11/04/2024Dear Traders,
Hope you are doing great, we have an excellent buying opportunity. Yesterday price fell significantly mainly due to news came out in favour of USD, making usd the strongest currency against others. This brought huge selling volume in the market, leading our last GBPUSD idea to fail badly. The reason why we think price may rise due to so many gaps price has left behind. In our view price is likely to fill the liquidity void area before its next big move.
If you like our idea then do consider liking and commenting.

GBP/USD back to support level, time to buy?Hello traders, in my yesterday's GBP/USD analysis published 2 hours before the US CPI data release, I predicted that GBP/USD will most likely fall towards the support level near 1.2550. (previous idea attached below)
As you can see, GBP/USD is back to the support zone, price went as low as 1.2520. So, I am looking at the possibility of a buy entry here. If price doesn't break this support zone, I would recommend buying GBP/USD@1.2520-1.2545, with Stop loss below 1.2480 and TP at 1.2660 and 1.2710

GBPUSD BUY | Trading Analysis SetupHello Traders, here is the full analysis.
The completed correction, recovery and formation, continuation of growth. GOOD LUCK! Great BUY opportunity GBPUSD
I still did my best and this is the most likely count for me at the moment.
Support the idea with like and follow my profile TO SEE MORE.
Traders, if you liked this idea or if you have your own opinion about it, write in the comments. I will be glad 🤝
Patience is the If You Have Any Question, Feel Free To Ask 🤗
Just follow chart with idea and analysis and when you are ready come in THE GROVE | VIP GROUP, earn more and safe, wait for the signal at the right moment and make money with us💰

How will US CPI data impact GBP/USD?Hello traders, with CPI data coming out in less than 4 hours, let us take a look at the
4H chart of GBP/USD.
The situation on the 4H chart is definitely bullish as price has bounced off the 1.2540
support level and currently it is consolidating above the 100 period moving average.
However, spikes or dips during CPI can not be ruled out.
So, is there is a dip to the support zone or at least 1.26 level, I would consider buying
GBP/USD. Similarly, if it spikes up to 1.28 and fails to break 1.28, I would consider selling.
Either way, I would trade after the data is released.
The GBP didn't short itself. If one would have checked the recent flightlogs of the GBP performance he might have been astounded what he would discover:
GBP emerges from the first trading week of the year as the strongest currency and the signs look great for a further rally of the pound:
🟢GBP Positive:🟢
- 🟢 The PMIs in the UK have recently surprised on the upside and so there is light at the end of the tunnel, in contrast to the European counterpart, which has only surprised with more and more negative PMIs
- 🟢 Although wage pressure is falling, it remains high by international standards
- 🟢 There are signs of a recovery in both retail sales and GDP for 2024
- 📊🇬🇧 Inflation will fall quickly and reach 2% mark as early as Q2 2024🟢
- 🟢 That said given the better economic performance it is doubtful whether the BOE will actually cut interest rates as early as its sister from the ECB
-> 🟢 I think May would be a realistic scenario for a 1st rate cut by the BOE ✅️
But as every story that sounds to good to be true, the longterm outlook brings some serious concerns for the so far marvellous UK dream story:
🔴GBP Negative:🔴
- 🔴GDP was recently significantly weaker (-0.3) than expected (0.0)
- 🔴Industrial production also surprised negatively in relation to expectations at 0.4
- 🔴However, the significantly weaker labour data recently, in which bonus payments in particular surprised to the downside and raised one question in particular, weighs even more heavily and will bring much more rate cuts forward than the BOE and the market are expecting right now.
Conclusion:
The outlook for the pound is starting to brighten, but overall the negative factors are likely to outweigh against the USD in the longterm and so I see a promising opportunity to short the GBPUSD (after another rally) from way above.
The 1.32 - 1.33 zone would be ideal.
(For everyone who made it this far I have an extra for you:
A small quiz in the comments ;)
If someone wants to buy the GBP now, a long trade in GBPCHF is a good idea, which I explain in my following trade idea here:

GBP USD Sell Confirm GBP/USD is the forex ticker that shows the value of the British Pound against the US Dollar. It tells traders how many US Dollars are needed to buy a British Pound. The Pound-Dollar is one of the oldest and most widely traded currency pairs in the world. Follow the live GBP/USD rate with the chart and keep up to date with Pound-Dollar news and analysis. Plan your trades with the GBP/USD forecast and key pivot points data and support and resistance levels.
GBP/USD reverses its recent uptrend and accelerates its losses to the key 1.2600 level on the back of increased buying pressure in the US Dollar.
The Relative Strength Index (RSI) on the 4-hour chart stays above 60, reflecting the bullish bias. More importantly, GBP/USD closed above 1.2660 on Tuesday, where the 20-day, 50-day and the 100-day Simple Moving Averages (SMA) converge.
Confirm GBP USD signal

GBPUSD I Potential buy from demand zone Welcome back! Let me know your thoughts in the comments!
** GBPUSD Analysis - Listen to video!
We recommend that you keep this pair on your watchlist and enter when the entry criteria of your strategy is met.
Please support this idea with a LIKE and COMMENT if you find it useful and Click "Follow" on our profile if you'd like these trade ideas delivered straight to your email in the future.
Thanks for your continued support!

#GBPUSD: We are bullish now| 09/04/2024 | Setupsfx_|Dear Traders,
Regarding GBPUSD, we have observed a shift in momentum, presenting an opportunity to fill gaps in the market. Currently, the price is exhibiting significant bullish pressure and is likely to maintain this trend. We recommend considering both entry points, with a backup option in case the first fails. This trade has the potential to be lucrative if appropriate risk management is employed.

Gbpusd shortGBP/USD is the forex ticker that shows the value of the British Pound against the US Dollar. It tells traders how many US Dollars are needed to buy a British Pound. The Pound-Dollar is one of the oldest and most widely traded currency pairs in the world. Follow the live GBP/USD rate with the chart and keep up to date with Pound-Dollar news and analysis. Plan your trades with the GBP/USD forecast and key pivot points data and support and resistance levels.
GBP/USD edged lower in the early American session but managed to hold above 1.2650. The negative shift seen in risk mood, as reflected by falling US stocks, makes it difficult for the pair to stretch higher.
The USD risk is skewed to the upside, as recent US data has endorsed a “no landing” scenario, that would be confirmed in case of another upside surprise on inflation. Recent hints on wage growth and industrial prices are pointing to resilient inflation.
The technical picture shows the Pound under an increasing momentum, although the failure to confirm above the 1.6680-1.6700 area leaves the broader bearish trend intact. On the downside, supports are 1.6575 and 1.6535.

BUY GBP/USDAs you can notice on the chart the market is coming down to the area where we have our OB placed, BUY GBP/USD at 1.26628 and set your TP and SL as sat on the chart!
For further questions, the comment section is all yours!

GBPUSD Trade Idea - Important Points To ConsiderIn the video, we analyse a potential trading opportunity for the GBPUSD. We delve into the prevailing trend, examine price movements, evaluate market structure, and pinpoint a potential entry point based on favourable conditions (if they arise), as outlined in the video. Additionally, I discuss my risk management strategy. Traders who lack a robust risk management plan expose themselves to significant risk and often encounter negative trading outcomes. It is crucial to incorporate sound risk management principles into your trading strategy. As always, please be aware that this information is strictly for educational purposes and should not be construed as financial advice.

GBPUSD - Upside move ✅Hello traders!
‼️ This is my perspective on GBPUSD.
Technical analysis: As we can see here price filled the imbalance lower and then rejected from bullish order block. I expect to see bullish continuation and my target is imbalance around 1.27250.
Fundamental news: This week on Wednesday we have monthly and yearly CPI on USD and on Thursday monthly PPI, news with high impact on currency.

GBP USD long GBP/USD is the forex ticker that shows the value of the British Pound against the US Dollar. It tells traders how many US Dollars are needed to buy a British Pound. The Pound-Dollar is one of the oldest and most widely traded currency pairs in the world. Follow the live GBP/USD rate with the chart and keep up to date with Pound-Dollar news and analysis. Plan your trades with the GBP/USD forecast and key pivot points data and support and resistance levels.
The Relative Strength Index (RSI) indicator holds slightly above 50 and GBP/USD closed above the 200-day Simple Moving Average (SMA) for the second straight on Tuesday. The pair, however, failed to clear the 100-day SMA at 1.2670.
Confirm long Target

GBPUSD CHARTGBP/USD is the forex ticker that shows the value of the British Pound against the US Dollar. It tells traders how many US Dollars are needed to buy a British Pound. The Pound-Dollar is one of the oldest and most widely traded currency pairs in the world. Follow the live GBP/USD rate with the chart and keep up to date with Pound-Dollar news and analysis. Plan your trades with the GBP/USD forecast and key pivot points data and support and resistance levels.
GBP/USD benefits from the improving risk mood and trades above 1.2600 in the American session. Earlier in the day, stronger-than-forecast NFP growth data from the US provided a boost to the USD and weighed heavily on the pair.
The Relative Strength Index (RSI) indicator holds slightly above 50 and GBP/USD closed above the 200-day Simple Moving Average (SMA) for the second straight on Tuesday. The pair, however, failed to clear the 100-day SMA at 1.2670.
In case GBP/USD flips 1.2670 into support, technical buyers could show interest. In this scenario, 1.2710 (Fibonacci 50% retracement of the latest downtrend) could be seen as first resistance before 1.2750 (Fibonacci 61.8% retracement).

GBPUSDPair : GBPUSD ( British Pound / U.S Dollar )
Description :
Bullish Channel as an Corrective Pattern in Short Time Frame with the Breakout of Lower Trend Line
RSI - Divergence
Break of Structure
Fibonacci Level - 61.80%

120+ Pips profit secured, more uptrend in GBP/USD?Hello traders, in our idea published yesterday, we advised buying GBP/USD@1.2540 zone
as it was a support level. Currently, with price at 1.2661, the buy trade is in over
120 pips profit .( We have linked the previous idea below for you to cross-check)
Now, let us take a look at the daily chart. We can clearly see that price has climbed back
above the 100-day EMA level. This is a bullish sign The immediate resistance now lies
at the 1.2670 level, which if broken would take the price towards 1.28.
Our plan is to keep holding our buys from 1.2540 level and in case there is another dip,
we will load some buys again.

Gbpusd trading idea is ready today make move up trend ✅✅Hi Traders GBPUSD price is ready to fly
GBPUSD is currently experiencing a worldwide
Up trend has reached its highest price ever
I predict that the market will bounce back
From the resistance level move towards the Nearby support level
Gbpusd buy from 1.25777
Target zone 1.28000
If this post is useful for you
You can support me with like
And advice comments

GBPUSD idea is ready 🎯🎯GBPUSD price trend to continue buy during session
It is expected that price will continue in the up trend
And can approach the price range of 1.26573
Target zone 1.28166
Note:
Always wish you to manage your capital safe
Take small lots of which suits your capital
The winner is the one who sticks with the market
Give us like and support us

GBP/USD back to support level, price may rebound a bitHello traders, as I had predicted a week ago, GBP/USD fell after hitting the
1.28 resistance level. Currently, price is back at the 1.2530 zone.
Please note that, there is a likelihood of further rebound in GBP/USD . Price has
already rebounded more than 40 pips. We have already bought GBPUSD 1.2540 with
initial target at 1.2650
If price dips again, I recommend traders to buy GBPUSD@1.2520-1.2540 with Stop loss
under 1.25 and ititial TP at 1.2650
However, a fall below the 1.25 level would be bad for the bulls, so I advise everyone to
apply proper money management while buying
