GBPUSD: The Big Short Opportunity?(Breakout Confirmation Needed)🚨 GBP/USD BANK HEIST ALERT: The Bearish Robbery Plan (Swing/Day Trade) 🚨
🔥 Steal Pips Like a Pro – Thief Trading Strategy Inside! 🔥
🌟 GREETINGS, MARKET PIRATES! 🌟
🤑 To all the Money Makers, Risk Takers & Midnight Breakers!
Based on our 🔥Thief Trading Style🔥 (a deadly mix of technical + fundamental + intermarket analysis), we’re plotting a massive bearish heist on GBP/USD ("The Cable").
This is not financial advice—just a strategic robbery plan for those who dare to trade smart.
📉 THE HEIST STRATEGY (SHORT ENTRY FOCUS)
🎯 Target Zone: 1.32300 (or escape earlier if the market turns)
⚡ High-Risk, High-Reward Play: Oversold market, consolidation, trend reversal setup.
💣 Trap Level: Where bullish traders get wrecked.
🔑 ENTRY RULES:
"The Heist is ON!" – Wait for breakout confirmation at 1.33800 before striking.
Sell Stop Orders below breakout MA OR Sell Limit Orders (15-30 min timeframe).
Retest Entry? Ideal if price retraces to recent low/high before dropping.
📌 ALERT SETUP: Don’t miss the breakout—set a chart alert!
🛑 STOP LOSS (Risk Management):
Thief SL at 1.34800 (Swing/Day Trade basis – 3H period).
🚨 Pro Tip: "Yo, rebels! You can place SL wherever you want… but if you ignore this level, don’t cry later. Your risk, your rules."
🎯 PROFIT TARGET:
First Take-Profit: 1.32300 (or bail earlier if momentum fades).
Scalpers: Ride the short side only. Use trailing SL to lock profits.
📰 FUNDAMENTAL BACKUP (Why This Heist Works)
Before executing, check:
✅ COT Report (Are big players dumping GBP?)
✅ Macro News (UK vs. USD economic strength)
✅ Intermarket Analysis (DXY, Bonds, Equities correlation)
✅ Sentiment & Seasonality (Is the crowd too bullish?)
⚠️ WARNING: NEWS & VOLATILITY ALERTS
Avoid new trades during high-impact news (unless you love gambling).
Use trailing stops to protect profits if the market flips.
💥 BOOST THIS HEIST! 💥
🚀 Like & Share to strengthen our Thief Trading Squad!
💸 More heists = More profits. Stay tuned for the next robbery plan!
🤑 See you on the profitable side, bandits! 🏴☠️
🔴 DISCLAIMER: This is entertainment, not financial advice. Trade at your own risk.
#Forex #GBPUSD #TradingStrategy #ThiefTrading #BankHeist #SwingTrading #DayTrading
💬 COMMENT BELOW: Are you joining the heist or waiting for a better setup? 🚨👇
Gbpusdsignal

GBP/USD Robbery: Can You Grab the Cash Before the Cops Arrive?🚨 GBP/USD "The Cable" forex bank Heist Alert: The Bullish Breakout Robbery Plan (Swing & Scalp Strategy) 🚨
🌟 Hi! Hola! Ola! Bonjour! Hallo! Marhaba! 🌟
Attention Money Makers & Market Robbers! 🤑💰💸
Based on the 🔥Thief Trading Style🔥, here’s our master plan to loot the GBP/USD "The Cable" forex bank. Follow the strategy on the chart—focusing on LONG entries—and escape near the high-risk Red Zone. This area is overbought, consolidating, and a potential reversal trap where bears lurk. 🏆 Take profits fast—you’ve earned it! 💪
🎯 Heist Entries:
📈 Entry 1: "The Breakout Heist!" – Wait for Resistance (1.36200) to break, then strike! Bullish profits await.
📈 Entry 2: "Big Players’ Pullback!" – Jump in at 1.34000+ buy above at any price for a safer steal.
🔔 Pro Tip: Set a chart alert to catch the breakout instantly!
🛑 Stop Loss Rules:
*"Yo, listen! 🗣️ If you’re entering with a buy-stop, DON’T set your SL until AFTER the breakout. Place it at the nearest swing low (3H timeframe) or wherever your risk allows—but remember, rebels risk more! 🔥"*
🏴☠️ Target: 1.37500
🧲 Scalpers: Only play LONG! Use trailing SL to lock in profits. Big wallets? Go all in. Small stacks? Join the swing heist!
📊 Market Pulse:
The GBP/USD "The Cable" is neutral but primed for bullish momentum. Watch:
Fundamentals (COT, Macro, Geopolitics)
Sentiment & Intermarket Trends
Positioning & Future Targets & Overall score
📌 Check our bioo linkks for deep analysis! 🔗🌍
⚠️ Trading Alert:
News = Volatility! Protect your loot:
Avoid new trades during major news
Use trailing stops to secure profits
💥 Boost This Heist!
Hit 👍 & 🔄 to strengthen our robbery crew! Let’s dominate the market daily with the Thief Trading Style. 🚀💵
Stay tuned—another heist drops soon! 🎯🐱👤

GBP/USD HEIST ALERT: Bullish Breakout or Bearish Trap?🌟 Hey! Hola! Ola! Bonjour! Hallo! Marhaba! 🌟
Calling all Market Robbers & Profit Pirates!💸💰
🔥 Thief Trading Intel: Our crew’s latest heist targets GBP/USD "The Cable"—bullish breakout incoming! Long entry only. High-risk Red Zone ahead: overbought, consolidating, and ripe for a reversal. Don’t get caught in the bear trap! 🏴☠️
"Take your loot and run, trader—you’ve earned this steal!" 💪🎯
🚪 ENTRY: The Heist Begins!
📈 "Wait for MA breakout (1.36000) then STRIKE—bullish profits await!"
Option 1: Buy Stop above Pink Resistance (breakout confirmation).
Option 2: Buy Limit at swing low/high (15-30 min TF).
📌 Pro Tip: SET AN ALERT! Don’t miss the breakout.
🛑 STOP LOSS: Escape Route
🔊 "Yo, listen up! 🗣️
Buy Stop orders? NO SL until after breakout! 🚀
Rebels: Place SL wherever—but you’ve been warned! ⚠️🔥
📍 Thief SL (Smart Crew): Recent/swing low (1.35000, 4H TF).
📍 Adjust based on your risk, lot size, and orders.
🎯 TARGET: Loot & Exit!
🎯 1.37500 (or escape early if the market turns!)
⚡ SCALPERS’ QUICK GRAB
👀 Long scalps ONLY!
Big wallets? Raid now.
Small stacks? Join swing traders.
Trailing SL = Your Money Shield! 🛡️💰
📢 WHY THIS HEIST? (GBP/USD Bullish Momentum)
"The Cable" is heating up! Key drivers:
Fundamentals (COT, Macro Data)
Sentiment & Intermarket Trends
Future Targets & Score Outlook
🔗 Full intel? Bio links below! 👉👉
⚠️ TRADING ALERT: News = Danger Zone! 📰🚨
News = Volatility Spikes! Protect your loot:
❌ Avoid new trades during news.
🔒 Trailing SL = Profit Lock.
💖 SUPPORT THE HEIST CREW!
💥 SMASH THAT BOOST BUTTON! 💥
More boosts = easier money grabs!
Stronger crew = bigger heists!
Profit daily with Thief Trading Style! 🏆🚀
Next heist coming soon—stay tuned! 🤑🐱👤🤩

GBPUSDCable still have some upside towards the level highlighted on the chart.
Disclosure: We are part of Trade Nation's Influencer program and receive a monthly fee for using their TradingView charts in our analysis.

gbpusdThere is a high probability of a reversal within the specified range
The daily trend line at the ceiling has also caused the price to reverse
The sell order has a higher probability of success than the specified targets
The risk to reward is excellent

High-Reward GBPUSD Setup: Entry 1.3598, TP 1.3867, SL 1.3478The GBP/USD pair has recently shown a clean bullish breakout from a short-term consolidation zone. Price has decisively moved above the 1.3478–1.3480 support-turned-resistance level, which previously acted as a ceiling within a rising channel. This breakout is meaningful—it comes after a retracement toward the lower boundary of the ascending structure, suggesting that buyers are once again gaining control.
The recent bullish candle has closed strong and full-bodied, indicating momentum. Historically, as you mentioned, GBPUSD tends to follow through for a few sessions once a bullish breakout begins. This is visible in prior moves throughout March and April, where an initial spike was often followed by two or three additional bullish candles. That behavior adds confluence to this setup.
Moreover, there is a clear path for price to move toward the long-term resistance near 1.3867, which aligns well with prior supply zones and the upper boundary of historical price reactions.
📈 Trade Idea
• Entry: 1.3598 (current price after breakout confirmation)
• Stop Loss: 1.3478 (just below the support flip and last swing low)
• Take Profit: 1.3867 (next major resistance level)
• Risk–Reward Ratio: ~2.24:1
This setup offers a clean bullish continuation pattern with room to run. If the pair maintains its current momentum, reaching the target in the next few trading days is entirely plausible. Any daily close above 1.3600 with volume would further validate the trend.

How I’m Planning My Next GBPUSD Trade Setup📉 GBPUSD Analysis Update
Currently keeping a close eye on GBPUSD 👀. On both the Daily and 4H charts, we’ve seen a strong bullish rally, driving price into a premium zone and tapping into key buy-side liquidity resting above previous highs 🔼💧.
The pair now appears overextended and is trading into a significant resistance level 🧱. Given this context, I’m anticipating a potential retracement. If we see a pullback followed by a clean bullish break in market structure, that’s when I’ll be looking to enter a long position 🎯📈.
⚠️ As always, this is not financial advice — just sharing my personal view of the markets.

Technical + Fundamental Alignment: GBPUSD Short in PlayGBPUSD ( FX:GBPUSD ) is moving near the Resistance zone($1.354-$1,350) and has managed to break the Support line .
In terms of Elliott Wave theory , it seems that GBPUSD has completed the Zigzag Correction(ABC/5-3-5) , we can expect the next five bearish waves .
--------------------------------------------------------
Fundamental Analysis
1-Weak UK Economic Data:
Recent reports including Retail Sales, Industrial Output, and PMIs have come in below expectations.
Labour market is softening, and wage growth is decelerating.
2-Dovish Expectations for BoE:
With inflation cooling down, the Bank of England is expected to hold or even cut rates soon, reducing support for the pound.
3-Stronger USD Outlook
Despite some weaker U.S. data, the Fed maintains a hawkish stance. U.S. retail sales and inflation still support the dollar overall.
4-UK Political Risk
Upcoming UK elections on July 4 are adding uncertainty and downside risk to GBP.
--------------------------------------------------------
I expect GBPUSD to attack at least the Support lines based on the above explanation.
Targets: 1.3
1)1.3353 USD =>Risk-To-Reward: 1.51
2)1.3315 USD =>Risk-To-Reward: 2.00
Note: Stop Loss(SL): 1.3549 USD
Please respect each other's ideas and express them politely if you agree or disagree.
British Pound / U.S Dollar Analyze (GBPUSD), 1-hour time frame.
Be sure to follow the updated ideas.
Do not forget to put a Stop loss for your positions (For every position you want to open).
Please follow your strategy and updates; this is just my Idea, and I will gladly see your ideas in this post.
Please do not forget the ✅' like '✅ button 🙏😊 & Share it with your friends; thanks, and Trade safe.

GBPUSD– Rejection at Resistance: Technical and Macro PullbackGBPUSD has climbed back into a strong multi-week resistance zone just beneath 1.3670. While the recent rally was sharp, it now confronts both structural resistance and weakening UK fundamentals. The British economy is losing steam—GDP contracted more than expected, manufacturing output is weak, and the latest CBI survey paints a grim industrial outlook. Meanwhile, Fed officials continue to push back on early rate cut expectations, lending resilience to the USD. Technically, this aligns with a potential top forming near 1.3630–1.3670, offering a compelling risk-reward for sellers.
🔻 Bias: Bearish
• Favoring short setups from resistance, backed by weak UK data and a sticky Fed narrative.
🔑 Key Fundamentals
🇬🇧 UK:
May GDP: –0.3% m/m (worse than forecast)
CBI Industrial Trends: Output volumes and orders well below long-run average
Inflation slowing, but BoE hesitant amid stagnant growth – classic stagflation
🇺🇸 US:
Fed officials (Barkin, Collins, Cook) emphasize caution
Core services inflation still elevated
Fed rate cuts now expected in September, not July
⚠️ Risks to the Bearish View
Hawkish surprise from the BoE (if they hike or signal tightening)
U.S. Core PCE comes in soft, pressuring the USD
Sustained global risk-on rally pulling GBP higher via equities
📅 Important Events to Watch
June 25–26: Fed Chair Powell testimony to Congress
June 28: U.S. Core PCE inflation report
UK CPI revisions, retail sales, and BoE commentary
U.S. jobs and consumer confidence (early July)
📉 Technical Setup – Short from Key Supply Zone
Chart Structure:
Major confluence resistance at 1.3625–1.3665 (blue zone)
Multiple rejection wicks + ascending wedge structure
Bearish divergence building on momentum (not shown)
🎯 Trade Setup:
Entry Zone:
🔹 Sell between 1.3625 and 1.3665, ideally after a bearish engulfing/pin bar or 4H rejection
Take Profits:
TP1: 1.3535 – local support
TP2: 1.3465 – fib and horizontal confluence
TP3: 1.3390 – wedge breakdown target
Stop Loss / Invalidation:
🔸 SL above 1.3685**
A 4H/1D candle close above invalidates the setup and opens the door to new highs.
Risk-Reward:
RR to TP1: ~1.8
RR to TP3: 3.5+
🧭 Summary:
GBPUSD is technically stretched and facing key resistance. With UK macro data deteriorating and Fed members holding the line, this rally looks increasingly vulnerable. As long as 1.3685 holds, sellers may dominate with clear downside targets over the next 1–2 weeks.

Bearish GBP/USD Outlook: Shorting the Pound Against the DollarI can write a lot of text here but let make it short, liek and sub from you for that:
3 options:
pump till PDH then dump to weekly FVG 1.34 area
dump from here till weekly FVG 1.34 area
if it breaks above PWH with good volume and closing at least on 4h then only longs

GBP/USD Potential Bullish ReversalGBP/USD Potential Bullish Reversal 📈🦾
📊 Technical Analysis Overview:
The chart showcases a well-defined horizontal range between the support (~1.31900) and resistance (~1.36200) zones. The price action has respected these levels multiple times, forming a clear accumulation zone at the bottom and rejection at the top.
🔄 Pattern Formation:
A Rounded Bottom (Cup) structure is visible forming from the June low.
The price made a bullish bounce near the key support level at 1.33930, marked by an orange circle, suggesting a potential higher low formation.
The blue downtrend line from the recent high (red arrow) has been broken, indicating a trend reversal attempt.
📍 Current Price: 1.34494
🎯 Target Zone: 1.35734
🛑 Support to Watch: 1.33930
📈 Bullish Confirmation:
A break above the minor neckline (around current price) would confirm a cup & handle breakout with a projected target of 1.35734.
Strong buying pressure and higher lows are reinforcing bullish strength.
⚠️ Risk Management Tip:
A breakdown below 1.33930 would invalidate the bullish setup and could retest the major support zone (~1.31900).
✅ Bias: Bullish, unless price closes below 1.33930
🕒 Outlook: Short- to Mid-term Upside Potential

GBPUSD(20250620)Today's AnalysisMarket news:
The Bank of England kept interest rates unchanged at 4.25%, and the voting ratio showed that internal differences were increasing. Traders expect the bank to cut interest rates by another 50 basis points this year.
Technical analysis:
Today's buying and selling boundaries:
1.3439
Support and resistance levels:
1.3526
1.3494
1.3473
1.3406
1.3385
1.3353
Trading strategy:
If it breaks through 1.3473, consider buying, and the first target price is 1.3494
If it breaks through 1.3439, consider selling, and the first target price is 1.3406

GBPUSD I Technical & Fundamental Forecast Welcome back! Let me know your thoughts in the comments!
** GB{USD Analysis - Listen to video!
We recommend that you keep this pair on your watchlist and enter when the entry criteria of your strategy is met.
Please support this idea with a LIKE and COMMENT if you find it useful and Click "Follow" on our profile if you'd like these trade ideas delivered straight to your email in the future.
Thanks for your continued support!Welcome back! Let me know your thoughts in the comments!

Analysis of GBPUSD 1-Hour Chart Signaling Bullish TrendAnalysis of GBP/USD 1-Hour Chart Signaling Bullish Trend 📈
I. Support Levels & Chart Patterns
Support Confirmation
After testing the 1.34135 support zone, price rebounded sharply with consecutive bullish candles 🚀, forming a potential "double bottom" pattern (or wave low). This successful defense of support reinforces the foundation for upward movement 🏗️.
Resistance Breakout Potential
Price is currently advancing from the 1.34600 short-term support. The key resistance lies at 1.35160. A decisive breakout above this level would validate the bullish projection indicated by the upward arrows on the chart 🎯
⚡️⚡️⚡️ GBPUSD ⚡️⚡️⚡️
🚀 Buy@ 1.33500 - 1.34000
🚀 TP 1.35000 - 1.35500
Accurate signals are updated every day 📈 If you encounter any problems during trading, these signals can serve as your reliable guide 🧭 Feel free to refer to them! I sincerely hope they'll be of great help to you 🌟 👇

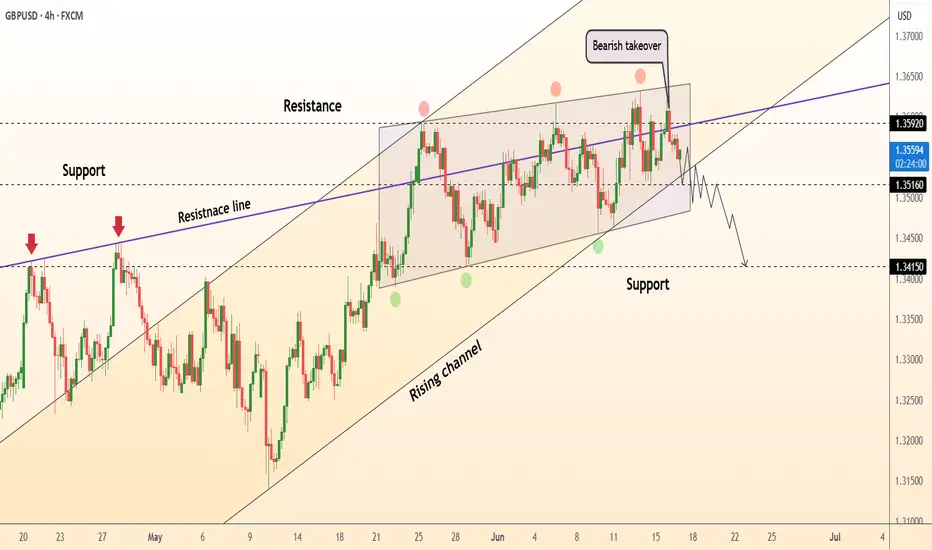
DeGRAM | GBPUSD moving in the rising wedge📊 Technical Analysis
● A five-week rectangle at the channel top has broken south after a bearish engulfing, turning 1.3550 into fresh supply; the break also pierces the inner purple resistance line that capped every rally since April.
● Momentum now points to the channel mid-band/May swing low at 1.3516; loss of that neckline activates the measured move toward the lower rail and horizontal support at 1.3415.
💡 Fundamental Analysis
● Pre-BoE election-period caution and firmer post-FOMC USD yields have widened the short-term gilt–UST spread, draining bid tone from sterling.
✨ Summary
Sell 1.3530-1.3560; break below 1.3516 targets 1.3415. Bear view invalidated on an H4 close above 1.3592.
-------------------
Share your opinion in the comments and support the idea with a like. Thanks for your support!
GBPUSD SHORT FORECAST Q2 W25 D17 Y25GBPUSD SHORT FORECAST Q2 W25 D17 Y25
Professional Risk Managers👋
Welcome back to another FRGNT chart update📈
Diving into some Forex setups using predominantly higher time frame order blocks alongside confirmation breaks of structure.
Let’s see what price action is telling us today!
💡Here are some trade confluences📝
✅Weekly order block
✅15' order block
✅Intraday 15' break of structure
✅Tokyo ranges to be filled
🔑 Remember, to participate in trading comes always with a degree of risk, therefore as professional risk managers it remains vital that we stick to our risk management plan as well as our trading strategies.
📈The rest, we leave to the balance of probabilities.
💡Fail to plan. Plan to fail.
🏆It has always been that simple.
❤️Good luck with your trading journey, I shall see you at the very top.
🎯Trade consistent, FRGNT X

GBP/USD Bearish Rejection at Resistance Zone – Downside Targets GBP/USD Bearish Rejection at Resistance Zone – Downside Targets Ahead 🚨
This chart analysis of GBP/USD reveals a clear bearish structure unfolding after the pair tested a strong resistance zone near the 1.36000 level. Here's the professional breakdown:
🔴 Key Resistance Zone: 1.36000 – 1.36200
Price has been rejected multiple times from this upper zone (marked in red).
Repeated upper wicks and lower closes signal selling pressure.
Recent candle formations suggest a potential reversal from this level.
🟢 Major Support Zones:
1.33090 (Mid-Level Support)
This level has acted as a reaction zone in the past.
Could provide temporary consolidation or bounce.
1.31500 – 1.32000
Strong historical support, price bounced here previously.
Bears might slow down in this area before continuation.
1.28000 – 1.29000
Deeper support zone; if broken, could indicate a major trend shift.
📉 Bearish Projection
Price is expected to descend toward 1.33090, and if momentum continues, potentially down to the 1.28 region.
The zigzag projection in the black box reflects a stair-step pattern typical of strong bearish legs.
🧠 Market Psychology & Price Action
Sellers are defending the resistance aggressively.
Lower highs and consistent rejection candles imply weakening bullish momentum.
This setup aligns with a distribution phase before a drop.
📌 Conclusion
🔻 As long as the price remains below the 1.36000 resistance, the bias remains bearish. Watch for confirmations at 1.33090 and 1.32000 – these are crucial zones where price decisions will unfold.
📆 Short to mid-term traders may look for sell setups on retracements with stop-losses above the resistance and targets near support zones.

GBPUSD(20250617)Today's AnalysisMarket news:
Revised version of the Republican tax cut bill in the US Senate: It is proposed to raise the debt ceiling to 5 trillion, and the overall framework is consistent with the House version.
Technical analysis:
Today's buying and selling boundaries:
1.3577
Support and resistance levels:
1.3664
1.3632
1.3611
1.3544
1.3522
1.3490
Trading strategy:
If it rises and breaks through 1.3577, consider entering the market to buy, and the first target price is 1.3611
If it falls and breaks through 1.3544, consider entering the market to sell, and the first target price is 1.3522

GBPUSD(20250613)Today's AnalysisMarket news:
The number of initial jobless claims in the United States for the week ending June 7 was 248,000, higher than the expected 240,000, the highest since the week of October 5, 2024. The monthly rate of the core PPI in the United States in May was 0.1%, lower than the expected 0.30%. Traders once again fully priced in the Fed's two interest rate cuts this year.
Technical analysis:
Today's buying and selling boundaries:
1.3585
Support and resistance levels
1.3685
1.3648
1.3624
1.3547
1.3522
1.3485
Trading strategy:
If the price breaks through 1.3624, consider buying in, the first target price is 1.3648
If the price breaks through 1.3585, consider selling in, the first target price is 1.3547

GBP/USD Technical Analysis – Bearish Setup Developing!GBP/USD Technical Analysis – Bearish Setup Developing! 🔻
Chart Breakdown (H4):
📌 Resistance Zone (🔴 1.35800 – 1.36000):
The pair has been rejected multiple times from this strong resistance area, marked by multiple upper wicks and bearish pressure. Most recent price action shows another rejection, forming a lower high.
📌 Support Level (🟣 1.34732):
This key horizontal level has acted as a strong support multiple times (highlighted with 🟠 circles), suggesting bulls are attempting to defend this zone.
📉 Bearish Structure Formation:
Price recently tested resistance again and was rejected sharply.
A potential double-top or lower high structure is forming.
A break and close below the 1.34732 support will likely confirm bearish momentum.
📍 Next Target (🔻):
If support breaks, price may fall towards the support demand zone around 1.34150 – 1.34300, aligning with the marked red support box.
📈 Invalidation Point:
A clean breakout and hold above 1.36000 would invalidate this bearish bias and potentially signal continuation higher.
⚠️ Summary:
🔼 Resistance Rejection at 1.36000
🔽 Watching for break below 1.34732
🎯 Bearish target: 1.34300 zone
🔄 Invalidation: Break above 1.36000
Bias: 📉 Bearish Below 1.34732

GBPUSD ready to jump?GBPUSD after retest of the daily support has got a bounce back to the upside with a momentum as the price already has got rejected back, we may see potential trend continuation. We can spot the double bottom on the lower timeframe from this support and may continue to rise to the resistance. A bullish trade is high probable after confirmation of potential inverted head and shoulder

DeGRAM | GBPUSD broke the channel📊 Technical Analysis
● Pullback stalled exactly on the purple trend-support (≈1.348) and the channel mid-line after a false break of the upper wedge, preserving the sequence of higher-lows since May.
● Price is basing inside the 1.337-1.353 support strip; reclaim of 1.3530 would invalidate the bearish trap and open the next channel-median / April swing at 1.3590, while the lower rail at 1.3250 guards the up-trend.
💡 Fundamental Analysis
● UK April wage growth held at 5.7 % y/y, keeping BoE tightening bias alive, while softer US CPI expectations cool Treasury yields—narrowing the rate gap and underpinning sterling.
✨ Summary
Long 1.337-1.348; confirmation above 1.353 targets 1.3590, stretch 1.3700. View void on an H4 close below 1.3250.
-------------------
Share your opinion in the comments and support the idea with a like. Thanks for your support!

GBPUSD(20250609)Today's AnalysisMarket news:
Fed Harker: Amid uncertainty, the Fed may still cut interest rates later this year. Musallem: There is a 50% chance that the trade war will lead to a sustained inflation outbreak. Tariffs may push up inflation within one or two quarters. The ECB cut three key interest rates by 25 basis points. Lagarde hinted that the rate cut cycle will end, and the market is no longer fully pricing in another 25 basis point rate cut this year.
Technical analysis:
Today's buying and selling boundaries:
1.3538
Support and resistance levels:
1.3615
1.3586
1.3568
1.3509
1.3491
1.3462
Trading strategy:
If the price breaks through 1.3538, consider buying in, with the first target price of 1.3568
If the price breaks through 1.3509, consider selling in, with the first target price of 1.3491
