Gbpusdsignal

#gbpusdThe price can return to the signal range and we enter the trade there. There are two levels, one with low risk and the other with higher risk, and you can enter at both levels.

GBPUSD Trade SetupA buy position has been placed on the GBP/USD pair at 1.30369, targeting an ambitious level of 1.39096.
This setup reflects a bullish sentiment, anticipating a strong recovery in the British Pound against the US Dollar.
Recent macroeconomic indicators suggest improving conditions in the UK economy, which could support further upward movement.
Technical analysis shows that the pair is holding above key support levels, indicating sustained buying interest.
If momentum continues, the price may gradually ascend toward the 1.39096 target in the coming weeks.
A potential breakout above intermediate resistance zones could further confirm the bullish trend.
Market sentiment also favors the Pound, especially amid speculation about a more cautious approach by the Federal Reserve.
Volatility remains a factor, so proper risk management and stop-loss placement are essential.
Traders should closely monitor upcoming data releases, such as GDP figures and central bank announcements.
Overall, this trade setup offers a promising risk-to-reward ratio, backed by both technical strength and a supportive macroeconomic backdrop.

GBPUSD TRADE PLAN H1GBPUSD TF H1
SELL/SHORT PLAN
cancel if price break ma100(blue),or price break structure
take profit max 1.32000

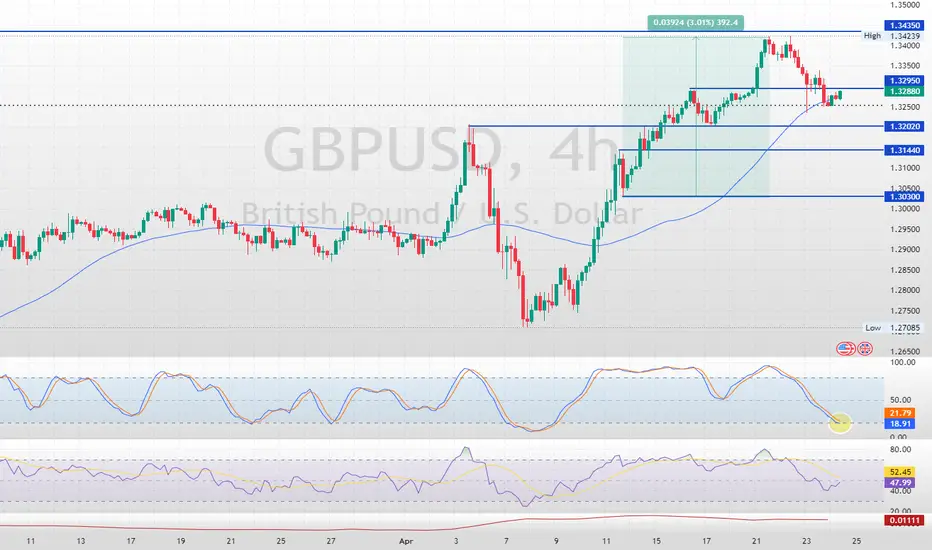
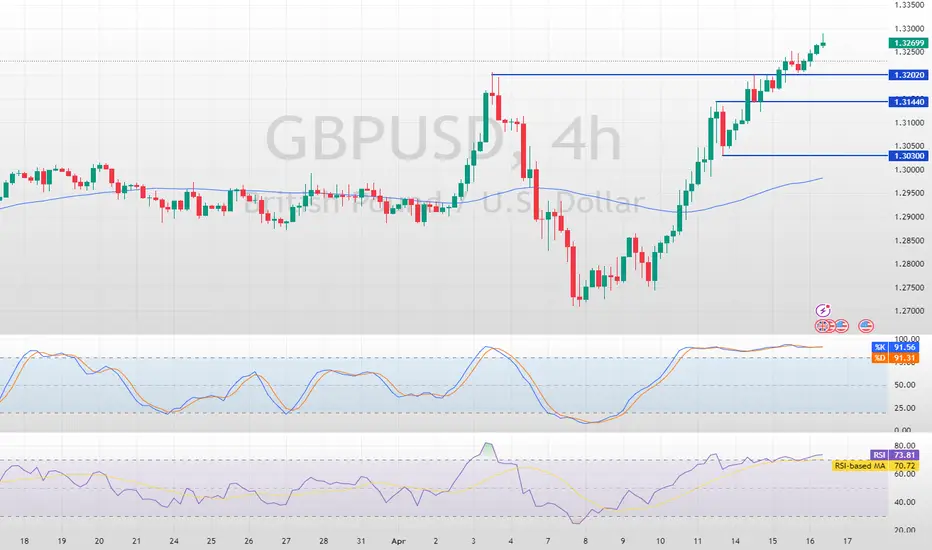
GBP/USD is Bullish: This Breakout Triggers the UptrendFenzoFx—GBP/USD fell from $1.3435, testing the 50-period simple moving average near $1.3276. The Stochastic Oscillator is nearing the 20 level, suggesting the US dollar is overbought in the short term.
Support lies at $1.3202. The outlook remains bullish while above this level, though a close above $1.3295 is needed to confirm upward momentum. A retest of $1.3435 could follow.
Bearish Scenario: A drop below $1.3202 would invalidate the bullish view, potentially extending the decline to $1.3144 or even $1.3030 under sustained selling pressure.
GBPUSD(20250424)Today's AnalysisMarket News:
The United States hit a 16-month low in April. The total number of new home sales in the United States in March was an annualized to a new high since September 2024.
Technical analysis:
Today's buying and selling boundaries:
1.3274
Support and resistance levels:
1.3379
1.3340
1.3314
1.3234
1.3209
1.3170
Trading strategy:
If the price breaks through 1.3274, consider buying, the first target price is 1.3314
If the price breaks through 1.3234, consider selling, the first target price is 1.3209

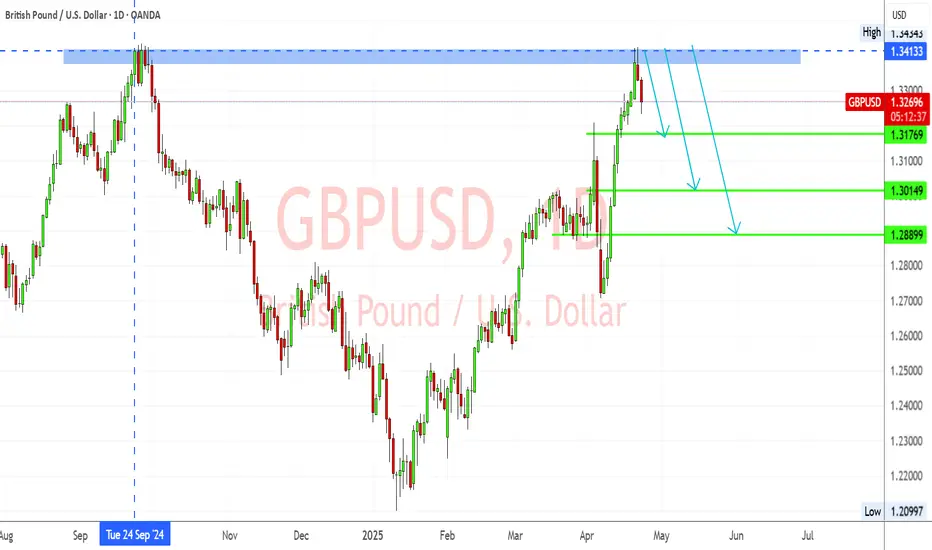
GBPUSD – Rejected at Multi-Month Resistance Amid Weak UK DataGBPUSD has clearly rejected the 1.3413–1.3443 resistance zone—a key area that previously acted as strong supply in September 2024. The pair has formed a bearish rejection candle and is now showing signs of downward momentum.
Key Levels:
Resistance: 1.3413 – 1.3443 (major rejection zone)
TP1: 1.3176 (minor structure)
TP2: 1.3014 (key demand zone)
TP3: 1.2890 (deeper support target)
Bearish Confluences:
Price rejected from major resistance
Bearish candle formation
Previous similar reaction from the same level
Momentum indicators favor downside
📰 Fundamental Analysis:
🔻 UK Data Weakens Further:
According to the latest S&P Global Flash UK PMI (Apr 23):
Composite Output Index: 48.2 (vs 51.5 in March) – 29-month low
Services PMI: 48.9 – 27-month low
Manufacturing PMI: 44.0 – 20-month low
This shows UK private sector activity contracting, led by a steep fall in new export orders, the worst since May 2020.
🔺 Inflation Still High:
Despite falling activity, input and output prices surged, driven by National Insurance hikes and wage growth. This makes it harder for the BoE to justify a cut, despite recession signs.
📌 Conclusion:
The bearish rejection at 1.3413 resistance, combined with deteriorating UK fundamentals, suggests a strong downside setup for GBPUSD. A break below 1.3176 would confirm the bearish move, targeting 1.3014 and potentially 1.2890.
GBPUSD possible short for 1.3030gbpusd tested strong resistance level and high of the year 2024 which is 1.2423. her is weekly supply zone. price may start distribution for big sell. 1.3370-1.3430 weekly supply zone, stop loss place above weekly resistance i.e. 1.3475, target: 1.3030.

GBPUSD SHORT FORECAST Q2 W17 D23 Y25GBPUSD SHORT FORECAST Q2 W17 D23 Y25
Professional Risk Managers👋
Welcome back to another FRGNT chart update📈
Diving into some Forex setups using predominantly higher time frame order blocks alongside confirmation breaks of structure.
Let’s see what price action is telling us today!
💡Trade confluences📝
✅Weekly Order block rejection
✅15’ order block created
✅15’ wick rejections via order block
✅Intraday bearish breaks of structure
✅Tokyo ranges to be filled
✅1’ break of structure
✅1’ bearish engulfing candle fill
✅Sell limit order on the 1’ candle fill
🔑 Remember, to participate in trading comes always with a degree of risk, therefore as professional risk managers it remains vital that we stick to our risk management plan as well as our trading strategies.
📈The rest, we leave to the balance of probabilities.
💡Fail to plan. Plan to fail.
🏆It has always been that simple.
❤️Good luck with your trading journey, shall see you at the very top.
🎯Trade consistent, FRGNT X

GBPUSD LONG/BUYBy utilizing Fibonacci retracement levels, historical patterns, , we can formulate a hypothesis that the market might follow a similar trajectory if bullish sentiment prevails.
Massive Rally, Massive Resistance – Time to Sell GBPUSD?The last two weeks felt like a rollercoaster for GBPUSD. It all started with a gap down on Monday, April 7, but that weakness didn’t last. The pair filled the gap and then rallied hard – over 700 pips!
🤔 Key Question – Is the move sustainable, or are we topping out?
Now the pair is approaching a massive resistance zone, one that dates back to 2019. While the bullish sentiment and USD weakness could push it toward 1.3500, this isn’t a breakout I’d blindly chase.
📉 Why I'm expecting a reversal:
Price is entering a long-term resistance area – a major barrier.
700 pips of upside happened fast – a pullback is likely.
USD weakness might fade, creating downward pressure.
1.3450–1.3500 is my key sell zone.
📊 My Trading Plan:
I’ll be watching for clear signs of weakness near 1.3450 – such as rejection candles or slowing momentum. If the market confirms, I’m looking for a 500 pip move down, with 1.3000 as the first major target.
Disclosure: I am part of Trade Nation's Influencer program and receive a monthly fee for using their TradingView charts in my analyses and educational articles.

GBPUSD SHORT FORECAST Q2 W17 D22 Y25GBPUSD SHORT FORECAST Q2 W17 D22 Y25
SUMMARY
- Weekly order block
- Daily order block
- Price action bullish in current point of interest.
REQUIREMNTS
- Setup A) Substantial 15' break of structure, creating 15' order block to short from on the pull back.
- Setup C) Lower time frame break of structure without initial 15' break of structure.
- Candle stick formation confluences.
FRGNT X
IG - JCFRGNT

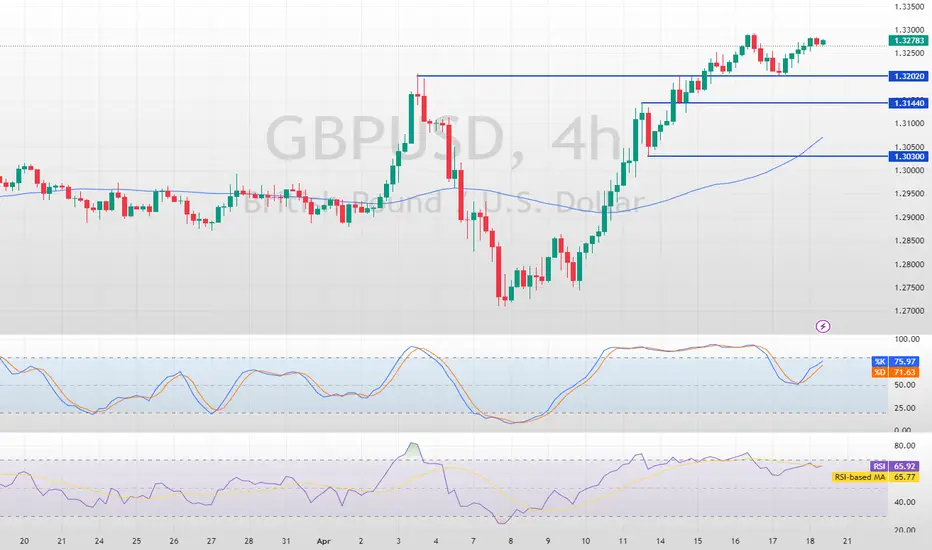
DeGRAM | GBPUSD Strengthening Pound📊 Technical Analysis
- Uptrending channel
The GBP/USD pair is moving steadily within the ascending channel, having recently tested key support levels (“break and retest”).
- Key Resistance
Immediate resistance at $1.32; a break of this level means further strengthening of bullish sentiment.
- Predicted Scenario
A confirmed break above $1.32 opens the way to 1.33.
Fundamental Analysis 💡
Strong UK wage growth (5.9%) and GDP growth (0.5%) support GBP strength. A weaker USD amid easing trade tensions also favors GBP/USD.
✨ Summary
Positive fundamentals complement a clear bullish technical situation. Keep a close eye on a break above $1.32 to confirm the continuation of GBP/USD upside!
-------------------
Share your opinion in the comments and support the idea with a like. Thanks for your support!

GBPUSDGBPUSD still showing some strength and needs more upside before any drop.
Disclosure: We are part of Trade Nation's Influencer program and receive a monthly fee for using their TradingView charts in our analysis.

#GBPUSD: Massive Swing Sell Is In Making 1200+ Pips Worth? **FX:GBPUSD Price Analysis**
GBPUSD price has recently experienced an overbought condition, primarily due to the significant decline of the DXY index. This decline can be attributed to the ongoing trade dispute between China and the United States, which has resulted in a drop in the DXY index to its lowest point in the past eighteen months.
Conversely, the GBP has gained strength due to positive economic indicators indicating robust growth in the United Kingdom. This has made the GBP more attractive to investors.
The FX:GBPUSD price is expected to continue its upward trend and potentially reach the 1.35 level. However, it is also possible for the price to reverse its direction from this point.
**Targets:**
If the trade is activated, three targets have been set for the FX:GBPUSD price. These targets can be adjusted based on your own analysis and trading strategy.
We extend our sincere gratitude for your unwavering support and well wishes.
Best regards,
Team Setupsfx_

#GBPUSD: Two Prominent Buying Points! Will Dxy Bounce Back? Due to strong economic data supporting GBP, its price has been bullish throughout the week, especially since DXY plunged. Given ongoing trade tensions, we may see another higher high. This is risky, so please analyse it yourself.
Like and comment to support us in bringing more analysis.
Have a great weekend! ❤️
Team Setupsfx_

GBP/USD AnalysisFenzoFx—The GBP/USD pair rebounded from $1.3202 support, currently trading around $1.3277 and continuing its bullish trend.
As long as it stays above $1.3144, the next target could be $1.3435. On the flip side, a break below $1.3144 may trigger a bearish move towards $1.3030.
>>> No Deposit Bonus
>>> %100 Deposit Bonus
>>> Forex Analysis Contest
All at F enzo F x Decentralized Forex Broker
GBPUSD(20250417)Today's AnalysisMarket news:
U.S. import prices fell 0.1% in March from the previous month, the first month-on-month decline since September last year.
Technical analysis:
Today's buying and selling boundaries:
1.3214
Support and resistance levels:
1.3301
1.3268
1.3247
1.3180
1.3159
1.3127
Trading strategy:
If the price breaks through 1.3247, consider buying, with the first target price of 1.3268
If the price breaks through 1.3214, consider selling, with the first target price of 1.3180

GBPUSD(20250416)Today's AnalysisToday's buying and selling boundaries:
1.3214
Support and resistance levels:
1.3301
1.3268
1.3247
1.3180
1.3159
1.3127
Trading strategy:
If the price breaks through 1.3247, consider buying, the first target price is 1.3268
If the price breaks through 1.3214, consider selling, the first target price is 1.3180

GBP/USD Breaks $1.3202: Bullish Market InsightsFenzoFx—The GBP/USD currency pair shows strong bullish momentum, breaking above $1.3202 yesterday. With overbought signals from the Stochastic indicator, a consolidation phase may lead to declines toward $1.3144 and $1.3030.
Traders should watch for bullish candlestick patterns near these support levels.
>>> No Deposit Bonus
>>> %100 Deposit Bonus
>>> Forex Analysis Contest
All at F enzo F x Decentralized Forex Broker
GBPUSD SHORT FORECAST Q2 W16 D16 Y25GBPUSD SHORT FORECAST Q2 W16 D16 Y25
Thoughts- It's not if, it's WHEN !
All longs are null until the weekly order block has been breached or price drops considerably. In the here and now the short seems to be closing in.
It is as always important to stack confluences in favour of the short prior risking capital.
15' break of structure is an absolute requirement as this point of price action.
Within the higher time frame order block- looking for a lower time frame order block is not enough to short from therefore scrolling back months to find is pointless in our opinion.
We will let price show us, we will reaction with price.
What are your thoughts...
Are we dropping today?
FRGNT X

GBPUSD: Strong Bullish Market 🇬🇧🇺🇸
GBPUSD set a new daily high today.
The pair remains in a strong bullish momentum since 8th of April.
With the complete absence of high impact fundamentals today, buying pressure
may persist.
I believe that it may continue rising at least to 1.33 - the closest historic resistance.
❤️Please, support my work with like, thank you!❤️
I am part of Trade Nation's Influencer program and receive a monthly fee for using their TradingView charts in my analysis.

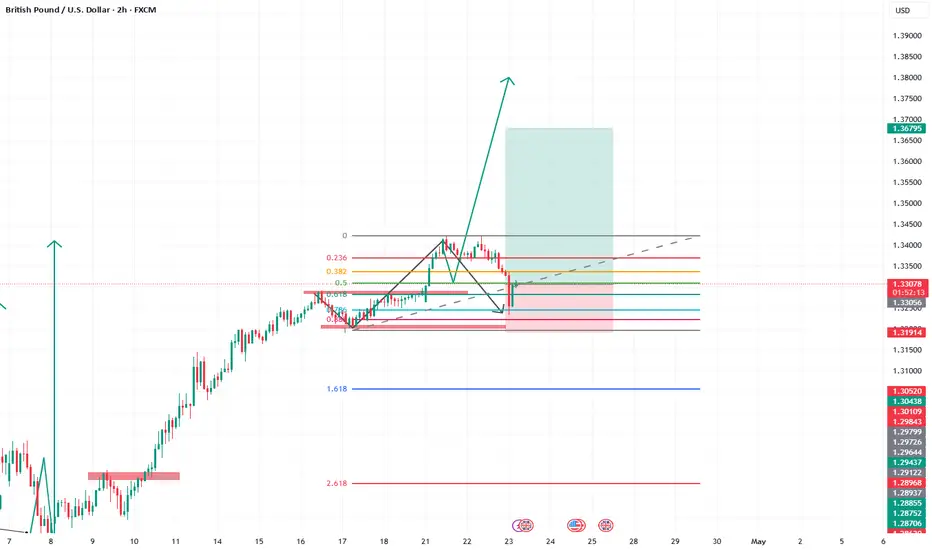
“GBP/USD Long Setup: Demand Zone Bounce Toward 1.35000 Target ”🔍 Trade Setup
🟦 Entry Point: 1.32171
➤ Price is near the 7 EMA – good for a possible bounce.
🟩 Demand Zone: 1.31761 - 1.31500
➤ This is where buyers previously stepped in.
➤ Strong support area – watch for bullish reversal candles here.
🔻 Stop Loss: 1.31141
➤ Below the demand zone to protect against a fakeout.
🎯 Target Point: 1.35000
➤ Big upside target – aiming for a strong rally.
⚖️ Risk to Reward
❌ Risk: 1.32171 → 1.31141 = ~103 pips
✅ Reward: 1.32171 → 1.35000 = ~283 pips
⚖️ R:R Ratio: ≈ 1:2.75 – very favorable!
✅ Summary
🔸 Trend is bullish with strong momentum
🔸 EMA is acting as dynamic support
🔸 Demand zone is clearly respected
🔸 Great R:R setup for a long trade
