GBPUSD : Current Situation & Technical , Fundamental View- It is not possible to find any important ECONOMIC INDICATOR for GBP in ECONOMIC CALENDAR today. We can look forward to the USD NFP DATA release today at the NEWYORK SESSION. You definitely have to be careful about that.
- DXY is currently at 103.533 LEVEL. Above the DXY 100 is a very good STRONG condition. Also the GBP FEATURE stays at 1.2443 LEVEL. GBPUSD PRICE has gone below DYNAMIC S / R LEVELS. Maybe DYNAMIC S / R LEVELS can be UP before moving further. Then most of the time the PRICE can be sold in the form of STRUCTURE.
- Currently the SENTIMENT of the OVERALL MARKET is NEUTRAL. But it's too heavy for RISK OFF status. Also the EQUITIES are turning a bit red. VIX INDEXES UP UP. Also COMMODITIES now shows a UP SIDE BIAS. Currently the market has a NEUTRAL BIAS.
- GBPUSD PRICE can be UP to 1.2588 LEVEL before DOWN. Then you can DOWN to 1.2080 LEVEL. According to this week's ECONOMIC INDICATOR DATA and MARKET SENTIMENT. Then GBPUSD UP to 1.3192 LEVEL can be USD if a NEGATIVE SENTIMENT is received. FED UPDATES are very important for that.
Gbpusdsignals

GBPUSD Will Fall!GBP-USD broke the key horizontal level 1.25
Which is now a resistance
Which makes me bearish on the pair
And I think that it will fall further down
Onto the target level below

GBPUSD | Live position review | Follow-up detailsWe were unable to make some money yesterday as our bearish set-up was disregarded later on in the day as stated in the comment section (see link below for reference purposes).
Now, we have been witnessing a consolidation phase since the beginning of the month which appears to be transposed into a reversal structure clearly seen in the 4H time frame.
With the appearance of a bullish engulfing candle springing out of the structure during the course of yesterday's trading session; a bullish momentum might be unfolding before our eyes with the intention of inciting a retracement wave of the bearish impulse leg identified on the 4H time frame.
Risk Disclaimer:
Margin trading in the foreign exchange market (including commodity trading, CFDs, stocks etc.) has a high risk and is not suitable for all investors. The content of this speculation (including all data) is organized and published by me for the sole purpose of education and assistance in making independent investment decisions. All information herein is for your reference only and I take no responsibility.
You are hereby advised to carefully consider your investment experience, financial situation, investment objective, risk tolerance level, and consult your independent financial adviser as to the suitability of your situation prior to making any investment.
I do not guarantee its accuracy and is not liable for any loss or damage which may result directly or indirectly from such content or the receipt of any instruction or notification therewith.
Past performance is not necessarily indicative of future results.

GBP/USD ShortInto support on higher timeframe.
Target is a moving average so will be adjusted over time.
1:1 RR

GBPUSD | Live position review | Follow-up detailsWith over 180 pips profit (3 positions) since the last publication of this pair (see link below for reference purposes); An ambiguous scenario we have here as participants appear to have fallen into an indecision phase right under the 1.259 area (which is serving as our key level at this juncture in the market) - forming a pennant (trend continuation) structure. However, a breakout of the bearish trendline (identified in the 1H timeframe) and key level might incite the beginning of a retracement wave into the golden zone identified in the video. Let's keep our fingers crossed and watch what happens in the next couple of hours!
Risk Disclaimer:
Margin trading in the foreign exchange market (including commodity trading, CFDs, stocks etc.) has a high risk and is not suitable for all investors. The content of this speculation (including all data) is organized and published by me for the sole purpose of education and assistance in making independent investment decisions. All information herein is for your reference only and I take no responsibility.
You are hereby advised to carefully consider your investment experience, financial situation, investment objective, risk tolerance level, and consult your independent financial adviser as to the suitability of your situation prior to making any investment.
I do not guarantee its accuracy and is not liable for any loss or damage which may result directly or indirectly from such content or the receipt of any instruction or notification therewith.
Past performance is not necessarily indicative of future results.

GBP/USD ShortInto higher timeframe resistance.
Target is a moving average so will be tracked up over time.
1:1 RR

GBPUSD : Current Situation & Technical , Fundamental View- It is not possible to find any important ECONOMIC INDICATOR for GBP in ECONOMIC CALENDAR today. 3 important DATA for USD to be released today in the NEWYORK SESSION. CORE DURABLE GOODS ORDER REPORTS, DURABLE GOODS ODER REPORTS, CONSUMER CONFIDENCE REPORTS will be released.
- DXY is currently at 101.91 LEVEL. Above the DXY 100 is a very good STRONG condition. Also the GBP FEATURE stays at 1.2812 LEVEL. GBPUSD PRICE has gone below DYNAMIC S / R LEVELS. Maybe DYNAMIC S / R LEVELS can be UP before moving further. Then most of the time the PRICE can be sold in the form of STRUCTURE.
- Currently the SENTIMENT of the OVERALL MARKET is NEUTRAL. But it's too heavy for RISK ON status. Also the EQUITIES are turning a bit GREEN. VIX INDEXES UP UP. Also COMMODITIES now shows a UP SIDE BIAS. Currently the market has NEUTRAL BIAS. But due to EQUITIES UP, COMMODITIES UP the MARKET RISK is ON. This MARKET CONDITION status has managed to DOWN CURRENCIES AUD, NZD, GBP.
- GBPUSD PRICE can be UP to 1.2910 LEVEL before DOWN. Then you can DOWN to 1.2558 LEVEL. According to this week's ECONOMIC INDICATOR DATA and MARKET SENTIMENT. Then GBPUSD UP can be to 1.3192 LEVEL.

GBPUSD | New perspectivePrice action is presently oscillating within a strong demand zone. Despite been in a strong downtrend situation, I am having a feeling buyers might push price further up in the next couple of hours... However, if price breaks down this 1.3 zone then we can be looking for a confirmation to sell
Risk Disclaimer:
Margin trading in the foreign exchange market (including commodity trading, CFDs, stocks etc.) has a high risk and is not suitable for all investors. The content of this speculation (including all data) is organized and published by me for the sole purpose of education and assistance in making independent investment decisions. All information herein is for your reference only and I take no responsibility.
You are hereby advised to carefully consider your investment experience, financial situation, investment objective, risk tolerance level, and consult your independent financial adviser as to the suitability of your situation prior to making any investment.
I do not guarantee its accuracy and is not liable for any loss or damage which may result directly or indirectly from such content or the receipt of any instruction or notification therewith.
Past performance is not necessarily indicative of future results.

GBPUSD | New PerspectiveWith a strong key level at 1.306, we shall be looking out for a breakdown of this key level for bearish signals. In this regard, I shall keep you posted as price action is been monitored.
Risk Disclaimer:
Margin trading in the foreign exchange market (including commodity trading, CFDs, stocks etc.) has a high risk and is not suitable for all investors. The content of this speculation (including all data) is organized and published by me for the sole purpose of education and assistance in making independent investment decisions. All information herein is for your reference only and I take no responsibility.
You are hereby advised to carefully consider your investment experience, financial situation, investment objective, risk tolerance level, and consult your independent financial adviser as to the suitability of your situation prior to making any investment.
I do not guarantee its accuracy and is not liable for any loss or damage which may result directly or indirectly from such content or the receipt of any instruction or notification therewith.
Past performance is not necessarily indicative of future results.

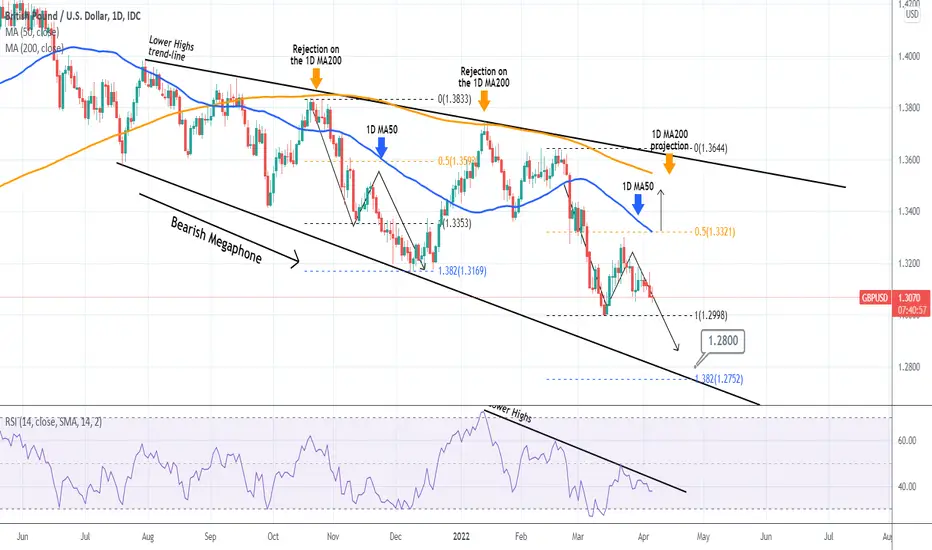
GBPUSD aiming at a new Low within the Bearish Megaphone.GBPUSD failed to break above the 1D MA50 (blue trend-line) and the 0.5 Fibonacci retracement level last week and as a result the market lost confidence and resumed the long-term bearish trend. That has been within a Bearish Megaphone pattern since July 2021.
The selling fractal since February 17 resembles the sequence of late October - early December 2021. The pair also failed to break above the 1D MA50 and the 0.5 Fib after a short-term rebound, and eventually made a new Megaphone Lower Low on the 1.382 Fibonacci extension. That extension is currently at 1.2750. Only a break above the 1D MA50 can be treated as a short-term buy aimed at the 1D MA200 (orange trend-line).
*Note: The RSI has been under Lower Highs since January 13.
--------------------------------------------------------------------------------------------------------
** Please support this idea with your likes and comments, it is the best way to keep it relevant and support me. **
--------------------------------------------------------------------------------------------------------
GBPUSD : Current Situation & Technical , Fundamental View
TREASURY SEC YELLEN is set to make a SPEECH for USD today. Also, today is the most important day for the FOMC MEETING. It is a very HIGH VOLATILE EVENT and we look forward to the decisions that are made there. Today is not an important day for GBP. But CONSTRUCTION PMI DATA is due to be released today for GBP. It's the LOW IMPACT NEWS. But there is some significance.
- DXY is currently at 99.74 LEVEL. Also the GBP FEATURE stays at 1.3056 LEVEL. GBPUSD PRICE is slightly lower than DYNAMIC S / R LEVELS. Maybe DYNAMIC S / R LEVELS can be UP before moving further. Then most of the time the PRICE can be sold in the form of STRUCTURE.
- Currently the SENTIMENT of the OVERALL MARKET is NEUTRAL. But it's too heavy for RISK OFF status. Also the EQUITIES are turning a bit red. VIX is getting a bit UP. Also COMMODITIES are now showing a DOWN SIDE BIAS. There is a NEUTRAL BIAS currently on the market. But because of VIX UP, EQUITIES DOWN, COMMODITIES DOWN the MARKET RISK is OFF.
- GBPUSD PRICE can be UP to 1.3162 LEVEL before DOWN. Then you can DOWN to 1.2905 LEVEL. The PRICE will move according to this week's ECONOMIC INDICATOR DATA and MARKET SENTIMENT. FOMC MEETING is taking place today. Watch out for any changes.

GBPUSD | Live position review | Follow-up detailsPositions closed at break-even and the structure still appears to support bullish momentum. Pending order placed as we look forward to bullish momentum.
Risk Disclaimer:
Margin trading in the foreign exchange market (including commodity trading, CFDs, stocks etc.) has a high risk and is not suitable for all investors. The content of this speculation (including all data) is organized and published by me for the sole purpose of education and assistance in making independent investment decisions. All information herein is for your reference only and I take no responsibility.
You are hereby advised to carefully consider your investment experience, financial situation, investment objective, risk tolerance level, and consult your independent financial adviser as to the suitability of your situation prior to making any investment.
I do not guarantee its accuracy and is not liable for any loss or damage which may result directly or indirectly from such content or the receipt of any instruction or notification therewith.
Past performance is not necessarily indicative of future results.

GBPUSD | Live position review | Follow-up detailsIn the last couple of hours, we witnessed a retracement into the neckline of the inverse head and shoulder pattern identified on the 4H time frame and this appears to be a confirmation for bullish momentum if the price does not break below the bullish trend line.
Risk Disclaimer:
Margin trading in the foreign exchange market (including commodity trading, CFDs, stocks etc.) has a high risk and is not suitable for all investors. The content of this speculation (including all data) is organized and published by me for the sole purpose of education and assistance in making independent investment decisions. All information herein is for your reference only and I take no responsibility.
You are hereby advised to carefully consider your investment experience, financial situation, investment objective, risk tolerance level, and consult your independent financial adviser as to the suitability of your situation prior to making any investment.
I do not guarantee its accuracy and is not liable for any loss or damage which may result directly or indirectly from such content or the receipt of any instruction or notification therewith.
Past performance is not necessarily indicative of future results.

GBPUSD | Live position review | Follow-up detailsGBPUSD positions appear to be doing well at the moment as we currently experience over 70pips moving in our direction. But it's not yet a tangible reason to be excited as the current structure needs confirmation in the form of a retest/rejection of neckline @ 1.32 to the upside to seal the uptrend continuation. See my previous video on this for further details (see link below)
Risk Disclaimer:
Margin trading in the foreign exchange market (including commodity trading, CFDs, stocks etc.) has a high risk and is not suitable for all investors. The content of this speculation (including all data) is organized and published by me for the sole purpose of education and assistance in making independent investment decisions. All information herein is for your reference only and I take no responsibility.
You are hereby advised to carefully consider your investment experience, financial situation, investment objective, risk tolerance level, and consult your independent financial adviser as to the suitability of your situation prior to making any investment.
I do not guarantee its accuracy and is not liable for any loss or damage which may result directly or indirectly from such content or the receipt of any instruction or notification therewith.
Past performance is not necessarily indicative of future results.

GBPUSD | Live position reviewThis is a follow-up detail of the video I published on this pair during the weekend (see link below for reference purposes). It appears as though the price is about to break out of the neckline at $1.32 which shall be our confirmation for bullish momentum.
Risk Disclaimer:
Margin trading in the foreign exchange market (including commodity trading, CFDs, stocks etc.) has a high risk and is not suitable for all investors. The content of this speculation (including all data) is organized and published by me for the sole purpose of education and assistance in making independent investment decisions. All information herein is for your reference only and I take no responsibility.
You are hereby advised to carefully consider your investment experience, financial situation, investment objective, risk tolerance level, and consult your independent financial adviser as to the suitability of your situation prior to making any investment.
I do not guarantee its accuracy and is not liable for any loss or damage which may result directly or indirectly from such content or the receipt of any instruction or notification therewith.
Past performance is not necessarily indicative of future results.

GBPUSD | Perspective for the new weekA reversal pattern was identified on the 4H time frame as the pound appears to have bounced up to erase previous losses in recent time.
Tendency: Uptrend (Bullish)
Structure: Supply & Demand | Trendline | Reversal pattern (Inverse Head and Shoulder)
NB: This speculation might be considered to make individual decisions on the lower timeframe.
Watch this space for updates as price action is been monitored.
Risk Disclaimer:
Margin trading in the foreign exchange market (including commodity trading, CFDs, stocks etc.) has a high risk and is not suitable for all investors. The content of this speculation (including all data) is organized and published by me for the sole purpose of education and assistance in making independent investment decisions. All information herein is for your reference only and I take no responsibility.
You are hereby advised to carefully consider your investment experience, financial situation, investment objective, risk tolerance level, and consult your independent financial adviser as to the suitability of your situation prior to making any investment.
I do not guarantee its accuracy and is not liable for any loss or damage which may result directly or indirectly from such content or the receipt of any instruction or notification therewith.
Past performance is not necessarily indicative of future results.

GBPUSD bottomed. 1 month of uptrend ahead.The GBPUSD pair is flashing a strong buy signal today, as it is rising on the 2nd straight green 1D candle following a Double Bottom on the 1D RSI. Monday's low happens to be exactly on the Lower Lows trend-line (based on the recent December 08 Low) of the Channel Down that started in mid 2021.
As a result, if the price closes above the 1W MA200 (red trend-line), then we expect a roughly 1 month rise towards the 1D MA200 (orange trend-line) again, within 1.3500 - 1.3550. As you see on the chart, the 1D MA200 has been the natural Resistance since the pair broke below it on September 16 2021 with two rejections already.
On the other hand, if Monday's low is compromised with a 1D candle closing below it, we expect the price to seek the -0.382 Fibonacci extension instead at around 1.2750. Be ready to adapt and have your SLs accordingly.
--------------------------------------------------------------------------------------------------------
Please like, subscribe and share your ideas and charts with the community!
--------------------------------------------------------------------------------------------------------

gbpusd trade against the trend !! after the full TF analysis, our team decided to buy
** NOTE **
if the price breaks the downtrend
we will look for buying opportunities
but till now we are still in bearish momentum
so, keep ur eyes on smaller TF for a momentum shift
************ like and follow for more ************

GBPUSD long buy !!GBP-USD is falling in a downtrend
But a strong horizontal support level is present in it 1.3220 and the formation of the bullish harmonic pattern
Although the risks we might expect
Bullish correction with retest
The resistance level above is at 1.3415

GBPUSD 1-2 months trading plan.This is an update to my early February two month trading plan:
GDPUSD has hit eventually our 1.3200 downside target after being rejected on more time just below the Lower Highs trend-line of July 30 2021.
As you see, this trend-line is what's causing the long-term bearish trend on the pair, which can be alternatively viewed as a Channel Down, which only broke to the downside to test the 1W MA200 (red trend-line). At the same time the 1D MA200 (orange trend-line) appears to be a Resistance level as since late September 2021 has rejected the price 2 times.
That (the 1D MA200) should be the target (actually would be more fair to set it at 1.3550) as long as the 1W MA200 is holding as a Support. It broken, the plan should be to take loss and sell instead targeting the -0.236 Fibonacci extension (1.2920). A 1D candle closing above the Lower Highs trend-line, should be treated as a bullish break-out signal (1.4000).
You can keep an eye on the 1D RSI for extra weight on timing the rebound. Since September 2021, every time it has hit the 30.000 level, the GPBUSD pair made a Lower Low and rebounded.
--------------------------------------------------------------------------------------------------------
** Please support this idea with your likes and comments, it is the best way to keep it relevant and support me. **
--------------------------------------------------------------------------------------------------------

GBPUSDHello my friends you can open sell posititon in flip zone
weekly: down trend
daily:down trend
4h:down trend
this analysis for long time
good luck

GBPUSD Long Term Predictions (4H Chart)Technical Analysis Summary
GBP/USD
TREND ANALYSIS
We have 2 Uptrend in green color (LONG TERM AND INTERNAL TRENDS)
We have 1 Downtrend in red color (LONG TERM)
Be careful trends need to be modified when broken to the new peaks(Downtrend) and lows (Uptrend).
FUTURE PREDICTIONS
We have many resistance and support levels that I have mentioned above.
I use thickness as an indicator of strength of levels (ONLY FOR VISUALS).
Yellow Levels are levels from my past ideas published or levels that were respected from the past.
Good luck everyone, stay safe!
If you need help don't hesitate to send me a message or comment
If you find this content beneficial please don't forget to LIKE and FOLLOW
Trading Involves High Risk
Not Financial Advice
Exercise Proper Risk Management

GBPUSD Down Trend.!#GBPUSD Looking for Sell trade setup as I mentioned in the Chart.!
Keep Supporting LIKE, COMMENT And FOLLOW.!
Thank You.!
