Market Analysis: GBP/USD Dips Below SupportMarket Analysis: GBP/USD Dips Below Support
GBP/USD started a fresh decline below the 1.3620 zone.
Important Takeaways for GBP/USD Analysis Today
- The British Pound started another decline from the 1.3620 resistance zone.
- There was a break below a connecting bullish trend line with support at 1.3460 on the hourly chart of GBP/USD at FXOpen.
GBP/USD Technical Analysis
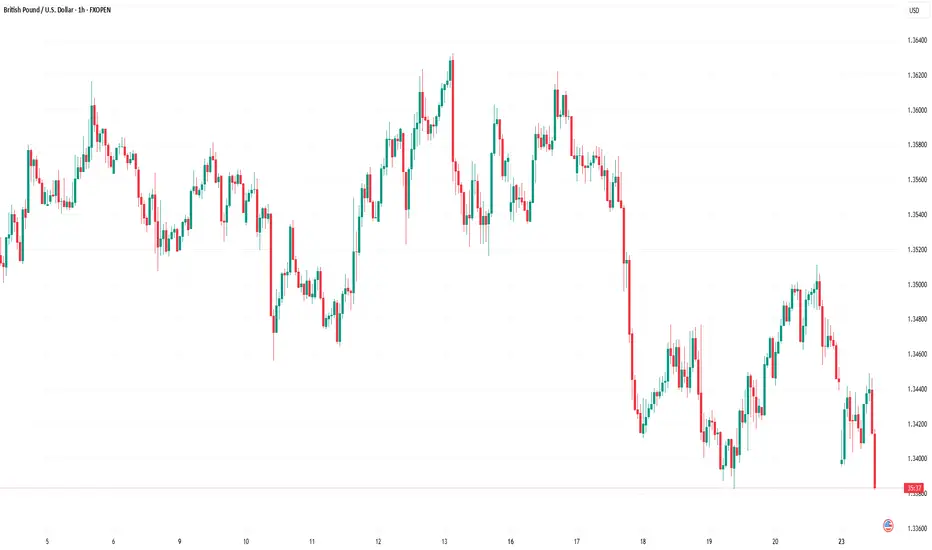
On the hourly chart of GBP/USD at FXOpen, the pair struggled to continue higher above the 1.3620 resistance zone. The British Pound started a fresh decline and traded below the 1.3550 support zone against the US Dollar, as discussed in the previous analysis.
The pair even traded below 1.3500 and the 50-hour simple moving average. Finally, the bulls appeared near the 1.3380 level. There was a recovery wave above the 1.3450 level and the 23.6% Fib retracement level of the downward move from the 1.3622 swing high to the 1.3382 low.
However, the bears were active near the 1.3500 zone and the 50% Fib retracement level. As a result, there was a fresh bearish reaction below a connecting bullish trend line with support at 1.3460.
Initial support on the GBP/USD chart sits at 1.3380. The next major support is at 1.3350, below which there is a risk of another sharp decline. In the stated case, the pair could drop toward 1.3200.
Immediate resistance on the upside is near 1.3440. The first major resistance is near the 1.3500 zone. The main hurdle sits at 1.3530. A close above the 1.3530 resistance might spark a steady upward move. The next major resistance is near the 1.3565 zone. Any more gains could lead the pair toward the 1.3620 resistance in the near term.
This article represents the opinion of the Companies operating under the FXOpen brand only. It is not to be construed as an offer, solicitation, or recommendation with respect to products and services provided by the Companies operating under the FXOpen brand, nor is it to be considered financial advice.
Gbpusdtrade
Bearish GBP/USD Outlook: Shorting the Pound Against the DollarI can write a lot of text here but let make it short, liek and sub from you for that:
3 options:
pump till PDH then dump to weekly FVG 1.34 area
dump from here till weekly FVG 1.34 area
if it breaks above PWH with good volume and closing at least on 4h then only longs

GBPUSDGBPUSD still needs some more correction before it goes to 1.365.
Disclosure: We are part of Trade Nation's Influencer program and receive a monthly fee for using their TradingView charts in our analysis.

GBP/USD Potential Bullish ReversalGBP/USD Potential Bullish Reversal 📈🦾
📊 Technical Analysis Overview:
The chart showcases a well-defined horizontal range between the support (~1.31900) and resistance (~1.36200) zones. The price action has respected these levels multiple times, forming a clear accumulation zone at the bottom and rejection at the top.
🔄 Pattern Formation:
A Rounded Bottom (Cup) structure is visible forming from the June low.
The price made a bullish bounce near the key support level at 1.33930, marked by an orange circle, suggesting a potential higher low formation.
The blue downtrend line from the recent high (red arrow) has been broken, indicating a trend reversal attempt.
📍 Current Price: 1.34494
🎯 Target Zone: 1.35734
🛑 Support to Watch: 1.33930
📈 Bullish Confirmation:
A break above the minor neckline (around current price) would confirm a cup & handle breakout with a projected target of 1.35734.
Strong buying pressure and higher lows are reinforcing bullish strength.
⚠️ Risk Management Tip:
A breakdown below 1.33930 would invalidate the bullish setup and could retest the major support zone (~1.31900).
✅ Bias: Bullish, unless price closes below 1.33930
🕒 Outlook: Short- to Mid-term Upside Potential

GBPUSD(20250620)Today's AnalysisMarket news:
The Bank of England kept interest rates unchanged at 4.25%, and the voting ratio showed that internal differences were increasing. Traders expect the bank to cut interest rates by another 50 basis points this year.
Technical analysis:
Today's buying and selling boundaries:
1.3439
Support and resistance levels:
1.3526
1.3494
1.3473
1.3406
1.3385
1.3353
Trading strategy:
If it breaks through 1.3473, consider buying, and the first target price is 1.3494
If it breaks through 1.3439, consider selling, and the first target price is 1.3406

GBPUSD(20250619)Today's AnalysisMarket news:
Fed's June meeting - kept interest rates unchanged for the fourth time in a row, and the dot plot showed two rate cuts this year, but the number of officials who expected no rate cuts this year rose to 7, and the rate cut expectations for next year were cut to 1. Powell continued to call for uncertainty, and the current economic situation is suitable for waiting and watching. He also expects tariff-driven inflation to rise in the coming months.
Technical analysis:
Today's buying and selling boundaries:
1.3432
Support and resistance levels:
1.3507
1.3479
1.3461
1.3403
1.3385
1.3357
Trading strategy:
If the price breaks through 1.3432, consider buying, and the first target price is 1.3461
If the price breaks through 1.3403, consider selling, and the first target price is 1.3385

GBPUSD Analysis todayHello traders, this is a complete multiple timeframe analysis of this pair. We see could find significant trading opportunities as per analysis upon price action confirmation we may take this trade. Smash the like button if you find value in this analysis and drop a comment if you have any questions or let me know which pair to cover in my next analysis.

GBP/USD Hits June LowGBP/USD Hits June Low
As the GBP/USD chart shows, the pair dropped sharply last night, falling below the 1.34170 level. This move marked the lowest point for the pound against the dollar since the beginning of June.
One of the main drivers behind this decline is the strengthening of the US dollar, which is attracting market participants amid heightened geopolitical tensions and a potential escalation of military conflict between Iran and Israel, involving US armed forces. According to the latest reports, Donald Trump has warned Tehran that US patience is wearing thin.
Today, however, the pound has seen a slight rebound, supported by the release of the UK Consumer Price Index (CPI). While the data confirmed that inflation is easing, the pace of decline is slower than expected. This may reduce the likelihood of interest rate cuts by the Bank of England – which in turn has boosted the pound’s value.
What could happen next?
Technical Analysis of the GBP/USD Chart
Since the end of May, price fluctuations have formed an ascending channel (shown in blue), with bulls making several attempts to break the resistance level at 1.3600 – so far, without much success.
The sharp decline from point A to B suggests that the bears have seized the initiative, with the pair rebounding from the lower boundary of the blue channel.
GBP/USD traders may:
→ interpret the bounce from the lower blue boundary as an upward correction following a sharp fall;
→ use Fibonacci retracement levels to estimate potential upside. In such cases, particular attention is typically given to the 0.5–0.618 zone (highlighted in orange). Here, it aligns with the 1.3526 level, which acted as support on 12–13 June, but may now serve as resistance after being breached.
This article represents the opinion of the Companies operating under the FXOpen brand only. It is not to be construed as an offer, solicitation, or recommendation with respect to products and services provided by the Companies operating under the FXOpen brand, nor is it to be considered financial advice.

#GBPUSD: Smaller Time-Frame Tells A Different Story! GBPUSD has exhibited strong bullish sentiment in shorter timeframes. However, an analysis of shorter timeframes reveals a different picture. The current price trend is upward, and it is anticipated to continue. Nevertheless, we anticipate a price correction around 1.3470, followed by a continuation of the bullish move. We strongly recommend conducting your own analysis before making any investment decisions.
Best of luck in your trading endeavours, and please remember to prioritise safety.
Kindly consider liking, commenting, and sharing this analysis for further insights.
Team Setupsfx_

GBP/USD Bearish Rejection at Resistance Zone – Downside Targets GBP/USD Bearish Rejection at Resistance Zone – Downside Targets Ahead 🚨
This chart analysis of GBP/USD reveals a clear bearish structure unfolding after the pair tested a strong resistance zone near the 1.36000 level. Here's the professional breakdown:
🔴 Key Resistance Zone: 1.36000 – 1.36200
Price has been rejected multiple times from this upper zone (marked in red).
Repeated upper wicks and lower closes signal selling pressure.
Recent candle formations suggest a potential reversal from this level.
🟢 Major Support Zones:
1.33090 (Mid-Level Support)
This level has acted as a reaction zone in the past.
Could provide temporary consolidation or bounce.
1.31500 – 1.32000
Strong historical support, price bounced here previously.
Bears might slow down in this area before continuation.
1.28000 – 1.29000
Deeper support zone; if broken, could indicate a major trend shift.
📉 Bearish Projection
Price is expected to descend toward 1.33090, and if momentum continues, potentially down to the 1.28 region.
The zigzag projection in the black box reflects a stair-step pattern typical of strong bearish legs.
🧠 Market Psychology & Price Action
Sellers are defending the resistance aggressively.
Lower highs and consistent rejection candles imply weakening bullish momentum.
This setup aligns with a distribution phase before a drop.
📌 Conclusion
🔻 As long as the price remains below the 1.36000 resistance, the bias remains bearish. Watch for confirmations at 1.33090 and 1.32000 – these are crucial zones where price decisions will unfold.
📆 Short to mid-term traders may look for sell setups on retracements with stop-losses above the resistance and targets near support zones.

GBPUSDGBPUSD needs one more push up before a drop.
Disclosure: We are part of Trade Nation's Influencer program and receive a monthly fee for using their TradingView charts in our analysis.

GBP/USD Rally Resumes – Bullish Targets AheadHi everyone,
As outlined in our previous GBP/USD analysis (idea linked below), the Cable confirmed its continued rally following a decisive break above the 1.35195 level. This was quickly followed by a move through our highlighted levels at 1.35630 and 1.35934.
As previously noted, the clearance of these levels strengthens our expectation for further upside, with the next key level of interest around 1.36850. We'll be watching to see how price action develops from here.
We’ll continue to provide updates on the projected path for GBP/USD as price approaches this target.
The longer-term outlook remains bullish, and we expect the rally to continue extending further from the 1.20991 January low.
We’ll be keeping you updated throughout the week with how we’re managing our active ideas. Thanks again for all the likes/boosts, comments and follows — we appreciate the support!
All the best for the week ahead. Trade safe.
BluetonaFX

GBPUSD ready to jump?GBPUSD after retest of the daily support has got a bounce back to the upside with a momentum as the price already has got rejected back, we may see potential trend continuation. We can spot the double bottom on the lower timeframe from this support and may continue to rise to the resistance. A bullish trade is high probable after confirmation of potential inverted head and shoulder

GBPUSD Edges HigherGBPUSD Edges Higher
GBP/USD is attempting a fresh increase above the 1.3500 resistance.
Important Takeaways for GBP/USD Analysis Today
- The British Pound is attempting a fresh increase above 1.3515.
- There was a break above a key bearish trend line with resistance at 1.3535 on the hourly chart of GBP/USD at FXOpen.
GBP/USD Technical Analysis
On the hourly chart of GBP/USD at FXOpen, the pair declined after it failed to clear the 1.3615 resistance. The British Pound even traded below the 1.3575 support against the US Dollar.
Finally, the pair tested the 1.3500 zone and is currently attempting a fresh increase. The bulls were able to push the pair above the 50-hour simple moving average and 1.3540. There was a break above a key bearish trend line with resistance at 1.3535.
The pair tested the 50% Fib retracement level of the downward move from the 1.3616 swing high to the 1.3507 low. It is now showing positive signs above 1.3540.
On the upside, the GBP/USD chart indicates that the pair is facing resistance near 1.3575 and the 61.8% Fib retracement level of the downward move from the 1.3616 swing high to the 1.3507 low.
The next major resistance is near 1.3590. A close above the 1.3590 resistance zone could open the doors for a move toward 1.3615. Any more gains might send GBP/USD toward 1.3650.
On the downside, immediate support is near the 1.3515. If there is a downside break below 1.3515, the pair could accelerate lower. The first major support is near the 1.3500 level. The next key support is seen near 1.3450, below which the pair could test 1.3420. Any more losses could lead the pair toward the 1.3350 support.
This article represents the opinion of the Companies operating under the FXOpen brand only. It is not to be construed as an offer, solicitation, or recommendation with respect to products and services provided by the Companies operating under the FXOpen brand, nor is it to be considered financial advice.

GBPUSD(20250609)Today's AnalysisMarket news:
Fed Harker: Amid uncertainty, the Fed may still cut interest rates later this year. Musallem: There is a 50% chance that the trade war will lead to a sustained inflation outbreak. Tariffs may push up inflation within one or two quarters. The ECB cut three key interest rates by 25 basis points. Lagarde hinted that the rate cut cycle will end, and the market is no longer fully pricing in another 25 basis point rate cut this year.
Technical analysis:
Today's buying and selling boundaries:
1.3538
Support and resistance levels:
1.3615
1.3586
1.3568
1.3509
1.3491
1.3462
Trading strategy:
If the price breaks through 1.3538, consider buying in, with the first target price of 1.3568
If the price breaks through 1.3509, consider selling in, with the first target price of 1.3491

GBPUSDGBPUSD needs some more downside before a further push up towards 1.365 level.
Disclosure: We are part of Trade Nation's Influencer program and receive a monthly fee for using their TradingView charts in our analysis.

GBPUSD(20250605)Today's AnalysisMarket news:
U.S. economic data-① ADP employment increased by 37,000 in May, far below the expected 110,000 and the previous value of 62,000. ② The U.S. ISM non-manufacturing index in May fell to 49.9, shrinking for the first time in nearly a year, and the expected increase was from 51.6 to 52.
Technical analysis:
Today's buying and selling boundaries:
1.3543
Support and resistance levels:
1.3622
1.3593
1.3574
1.3513
1.3494
1.3465
Trading strategy:
If the price breaks through 1.3574, consider buying, and the first target price is 1.3593
If the price breaks through 1.3543, consider selling, and the first target price is 1.3513

GBPUSD(20250604)Today's AnalysisMarket news:
Fed Logan: We should focus on achieving the 2% inflation target rather than trying to make up for past inflation shortfalls; Bostic: We still think there may be a rate cut this year.
Technical analysis:
Today's buying and selling boundaries:
1.3521
Support and resistance levels:
1.3588
1.3563
1.3547
1.3496
1.3480
1.3455
Trading strategy:
If the price breaks through 1.3547, consider buying, with the first target price at 1.3563
If the price breaks through 1.3521, consider selling, with the first target price at 1.3496

First GU analysis, GU is heading towards resistanceGBPUSD has hit the old breakout support zone and is bouncing in today's US session. When GU closed above 1.351 on h1, it confirmed a nice BUY signal. Target is towards 1.355. In case it closes below 1.351, we have to wait for further confirmation to have a trading strategy.
Do you agree with me?

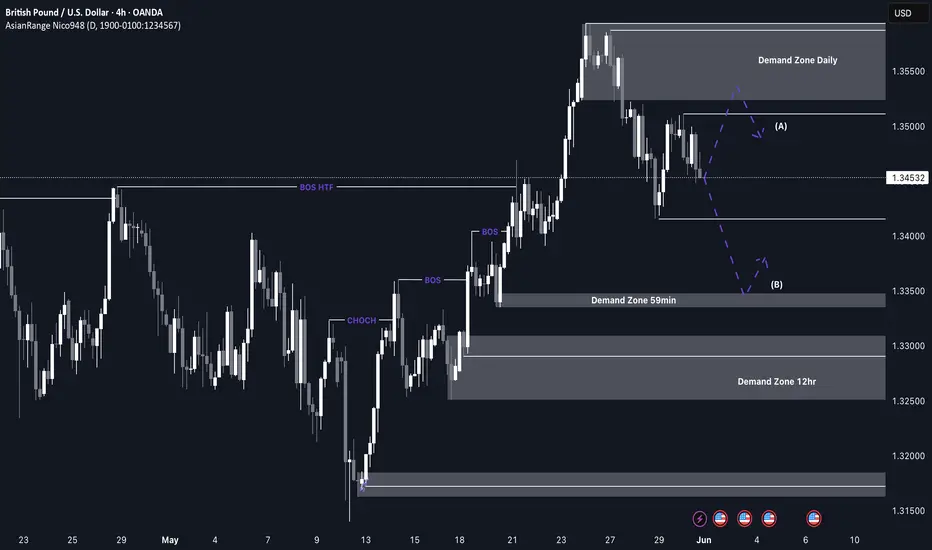
GBP/USD Shorts from the daily supplyI’m anticipating a potential retracement as price has been heavily bullish and is now beginning to show signs of being overbought. After recently breaking major structure to the upside, there’s room for a temporary sell-off as price corrects before continuing higher.
I’ll be watching for possible reactions from the 59-minute demand zone for a minor bounce, but the more ideal long opportunity would be at the 12H demand zone around 1.3300, where structure is cleaner and confluences align.
Confluences for Short-Term Sells:
- A recent change of character (CHOCH) to the downside signals a shift in momentum
- A clean daily supply zone has been left behind that could initiate a deeper pullback
- Significant liquidity below, including the Asia low, ready to be swept
- For price to maintain long-term bullish movement, it must first correct, fill imbalances, and mitigate valid demand levels
P.S. If price drops further and breaks structure, we’ll likely see a new supply zone form. This will provide a closer and more refined opportunity to participate in the move.
Stay sharp and trade safe! 📉📈
GBP/USD Correction Potentially Complete – Key Breakout LevelsHi everyone,
GBP/USD has been undergoing a short-term correction since the start of the week. Our view is that this correction may now be complete, with the bullish trend potentially resuming.
For confirmation, we’re watching for a break above the 1.35195 level, followed by a move through 1.35934.
If these levels are cleared, we anticipate further upside. We’ll continue to share updates on the projected path for GBP/USD should price action reach our key zone.
The longer-term outlook remains bullish, and we expect the rally to extend further from the 1.20991 January low.
We’ll be keeping you updated throughout the week with how we’re managing our active ideas. Thanks again for all the likes/boosts, comments and follows — we appreciate the support!
All the best for the week ahead. Trade safe.
BluetonaFX

GBP/USD Analysis: Price Searching for SupportGBP/USD Analysis: Price Searching for Support
In the second half of May, the British pound showed notable strength: from its 12 May low, GBP/USD climbed to a peak on 26 May — marking its highest level in over three years.
Demand for the pound has been driven by several factors:
→ A surge in inflation. CPI data released last Wednesday came in above expectations. As a result, market participants interpreted this as a reason for the Bank of England to remain cautious about cutting interest rates. Holding rates at elevated levels is generally considered bullish for the pound.
→ The pound’s relative resilience amid trade tensions, particularly following a newly signed agreement with the US, as well as strengthening trade ties between the UK and the EU.
Can the pound continue to rise? The GBP/USD chart offers reasons for doubt.
Technical Analysis of the GBP/USD Chart
Recent price movements have formed an ascending channel (outlined in blue), and earlier this week, demand was so strong that the pair briefly moved above the upper boundary. But what happened next?
That strong buying momentum appears to have faded — resulting in a sequence of lower highs (A→B→C→D), suggesting that the market may be searching for a foothold. Today’s bounce (highlighted by the arrow) hints that such a foothold may have been found. But how reliable is it? And can the uptrend be resumed?
→ From a bullish perspective: Support may be provided by the lower boundary of the channel, reinforced by the 1.345 level.
→ From a bearish perspective: The 1.352 level is acting as resistance, further strengthened by the median line.
It is possible that the area marked by lower highs (A→B→C→D) could ultimately prove to be an insurmountable barrier for the developing uptrend on the GBP/USD chart.
This article represents the opinion of the Companies operating under the FXOpen brand only. It is not to be construed as an offer, solicitation, or recommendation with respect to products and services provided by the Companies operating under the FXOpen brand, nor is it to be considered financial advice.

GBPUSD Near Key Resistance – Watching for PullbackGBPUSD has surged to test the 1.3538 resistance, forming a strong impulsive rally supported by higher lows and tight bullish consolidation patterns. However, price is now pressing into a major horizontal resistance and rising trendline, setting up for either continuation or correction.
Key Levels:
Major Resistance: 1.35389 (previous high, potential double top)
Trendline Support: ~1.3440 (ascending structure)
Downside Target (if break occurs): 1.3140 (range floor)
Scenarios to Watch:
🔹 Bearish Scenario (Primary Watch)
Price reacts to 1.3538 and forms a rejection candle
Break of the ascending trendline may trigger a retracement
Downside target zones:
1.3440 (initial structure)
1.3140 (major support zone)
🔹 Bullish Breakout (Alternate Scenario)
Clean break and close above 1.3538
Would invalidate short-term correction and open path to new highs
Momentum continuation possible toward 1.3600–1.3700
Pattern Notes:
Bullish structure with minor flags and wedges in the uptrend
But rally is extended and hitting overbought territory near resistance
RSI divergence or reversal patterns around this level would strengthen short case
Conclusion:
📌 GBPUSD is at a major resistance. Watch for rejection or breakout.
📌 If it holds below 1.3538 and breaks trendline, short setup is favored.
📌 If it breaks out above 1.3538 with volume, stay out of shorts and wait for retest.
