GBPUSD(20250321)Today's AnalysisToday's buy and sell boundaries: 1.2972
Support and resistance levels:
1.3050
1.3021
1.3002
1.2943
1.2924
1.2895
Trading strategy:
If the price breaks through 1.2972, consider buying, the first target price is 1.3002
If the price breaks through 1.2943, consider selling, the first target price is 1.2924
Gbpusdtrade

GBPUSD Trade IdeaGBPUSD is showing bullish momentum. In this video, we explore a trade idea that involves a retracement to the 50% equilibrium level of the previous price swing. This is not financial advice.

GBPUSD(20250320)Today's AnalysisToday's buying and selling boundaries: 1.2989
Support and resistance levels:
1.3045
1.3024
1.3010
1.2967
1.2954
1.2933
Trading strategy:
If the price breaks through 1.3010, consider buying, the first target price is 1.3024
If the price breaks through 1.2989, consider selling, the first target price is 1.2967
GbpUsd is approaching a strong sell zoneExactly one week ago, I pointed out that while TRADENATION:GBPUSD strength persists, the pair is approaching a significant sell zone , starting at the psychological level of 1.30.
This level was touched recently, and the pair is currently fluctuating within this range now.
My view remains the same: GBP/USD is likely to experience a drop in the near future, and I’m now looking for potential entries for a swing trade.
As mentioned before, 1.30 is a key psychological level, with the technical resistance just above it at 1.3050. Additionally, GBP/USD is known for its volatility, and this resistance zone extends slightly above 1.31.
In conclusion, traders should consider selling rallies, with a target around 1.27, aiming for at least a 1:2 risk-to-reward ratio when setting their stop loss.
Disclosure: I am part of Trade Nation's Influencer program and receive a monthly fee for using their TradingView charts in my analyses and educational articles.

GBPUSDCable is getting ready for pullback, it's still showing upwards momentum for short term but above the top it can start the drop this week.
Disclosure: We are part of Trade Nation's Influencer program and receive a monthly fee for using their TradingView charts in our analysis.

GBPUSD Trading Strategy for Next WeekIf no major unexpected situations occur, the GBP/USD is most likely to embark on a downward journey. Dominated by bears, it will gradually decline in a volatile manner, testing the key support level below.
GBPUSD Trading Strategy for Next Week:
GBPUSDsell@1.2930-1.2980
tp:1.2900-1.2850
sl:1.3000
I firmly believe that realized profits and a high win rate are the best measures of trading proficiency.
Every day, I share highly accurate trading signals. These signals include precise entry points, stop-loss levels for risk control, and profit targets derived from in-depth analysis.
Follow me to unlock substantial returns in the financial markets.
Click on my profile to access trading guides on market trends, trading strategies, and risk management.

GBP/USD "The Cable" Forex Market Bullish Heist Plan🌟Hi! Hola! Ola! Bonjour! Hallo! Marhaba!🌟
Dear Money Makers & Robbers, 🤑💰🐱👤🐱🏍
Based on 🔥Thief Trading style technical and fundamental analysis🔥, here is our master plan to heist the GBP/USD "The Cable" Forex market. Please adhere to the strategy I've outlined in the chart, which emphasizes long entry. Our aim is the high-risk Red Zone. Risky level, overbought market, consolidation, trend reversal, trap at the level where traders and bearish robbers are stronger. 🏆💸Book Profits Be wealthy and safe trade.💪🏆🎉
Entry 📈 : "The vault is wide open! Swipe the Bullish loot at any price - the heist is on!
however I advise placing Buy limit orders within a 15 or 30 minute timeframe. Entry from the most recent or closest low or high level should be in retest.
Stop Loss 🛑: Thief SL placed at (1.25500) swing Trade Basis Using the 6H period, the recent / swing low level.
SL is based on your risk of the trade, lot size and how many multiple orders you have to take.
Target 🎯: 1.29300 (or) Escape Before the Target
🧲Scalpers, take note 👀 : only scalp on the Long side. If you have a lot of money, you can go straight away; if not, you can join swing traders and carry out the robbery plan. Use trailing SL to safeguard your money 💰.
📰🗞️Fundamental, Macro, COT Report, Quantitative Analysis, Intermarket Analysis, Sentimental Outlook:
GBP/USD "The Cable" Forex Market market is currently experiencing a bullish trend,., driven by several key factors.
🔰Fundamental Analysis
1. Economic Indicators: The UK's GDP growth rate, inflation rate, interest rate, and employment figures are strong, supporting a bullish outlook.
2. Central Bank Policies: The Bank of England's decision to keep interest rates low has weakened the pound, but the Federal Reserve's hawkish stance has strengthened the dollar.
3. Fiscal Policies: The UK government's spending and taxation policies have been neutral, while the US government's policies have been supportive of economic growth.
🔰Macroeconomic Factors
1. Trade Balance: The UK's trade balance has improved, supporting a bullish outlook.
2. Political Stability: The UK's political stability has improved, while the US's political stability has been neutral.
3. Global Economic Trends: Global economic trends have been supportive of a bullish outlook.
🔰Global Market Analysis
1. Commodity Prices: Commodity prices have been neutral, with oil prices steady and gold prices slightly higher.
2. Currency Correlations: The GBP/USD pair has a strong positive correlation with the EUR/USD pair.
3. Global Economic Trends: Global economic trends have been supportive of a bullish outlook.
🔰COT Data
1. Commitment of Traders Report: The report shows that commercial traders are net long, while non-commercial traders are net short.
2. Open Interest: Open interest has increased, indicating a potential trend reversal.
3. Commercial Positions: Commercial traders' positions indicate a bullish outlook.
🔰Intermarket Analysis
1. Correlations with Other Markets: The GBP/USD pair has a strong positive correlation with the EUR/USD pair and a negative correlation with the USD/JPY pair.
2. Divergences: There are no significant divergences between the GBP/USD pair and other markets.
🔰Quantitative Analysis
1. Technical Indicators: Technical indicators, such as moving averages and RSI, indicate a bullish outlook.
2. Statistical Models: Statistical models, such as regression analysis, indicate a bullish outlook.
🔰Market Sentiment Analysis
1. Trader Sentiment: Trader sentiment is bullish, with a majority of traders expecting the pair to rise.
2. Sentiment Indicators: Sentiment indicators, such as sentiment indexes and put-call ratios, indicate a bullish outlook.
🔰Positioning
1. Long/Short Positions: Long positions are increasing, while short positions are decreasing.
2. Positioning Data: Positioning data indicates a bullish outlook.
🔰Next Trend Move
1. Bullish/Bearish Outlook: The outlook is bullish, with a potential target of 1.3000.
2. Trend Analysis: Trend analysis indicates a potential trend reversal.
🔰Overall Summary Outlook
1. Bullish Outlook: The overall outlook is bullish, with a potential target of 1.3000.
2. Volatility Expected: Volatility is expected to remain high in the short term.
📌Keep in mind that these factors can change rapidly, and it's essential to stay up-to-date with market developments and adjust your analysis accordingly.
⚠️Trading Alert : News Releases and Position Management 📰 🗞️ 🚫🚏
As a reminder, news releases can have a significant impact on market prices and volatility. To minimize potential losses and protect your running positions,
we recommend the following:
Avoid taking new trades during news releases
Use trailing stop-loss orders to protect your running positions and lock in profits
💖Supporting our robbery plan 💥Hit the Boost Button💥 will enable us to effortlessly make and steal money 💰💵. Boost the strength of our robbery team. Every day in this market make money with ease by using the Thief Trading Style.🏆💪🤝❤️🎉🚀
I'll see you soon with another heist plan, so stay tuned 🤑🐱👤🤗🤩

GBP/USD Strength Persists, but Watch for Reversal at 1.30Similar to EUR/USD, GBP/USD experienced a strong rally starting in March, breaking above the key resistance level in the 1.2775 zone.
Over the past three days, the pair has consolidated well above the broken resistance level, suggesting that another upward spike is likely.
However, the 1.30 level is both a significant technical and psychological barrier. If the price reaches this zone, a correction could follow.
In conclusion, I’m closely watching the pair, and if we see a spike toward 1.30, I will look for selling opportunities.
Disclosure: I am part of Trade Nation's Influencer program and receive a monthly fee for using their TradingView charts in my analyses and educational articles.

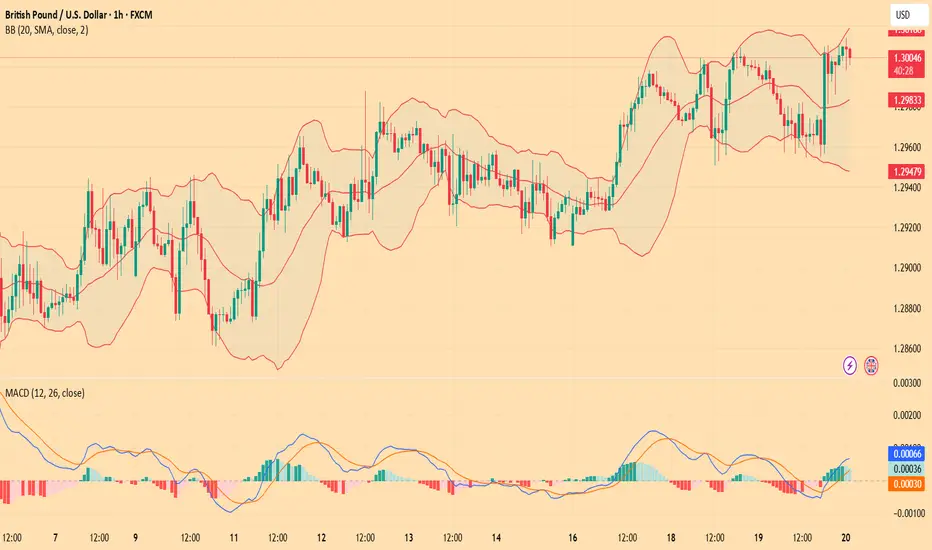
GBPUSD IS SELL SETUPwe will look sell from bb are you ready for sell dont forget to share your likes comments and thoughts

BUY GBPUSDBUY Confirmations....
- Bullish CHoCH
- Trading above QP 1.275 (Next stop 1.3?)
- M15 Bullish FVG
- H1 Bullish FVG
- USD news was negative
My entry, stop loss, and final target is on the chart

GBP/USD "The Cable" Forex Market Bullish Heist Plan🌟Hi! Hola! Ola! Bonjour! Hallo!🌟
Dear Money Makers & Robbers, 🤑💰🐱👤🐱🏍
Based on 🔥Thief Trading style technical and fundamental analysis🔥, here is our master plan to heist the GBP/USD "The Cable" Forex market. Please adhere to the strategy I've outlined in the chart, which emphasizes long entry. Our aim is the high-risk Red Zone. Risky level, overbought market, consolidation, trend reversal, trap at the level where traders and bearish robbers are stronger. 🏆💸Book Profits Be wealthy and safe trade.💪🏆🎉
Entry 📈 : "The vault is wide open! Swipe the Bullish loot at any price - the heist is on!
however I advise placing Buy limit orders within a 15 or 30 minute timeframe. Entry from the most recent or closest low or high level should be in retest.
Stop Loss 🛑: Thief SL placed at 1.23750 (swing Trade) Using the 4H period, the recent / nearest low level.
SL is based on your risk of the trade, lot size and how many multiple orders you have to take.
Target 🎯: 1.28000 (or) Escape Before the Target
Scalpers, take note 👀 : only scalp on the Long side. If you have a lot of money, you can go straight away; if not, you can join swing traders and carry out the robbery plan. Use trailing SL to safeguard your money 💰.
📰🗞️Fundamental, Macro, COT, Sentimental Outlook:
GBP/USD "The Cable" Forex Market market is currently experiencing a bullish trend,., driven by several key factors.
🔰 Fundamental Analysis
The current price of GBP/USD is 1.25110, with a slight increase from the previous day's open price of 1.23935. This upward movement could be attributed to the UK's economic indicators, such as GDP growth rate, inflation rate, and employment data.
🔰 Macroeconomic Analysis
From a macroeconomic perspective, the UK's economy has been experiencing a slowdown due to Brexit uncertainties and global economic downturn. However, the Bank of England's monetary policy decisions, such as interest rate changes, have been influencing the GBP/USD exchange rate.
🔰 COT Report
Net Long Positions: Institutional traders have increased their net long positions in GBP/USD to 60%
COT Ratio: The COT ratio has risen to 2.5, indicating a bullish trend
Non-Commercial Traders: Non-commercial traders, such as hedge funds and individual traders, have increased their long positions to 65%
🔰 Technical Analysis
Trend Line: The pair is holding comfortably above the ascending trend line
Moving Averages: The 200-period and 100-period Simple Moving Averages (SMA) are indicating a bullish bias
Relative Strength Index (RSI): The RSI indicator on the 4-hour chart stays above 50, indicating a bullish trend
🔰 Market Sentiment
Bullish Sentiment: 63% of client accounts are long on this market, indicating a bullish sentiment
Bearish Sentiment: 37% of client accounts are short on this market, indicating a bearish sentiment.
🔰 Positioning Data Analysis
Institutional Traders: Institutional traders are positioning themselves for a bullish trend, with some predicting a move to 1.28000.
Corporate Traders: Corporate traders are also monitoring the pair's performance, considering factors like interest rates and global economic trends
🔰 Overall Outlook
Bullish Trend: The GBP/USD pair is expected to continue its bullish trend, with potential upside to 1.28000.
⚠️Trading Alert : News Releases and Position Management 📰 🗞️ 🚫🚏
As a reminder, news releases can have a significant impact on market prices and volatility. To minimize potential losses and protect your running positions,
we recommend the following:
Avoid taking new trades during news releases
Use trailing stop-loss orders to protect your running positions and lock in profits
📌Please note that this is a general analysis and not personalized investment advice. It's essential to consider your own risk tolerance and market analysis before making any investment decisions.
📌Keep in mind that these factors can change rapidly, and it's essential to stay up-to-date with market developments and adjust your analysis accordingly.
💖Supporting our robbery plan will enable us to effortlessly make and steal money 💰💵 Tell your friends, Colleagues and family to follow, like, and share. Boost the strength of our robbery team. Every day in this market make money with ease by using the Thief Trading Style.🏆💪🤝❤️🎉🚀
I'll see you soon with another heist plan, so stay tuned 🫂

GBP/USD hovers around 1.2600GBP/USD is holding minor support near 1.2600 during the European session on Monday, boosted by a retreat in the US Dollar amid improved risk appetite and a possible truce in Ukraine. However, gains are limited by upcoming US tariffs and geopolitical concerns.

GBP/USD Bullish Recovery – Key Levels for a Breakout & ReversalHello, buddies.
Given the decline, the price has now established a solid floor, and we expect it to continue growing; nevertheless, we must enter a price correction, therefore we have selected the best possible support point for you...
We will wait for a new ceiling to be registered before proceeding with the purchase transaction, but with careful risk and capital management.
*Trade safely with us*
Overview:
The GBP/USD 4-hour chart shows a potential bullish reversal after a significant downtrend. Price has formed a double-bottom pattern and has broken out of a descending trendline, signaling a shift in momentum. The chart highlights key areas of support and resistance that traders should watch for confirmation of a sustained move higher.
Key Technical Analysis:
Fake Breakout: A false breakdown below the trendline in August led to a sharp recovery, confirming a liquidity grab before a bullish continuation.
Trendline Breakout: The price has successfully broken the descending trendline (orange line), indicating potential bullish strength.
Support Zones:
Blue Zone (~1.2450 - 1.2500): A strong demand area where buyers may re-enter.
Purple Zone (~1.2120 - 1.2200): A deeper support level, acting as the last line of defense for bulls.
Fibonacci Levels & Targets:
1.2785: First key resistance level.
1.3022: A major resistance and potential breakout zone.
1.3242: Final bullish target if momentum continues.
Trade Plan:
📌 Buy Limit Entry: Around 1.2450-1.2500 (if price retests the support zone).
🎯 Target 1: 1.2785
🎯 Target 2: 1.3022
🎯 Target 3: 1.3242
🛑 Stop Loss: Below 1.2400 to minimize risk.
Conclusion:
The GBP/USD pair is showing signs of a potential bullish reversal. A short-term pullback to the blue support zone could provide an optimal buying opportunity before a strong upward move. However, a break below 1.2400 could invalidate this bullish setup, leading to a deeper correction.
🚀 Bullish Bias if Key Support Holds! 🚀

GBPUSD Analysishello friends
Considering the drop we had, now the price has made a good floor and we expect it to continue its growth, but we have to enter into price correction, so we identified the best possible support point for you...
We will wait for a new ceiling to be registered and then enter into the purchase transaction, but with risk and capital management.
*Trade safely with us*

GBPUSD Rally: Will It Retrace? Key Liquidity Zones & Trada Idea.📈 The GBP/USD has seen a significant rally recently, with previous highs on the weekly and daily higher timeframes acting as potential upside targets. But the big question is: how far could the pair retrace? 🤔 On the daily timeframe, we can clearly see a bullish imbalance that might serve as an internal range liquidity target for a pullback. This aligns with the market's natural behavior of seeking liquidity and rebalancing inefficiencies. 🔄
In this video, we dive into the trend 📊, market structure 🧩, and price action 🎯, discussing key factors like the imbalance and liquidity dynamics to keep in mind. Plus, we share a trade idea based on a specific set of rules on the 15-minute timeframe ⏱️.
⚠️ Not financial advice – this is for educational purposes only! 🚨

GBPUSD: Gains remain capped below 1.2700The Relative Strength Index (RSI) indicator on the 4-hour chart pulls back towards 60 after slightly exceeding 70 on Thursday, indicating that the bullish bias remains strong following a technical correction.
GBP/USD encounters a pivot level at 1.2650 (Fibonacci 78.6% retracement of the latest uptrend). If the pair can sustain above this level and establish it as support, the 1.2700-1.2710 range (round level, static level) might act as the next resistance before reaching 1.2750 (static level).
On the downside, 1.2600 (round level, static level) acts as the first support, followed by 1.2530 (Fibonacci 61.8% retracement) and 1.2500 (round level, static level).

GBPUSD: hovers around 1.2600GBP/USD holds ground around 1.2600 in the European session on Thursday. The pair is helped by a modest US Dollar downtick but broad risk-off mood due to renewed tariff threats from US President Donald Trump could limit the risk sensitive Pound Sterling.
GBP/USD Technical Overview
The Relative Strength Index (RSI) indicator on the 4-hour chart declines toward 50, reflecting a loss of bullish momentum. On the downside, 1.2530 (Fibonacci 61.8% retracement level of the latest downtrend) aligns as first resistance before 1.2500 (round level, static level) and 1.2470 (100-period Simple Moving Average).
Looking north, first resistance could be spotted at 1.2650 (Fibonacci 78.6% retracement) before 1.2700-1.2710 (round level, static level).

GBPUSD - Long from trendline !!Hello traders!
‼️ This is my perspective on GBPUSD.
Technical analysis: Here we are in a bullish market structure from daily timeframe perspective, so I look for a long. My point of interest is rejection from trendline + LZ around level 1.25000.
Like, comment and subscribe to be in touch with my content!

GBPUSD Bullish Breakout!
HI,Traders !
GBP-USD made a bullish
Breakout of the key horizontal
Level of 1.24997 which is now
A support and as the breakout
Is confirmed we will be expecting
A further bullish move up !
Comment and subscribe to help us grow !

GBPUSD Weekly BiasI do anticipate that this price might continue with the bullish momentum, targeting buyside liquidity at 1.281. My optimum entry position will be at 1.2552 (with confirmation from a lower time frame)

GbpUsd could continue its reboundAfter breaking above the falling trendline from the end of January, GBP/USD has entered a consolidation phase between 1.23 and 1.25.
Recently, the pair tested the support zone once more and began to rebound.
In my opinion, the upward movement will continue, and we could see a test of the next resistance above 1.26.
In conclusion, I am looking to buy dips below 1.24, with invalidation occurring on a daily close below 1.23.
Disclosure: I am part of Trade Nation's Influencer program and receive a monthly fee for using their TradingView charts in my analysis.

GBPUSD AnalysisGBPUSD Analysis
The GBP/USD pair has been in a predominantly bearish trend since September of last year, although there have been occasional corrective rallies. Despite these minor pullbacks, the overall direction of the pair has remained downward over the period.
However, I believe that the bearish trend may have concluded. The pair has recently broken through a key structural resistance level, and the candle has closed decisively above this barrier, which is a strong indication of a potential shift in momentum. This breakout suggests a bullish setup could be forming, signaling a possible reversal in the pair's trajectory.
It is important to note that this is my personal analysis and should not be interpreted as financial advice or a trading signal. If you would like to explore my reasoning further, feel free to engage in the comments section, and I would welcome your thoughts on whether the pair is now poised for a bullish move or if the bearish trend may persist.
As always, thorough research and careful risk management are essential before making any trading decisions. Let me know what your perspective is—bullish or bearish—for this pair moving forward.

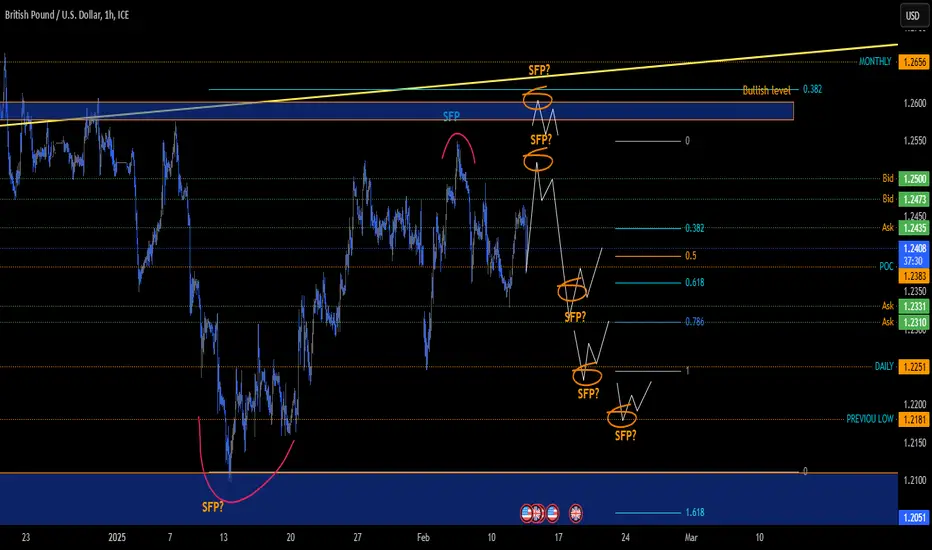
Scenario on GBPUSD 12.2.2025I see the GBPUSD market so that if I were to look for a short, the first one I like is the level for a possible sfp around the price of 1.2520, if the market were to break through the price level, then the next sfp could come into consideration around the resistance of 1.26-1.258, which is also a bulls zone, if I am to take long positions into account, the first one could come at the sfp at the level of 1.231 and the next up to the daily level 1.2251