GBP/USD Robbery: Can You Grab the Cash Before the Cops Arrive?🚨 GBP/USD "The Cable" forex bank Heist Alert: The Bullish Breakout Robbery Plan (Swing & Scalp Strategy) 🚨
🌟 Hi! Hola! Ola! Bonjour! Hallo! Marhaba! 🌟
Attention Money Makers & Market Robbers! 🤑💰💸
Based on the 🔥Thief Trading Style🔥, here’s our master plan to loot the GBP/USD "The Cable" forex bank. Follow the strategy on the chart—focusing on LONG entries—and escape near the high-risk Red Zone. This area is overbought, consolidating, and a potential reversal trap where bears lurk. 🏆 Take profits fast—you’ve earned it! 💪
🎯 Heist Entries:
📈 Entry 1: "The Breakout Heist!" – Wait for Resistance (1.36200) to break, then strike! Bullish profits await.
📈 Entry 2: "Big Players’ Pullback!" – Jump in at 1.34000+ buy above at any price for a safer steal.
🔔 Pro Tip: Set a chart alert to catch the breakout instantly!
🛑 Stop Loss Rules:
*"Yo, listen! 🗣️ If you’re entering with a buy-stop, DON’T set your SL until AFTER the breakout. Place it at the nearest swing low (3H timeframe) or wherever your risk allows—but remember, rebels risk more! 🔥"*
🏴☠️ Target: 1.37500
🧲 Scalpers: Only play LONG! Use trailing SL to lock in profits. Big wallets? Go all in. Small stacks? Join the swing heist!
📊 Market Pulse:
The GBP/USD "The Cable" is neutral but primed for bullish momentum. Watch:
Fundamentals (COT, Macro, Geopolitics)
Sentiment & Intermarket Trends
Positioning & Future Targets & Overall score
📌 Check our bioo linkks for deep analysis! 🔗🌍
⚠️ Trading Alert:
News = Volatility! Protect your loot:
Avoid new trades during major news
Use trailing stops to secure profits
💥 Boost This Heist!
Hit 👍 & 🔄 to strengthen our robbery crew! Let’s dominate the market daily with the Thief Trading Style. 🚀💵
Stay tuned—another heist drops soon! 🎯🐱👤
Gbpusdtradeideas

GBP/USD HEIST ALERT: Bullish Breakout or Bearish Trap?🌟 Hey! Hola! Ola! Bonjour! Hallo! Marhaba! 🌟
Calling all Market Robbers & Profit Pirates!💸💰
🔥 Thief Trading Intel: Our crew’s latest heist targets GBP/USD "The Cable"—bullish breakout incoming! Long entry only. High-risk Red Zone ahead: overbought, consolidating, and ripe for a reversal. Don’t get caught in the bear trap! 🏴☠️
"Take your loot and run, trader—you’ve earned this steal!" 💪🎯
🚪 ENTRY: The Heist Begins!
📈 "Wait for MA breakout (1.36000) then STRIKE—bullish profits await!"
Option 1: Buy Stop above Pink Resistance (breakout confirmation).
Option 2: Buy Limit at swing low/high (15-30 min TF).
📌 Pro Tip: SET AN ALERT! Don’t miss the breakout.
🛑 STOP LOSS: Escape Route
🔊 "Yo, listen up! 🗣️
Buy Stop orders? NO SL until after breakout! 🚀
Rebels: Place SL wherever—but you’ve been warned! ⚠️🔥
📍 Thief SL (Smart Crew): Recent/swing low (1.35000, 4H TF).
📍 Adjust based on your risk, lot size, and orders.
🎯 TARGET: Loot & Exit!
🎯 1.37500 (or escape early if the market turns!)
⚡ SCALPERS’ QUICK GRAB
👀 Long scalps ONLY!
Big wallets? Raid now.
Small stacks? Join swing traders.
Trailing SL = Your Money Shield! 🛡️💰
📢 WHY THIS HEIST? (GBP/USD Bullish Momentum)
"The Cable" is heating up! Key drivers:
Fundamentals (COT, Macro Data)
Sentiment & Intermarket Trends
Future Targets & Score Outlook
🔗 Full intel? Bio links below! 👉👉
⚠️ TRADING ALERT: News = Danger Zone! 📰🚨
News = Volatility Spikes! Protect your loot:
❌ Avoid new trades during news.
🔒 Trailing SL = Profit Lock.
💖 SUPPORT THE HEIST CREW!
💥 SMASH THAT BOOST BUTTON! 💥
More boosts = easier money grabs!
Stronger crew = bigger heists!
Profit daily with Thief Trading Style! 🏆🚀
Next heist coming soon—stay tuned! 🤑🐱👤🤩

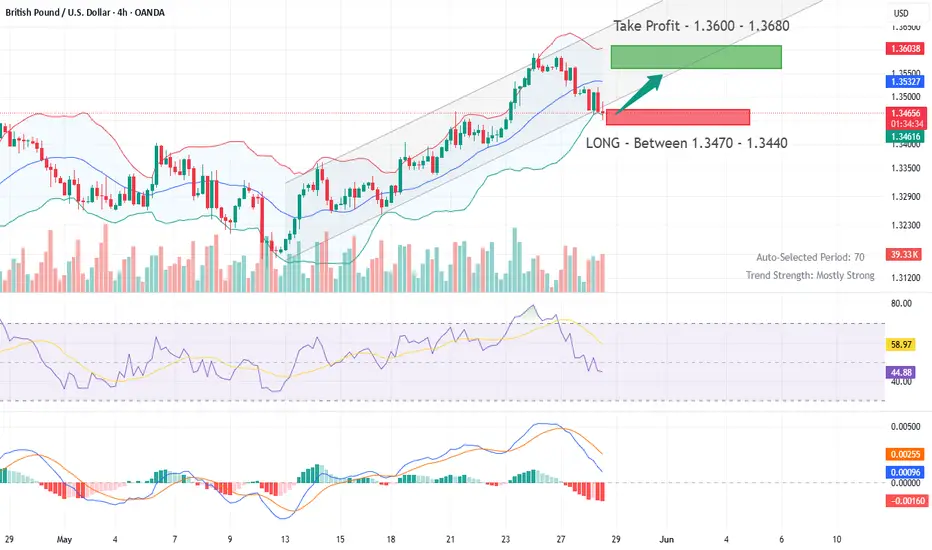
LONG GBP/USD — Trade IdeaLONG GBP/USD — Three Talking Points
Macro & Central-Bank Divergence
UK growth beats, retail sales jump and service-CPI re-accelerates to 5.4 % y/y. Markets have pushed BoE-cut odds to near-zero for June and just one 25 bp trim by year-end, while the Fed is still priced for two cuts in 2025.
IMF nudges 2025 UK GDP up to 1.2 %. In contrast, the dollar narrative is hampered by ballooning U.S. deficit worries and tariff-policy whiplash. Net policy path favours sterling over the dollar.
Technical Structure Remains Bullish
Price action is riding a January-origin ascending channel; Monday’s spike to 1.3600 set a new three-year high, but the pull-back stalled exactly where the 21-DMA, prior breakout shelf and channel floor cluster (mid-1.34s).
14-day RSI ≥ 60 yet still shy of overbought, signalling bullish momentum with room to run.
Holding the 1.3440/70 zone keeps the next leg toward 1.3600/1.3750 in play; only a daily close below 1.3370 would break the channel and negate the setup.
Event Risk Favouring Upside Skew
BoE speakers (Pill today, Bailey tomorrow) are likely to echo the “cautious & gradual” line—supportive, not dovish.
FOMC minutes may sound hawkish, but the market has largely heard it; any dovish nuance quickly re-ignites dollar selling.
Friday’s PCE vs. Tokyo CPI: a soft U.S. core PCE print alongside sticky Japan inflation would weigh on USDJPY and bleed into broader USD softness, lifting cable toward our T1/T2 objectives.
GBP/USD "The Cable" Forex Bank Money Heist (Bearish)🌟Hi! Hola! Ola! Bonjour! Hallo! Marhaba!🌟
Dear Money Makers & Robbers, 🤑💰✈️
Based on 🔥Thief Trading style technical and fundamental analysis🔥, here is our master plan to heist the GBP/USD "The Cable" Forex Market. Please adhere to the strategy I've outlined in the chart, which emphasizes short entry. Our aim is the high-risk GREEN MA Zone. It's a Risky level, oversold market, consolidation, trend reversal, trap at the level where traders and bullish robbers are stronger. 🏆💸"Take profit and treat yourself, traders. You deserve it!💪🏆🎉
Entry 📈 : "The heist is on! Wait for the Neutral Level breakout then make your move at (1.32500) - Bearish profits await!"
however I advise to Place sell stop orders above the Moving average (or) after the Support level Place sell limit orders within a 15 (or) 30 minute timeframe most NEAREST (or) SWING low or high level for Pullback entries.
📌I strongly advise you to set an "alert (Alarm)" on your chart so you can see when the breakout entry occurs.
Stop Loss 🛑: "🔊 Yo, listen up! 🗣️ If you're lookin' to get in on a sell stop order, don't even think about settin' that stop loss till after the breakout 🚀. You feel me? Now, if you're smart, you'll place that stop loss where I told you to 📍, but if you're a rebel, you can put it wherever you like 🤪 - just don't say I didn't warn you ⚠️. You're playin' with fire 🔥, and it's your risk, not mine 👊."
📌Thief SL placed at the nearest/swing High or Low level Using the 1H timeframe (1.33400) Day/Scalping trade basis.
📌SL is based on your risk of the trade, lot size and how many multiple orders you have to take.
Target 🎯: 1.31600
💰💵💸GBP/USD "The Cable" Forex Market Heist Plan (Scalping/Day Trade) is currently experiencing a Bearish trend.., driven by several key factors.👇👇👇
📰🗞️Read the Fundamental, Macro Economics, COT Report, Seasonal Factors, Intermarket Analysis, Inventory and Storage Analysis, Sentimental Outlook, Future trend predict.
Before start the heist plan read it. go ahead to check 👉👉👉🔗🔗🌎🌏🗺
⚠️Trading Alert : News Releases and Position Management 📰 🗞️ 🚫🚏
As a reminder, news releases can have a significant impact on market prices and volatility. To minimize potential losses and protect your running positions,
we recommend the following:
Avoid taking new trades during news releases
Use trailing stop-loss orders to protect your running positions and lock in profits
💖Supporting our robbery plan 💥Hit the Boost Button💥 will enable us to effortlessly make and steal money 💰💵. Boost the strength of our robbery team. Every day in this market make money with ease by using the Thief Trading Style.🏆💪🤝❤️🎉🚀
I'll see you soon with another heist plan, so stay tuned 🤑🐱👤🤗🤩

GBP/USD potential shorts back downMy analysis revolves around a possible bearish reaction from the 2‑hour supply zones. If price does respect these zones, I’ll look for a sell setup to drive price lower—though I’ll approach with caution because there’s liquidity resting just above those points of interest.
Should price push downward, my next target is the 10‑hour demand zone that triggered the recent change of character. This discounted area could spark a bullish response.
Confluences for GU sells are as follows:
- An unmitigated 4‑hour supply zone overhead.
- A “sell‑to‑buy” scenario fits: price sits closer to supply and still needs a retracement.
- Imbalance and untapped liquidity lie below, inviting a move south.
- Liquidity has just been swept above, leaving a clean supply zone behind.
P.S. If price punches through these supply zones and breaks structure to the upside, I’ll watch for the new zone that forms—there could be a nearer‑term long opportunity from there.

GBP/USD "The Cable" Forex Bank Heist Plan (Scalping / Day Trade)🌟Hi! Hola! Ola! Bonjour! Hallo! Marhaba!🌟
Dear Money Makers & Robbers, 🤑💰✈️
Based on 🔥Thief Trading style technical and fundamental analysis🔥, here is our master plan to heist the GBP/USD "The Cable" Forex Bank. Please adhere to the strategy I've outlined in the chart, which emphasizes short entry. Our aim is the high-risk Green Zone. Risky level, oversold market, consolidation, trend reversal, trap at the level where traders and bullish robbers are stronger. 🏆💸Book Profits Be wealthy and safe trade.💪🏆🎉
Entry 📈 : "The heist is on! Wait for the breakout (1.28877) then make your move - Bearish profits await!"
however I advise placing Sell Stop Orders below the breakout MA or Place Sell limit orders within a 15 or 30 minute timeframe. Entry from the most recent or closest low or high level should be in retest. I Highly recommended you to put alert in your chart.
📌I strongly advise you to set an "alert (Alarm)" on your chart so you can see when the breakout entry occurs.
Stop Loss 🛑: Thief SL placed at 1.29600 (swing / Day Trade Basis) Using the 2H period, the recent / swing high or low level.
SL is based on your risk of the trade, lot size and how many multiple orders you have to take.
Target 🎯: 1.27800 (or) Escape Before the Target
🧲Scalpers, take note 👀 : only scalp on the Short side. If you have a lot of money, you can go straight away; if not, you can join swing traders and carry out the robbery plan. Use trailing SL to safeguard your money 💰.
GBP/USD "The Cable" Forex Bank Heist Plan (Scalping / Day Trade) is currently experiencing a bearishness,., driven by several key factors.
📰🗞️Get & Read the Fundamental, Macro, COT Report, Quantitative Analysis, Sentimental Outlook, Intermarket Analysis, Future trend targets.. go ahead to check 👉👉👉
⚠️Trading Alert : News Releases and Position Management 📰 🗞️ 🚫🚏
As a reminder, news releases can have a significant impact on market prices and volatility. To minimize potential losses and protect your running positions,
we recommend the following:
Avoid taking new trades during news releases
Use trailing stop-loss orders to protect your running positions and lock in profits
💖Supporting our robbery plan 💥Hit the Boost Button💥 will enable us to effortlessly make and steal money 💰💵. Boost the strength of our robbery team. Every day in this market make money with ease by using the Thief Trading Style.🏆💪🤝❤️🎉🚀
I'll see you soon with another heist plan, so stay tuned 🤑🐱👤🤗🤩

GBPUSD Trading Strategy for Next WeekIf no major unexpected situations occur, the GBP/USD is most likely to embark on a downward journey. Dominated by bears, it will gradually decline in a volatile manner, testing the key support level below.
GBPUSD Trading Strategy for Next Week:
GBPUSDsell@1.2930-1.2980
tp:1.2900-1.2850
sl:1.3000
I firmly believe that realized profits and a high win rate are the best measures of trading proficiency.
Every day, I share highly accurate trading signals. These signals include precise entry points, stop-loss levels for risk control, and profit targets derived from in-depth analysis.
Follow me to unlock substantial returns in the financial markets.
Click on my profile to access trading guides on market trends, trading strategies, and risk management.

GBP/USD "The Cable" Forex Market Bullish Heist Plan🌟Hi! Hola! Ola! Bonjour! Hallo! Marhaba!🌟
Dear Money Makers & Robbers, 🤑💰🐱👤🐱🏍
Based on 🔥Thief Trading style technical and fundamental analysis🔥, here is our master plan to heist the GBP/USD "The Cable" Forex market. Please adhere to the strategy I've outlined in the chart, which emphasizes long entry. Our aim is the high-risk Red Zone. Risky level, overbought market, consolidation, trend reversal, trap at the level where traders and bearish robbers are stronger. 🏆💸Book Profits Be wealthy and safe trade.💪🏆🎉
Entry 📈 : "The vault is wide open! Swipe the Bullish loot at any price - the heist is on!
however I advise placing Buy limit orders within a 15 or 30 minute timeframe. Entry from the most recent or closest low or high level should be in retest.
Stop Loss 🛑: Thief SL placed at (1.25500) swing Trade Basis Using the 6H period, the recent / swing low level.
SL is based on your risk of the trade, lot size and how many multiple orders you have to take.
Target 🎯: 1.29300 (or) Escape Before the Target
🧲Scalpers, take note 👀 : only scalp on the Long side. If you have a lot of money, you can go straight away; if not, you can join swing traders and carry out the robbery plan. Use trailing SL to safeguard your money 💰.
📰🗞️Fundamental, Macro, COT Report, Quantitative Analysis, Intermarket Analysis, Sentimental Outlook:
GBP/USD "The Cable" Forex Market market is currently experiencing a bullish trend,., driven by several key factors.
🔰Fundamental Analysis
1. Economic Indicators: The UK's GDP growth rate, inflation rate, interest rate, and employment figures are strong, supporting a bullish outlook.
2. Central Bank Policies: The Bank of England's decision to keep interest rates low has weakened the pound, but the Federal Reserve's hawkish stance has strengthened the dollar.
3. Fiscal Policies: The UK government's spending and taxation policies have been neutral, while the US government's policies have been supportive of economic growth.
🔰Macroeconomic Factors
1. Trade Balance: The UK's trade balance has improved, supporting a bullish outlook.
2. Political Stability: The UK's political stability has improved, while the US's political stability has been neutral.
3. Global Economic Trends: Global economic trends have been supportive of a bullish outlook.
🔰Global Market Analysis
1. Commodity Prices: Commodity prices have been neutral, with oil prices steady and gold prices slightly higher.
2. Currency Correlations: The GBP/USD pair has a strong positive correlation with the EUR/USD pair.
3. Global Economic Trends: Global economic trends have been supportive of a bullish outlook.
🔰COT Data
1. Commitment of Traders Report: The report shows that commercial traders are net long, while non-commercial traders are net short.
2. Open Interest: Open interest has increased, indicating a potential trend reversal.
3. Commercial Positions: Commercial traders' positions indicate a bullish outlook.
🔰Intermarket Analysis
1. Correlations with Other Markets: The GBP/USD pair has a strong positive correlation with the EUR/USD pair and a negative correlation with the USD/JPY pair.
2. Divergences: There are no significant divergences between the GBP/USD pair and other markets.
🔰Quantitative Analysis
1. Technical Indicators: Technical indicators, such as moving averages and RSI, indicate a bullish outlook.
2. Statistical Models: Statistical models, such as regression analysis, indicate a bullish outlook.
🔰Market Sentiment Analysis
1. Trader Sentiment: Trader sentiment is bullish, with a majority of traders expecting the pair to rise.
2. Sentiment Indicators: Sentiment indicators, such as sentiment indexes and put-call ratios, indicate a bullish outlook.
🔰Positioning
1. Long/Short Positions: Long positions are increasing, while short positions are decreasing.
2. Positioning Data: Positioning data indicates a bullish outlook.
🔰Next Trend Move
1. Bullish/Bearish Outlook: The outlook is bullish, with a potential target of 1.3000.
2. Trend Analysis: Trend analysis indicates a potential trend reversal.
🔰Overall Summary Outlook
1. Bullish Outlook: The overall outlook is bullish, with a potential target of 1.3000.
2. Volatility Expected: Volatility is expected to remain high in the short term.
📌Keep in mind that these factors can change rapidly, and it's essential to stay up-to-date with market developments and adjust your analysis accordingly.
⚠️Trading Alert : News Releases and Position Management 📰 🗞️ 🚫🚏
As a reminder, news releases can have a significant impact on market prices and volatility. To minimize potential losses and protect your running positions,
we recommend the following:
Avoid taking new trades during news releases
Use trailing stop-loss orders to protect your running positions and lock in profits
💖Supporting our robbery plan 💥Hit the Boost Button💥 will enable us to effortlessly make and steal money 💰💵. Boost the strength of our robbery team. Every day in this market make money with ease by using the Thief Trading Style.🏆💪🤝❤️🎉🚀
I'll see you soon with another heist plan, so stay tuned 🤑🐱👤🤗🤩

GBP/USD "The Cable" Forex Market Bullish Heist Plan🌟Hi! Hola! Ola! Bonjour! Hallo!🌟
Dear Money Makers & Robbers, 🤑💰🐱👤🐱🏍
Based on 🔥Thief Trading style technical and fundamental analysis🔥, here is our master plan to heist the GBP/USD "The Cable" Forex market. Please adhere to the strategy I've outlined in the chart, which emphasizes long entry. Our aim is the high-risk Red Zone. Risky level, overbought market, consolidation, trend reversal, trap at the level where traders and bearish robbers are stronger. 🏆💸Book Profits Be wealthy and safe trade.💪🏆🎉
Entry 📈 : "The vault is wide open! Swipe the Bullish loot at any price - the heist is on!
however I advise placing Buy limit orders within a 15 or 30 minute timeframe. Entry from the most recent or closest low or high level should be in retest.
Stop Loss 🛑: Thief SL placed at 1.23750 (swing Trade) Using the 4H period, the recent / nearest low level.
SL is based on your risk of the trade, lot size and how many multiple orders you have to take.
Target 🎯: 1.28000 (or) Escape Before the Target
Scalpers, take note 👀 : only scalp on the Long side. If you have a lot of money, you can go straight away; if not, you can join swing traders and carry out the robbery plan. Use trailing SL to safeguard your money 💰.
📰🗞️Fundamental, Macro, COT, Sentimental Outlook:
GBP/USD "The Cable" Forex Market market is currently experiencing a bullish trend,., driven by several key factors.
🔰 Fundamental Analysis
The current price of GBP/USD is 1.25110, with a slight increase from the previous day's open price of 1.23935. This upward movement could be attributed to the UK's economic indicators, such as GDP growth rate, inflation rate, and employment data.
🔰 Macroeconomic Analysis
From a macroeconomic perspective, the UK's economy has been experiencing a slowdown due to Brexit uncertainties and global economic downturn. However, the Bank of England's monetary policy decisions, such as interest rate changes, have been influencing the GBP/USD exchange rate.
🔰 COT Report
Net Long Positions: Institutional traders have increased their net long positions in GBP/USD to 60%
COT Ratio: The COT ratio has risen to 2.5, indicating a bullish trend
Non-Commercial Traders: Non-commercial traders, such as hedge funds and individual traders, have increased their long positions to 65%
🔰 Technical Analysis
Trend Line: The pair is holding comfortably above the ascending trend line
Moving Averages: The 200-period and 100-period Simple Moving Averages (SMA) are indicating a bullish bias
Relative Strength Index (RSI): The RSI indicator on the 4-hour chart stays above 50, indicating a bullish trend
🔰 Market Sentiment
Bullish Sentiment: 63% of client accounts are long on this market, indicating a bullish sentiment
Bearish Sentiment: 37% of client accounts are short on this market, indicating a bearish sentiment.
🔰 Positioning Data Analysis
Institutional Traders: Institutional traders are positioning themselves for a bullish trend, with some predicting a move to 1.28000.
Corporate Traders: Corporate traders are also monitoring the pair's performance, considering factors like interest rates and global economic trends
🔰 Overall Outlook
Bullish Trend: The GBP/USD pair is expected to continue its bullish trend, with potential upside to 1.28000.
⚠️Trading Alert : News Releases and Position Management 📰 🗞️ 🚫🚏
As a reminder, news releases can have a significant impact on market prices and volatility. To minimize potential losses and protect your running positions,
we recommend the following:
Avoid taking new trades during news releases
Use trailing stop-loss orders to protect your running positions and lock in profits
📌Please note that this is a general analysis and not personalized investment advice. It's essential to consider your own risk tolerance and market analysis before making any investment decisions.
📌Keep in mind that these factors can change rapidly, and it's essential to stay up-to-date with market developments and adjust your analysis accordingly.
💖Supporting our robbery plan will enable us to effortlessly make and steal money 💰💵 Tell your friends, Colleagues and family to follow, like, and share. Boost the strength of our robbery team. Every day in this market make money with ease by using the Thief Trading Style.🏆💪🤝❤️🎉🚀
I'll see you soon with another heist plan, so stay tuned 🫂

#GBPUSD 1DAYGBPUSD (1D Timeframe) Analysis
Market Structure:
The price has broken above the downtrend resistance, indicating a potential shift from bearish to bullish momentum. This breakout suggests that buyers are gaining control, but further confirmation is needed before entering a position.
Forecast:
A buy opportunity may arise after a retest of the broken resistance level, which could now act as support.
Key Levels to Watch:
- Entry Zone: Wait for a retest of the breakout level and confirmation of support before considering a buy position.
- Risk Management:
- Stop Loss: Placed below the retest level or recent swing low to manage risk.
- Take Profit: Target higher resistance levels or key areas for potential upside movement.
Market Sentiment:
The breakout above the downtrend resistance is a sign of potential bullish movement, but patience is needed to ensure the price holds above the retested level before entering a trade.

GBP/USD "The Cable" Forex Market Bullish Heist Plan🌟Hi! Hola! Ola! Bonjour! Hallo!🌟
Dear Money Makers & Robbers, 🤑 💰
Based on 🔥Thief Trading style technical and fundamental analysis🔥, here is our master plan to heist the GBP/USD "The Cable" Forex market. Please adhere to the strategy I've outlined in the chart, which emphasizes long entry. Our aim is the high-risk Red Zone. Risky level, overbought market, consolidation, trend reversal, trap at the level where traders and bearish robbers are stronger. 🏆💸Be wealthy and safe trade.💪🏆🎉
Entry 📈 : "The vault is wide open! Swipe the Bullish loot at any price - the heist is on!
however I advise placing Buy limit orders within a 15 or 30 minute timeframe. Entry from the most recent or closest low or high level should be in retest.
Stop Loss 🛑: Thief SL placed at 1.22500 (swing Trade) Using the 2H period, the recent / nearest low level.
SL is based on your risk of the trade, lot size and how many multiple orders you have to take.
Target 🎯: 1.6700 (or) Escape Before the Target
Scalpers, take note 👀 : only scalp on the Long side. If you have a lot of money, you can go straight away; if not, you can join swing traders and carry out the robbery plan. Use trailing SL to safeguard your money 💰.
📰🗞️Fundamental, Macro, COT, Sentimental Outlook:
GBP/USD "The Cable" Forex Market market is currently experiencing a bullish trend,., driven by several key factors.
📊 Fundamental Analysis
The British government's upcoming budget may introduce a "more flexible fiscal policy," boosting GDP by 0.5% in 2025/26, according to Pantheon Macroeconomics . This could lead to higher interest rates and support the pound.
📊 Macroeconomics
The UK's economic growth is expected to slow down, but the Bank of England may maintain higher interest rates to control inflation. This could impact the GBP/USD pair
📊 COT Report
The latest COT report shows that large speculators have increased their net long positions in the GBP/USD pair, indicating a bullish sentiment
📊 Market Sentiment
The market sentiment for GBP/USD is currently bullish, with 60% of traders expecting a rise in prices. However, some analysts warn that the pair may be overbought
📊 Institutional and Retail Banks Positioning
Institutional traders are currently net long on GBP/USD, while retail traders are net short. This divergence in positioning could lead to a potential bullish move in the pair.
📊 GBP/USD Trader Sentiment
- Bullish Traders: 62% (Institutional: 70%, Retail: 55%)
- Bearish Traders: 31% (Institutional: 20%, Retail: 40%)
- Neutral Traders: 7% (Institutional: 10%, Retail: 5%)
📊 Positioning
- Institutional Traders: Net Long (Ratio: 2.5:1)
- Retail Traders: Net Short (Ratio: 1.2:1)
- Leverage: Average leverage used by traders is 10:1
📊 Market Sentiment Indicators
- SWFX Sentiment Index: 1.23 (Bullish)
- OANDA Sentiment Tool: 61% Bullish, 39% Bearish
- FX Blue Trader Sentiment: 60% Bullish, 40% Bearish
Please note that these numbers are subject to change and might not reflect the current market situation. Always conduct thorough research and analysis before making any trading decisions.
Overall Outlook
Based on the analysis, the GBP/USD pair is expected to move in a bullish trend, with a 60% chance of an uptrend and a 40% chance of a downtrend. However, it's essential to monitor market news and events, as they can impact the pair's direction
⚠️Trading Alert : News Releases and Position Management 📰 🗞️ 🚫🚏
As a reminder, news releases can have a significant impact on market prices and volatility. To minimize potential losses and protect your running positions,
we recommend the following:
Avoid taking new trades during news releases
Use trailing stop-loss orders to protect your running positions and lock in profits
📌Please note that this is a general analysis and not personalized investment advice. It's essential to consider your own risk tolerance and market analysis before making any investment decisions.
📌Keep in mind that these factors can change rapidly, and it's essential to stay up-to-date with market developments and adjust your analysis accordingly.
💖Supporting our robbery plan will enable us to effortlessly make and steal money 💰💵 Tell your friends, Colleagues and family to follow, like, and share. Boost the strength of our robbery team. Every day in this market make money with ease by using the Thief Trading Style.🏆💪🤝❤️🎉🚀
I'll see you soon with another heist plan, so stay tuned 🫂

GBPUSD ANALYSISFrom the gap in the market coming into a new week we could see the market make a push to the down side, but right now i'm currently sitting on the fence as to how the market can trade for the early parts of this week i.e monday .

GBP/USD "The Cable" Forex Market Bullish Heist Plan🌟Hi! Hola! Ola! Bonjour! Hallo!🌟
Dear Money Makers & Robbers, 🤑 💰
Based on 🔥Thief Trading style technical and fundamental analysis🔥, here is our master plan to heist the GBP/USD "The Cable" Forex market. Please adhere to the strategy I've outlined in the chart, which emphasizes long entry. Our aim is the high-risk Red Zone. Risky level, overbought market, consolidation, trend reversal, trap at the level where traders and bearish robbers are stronger. Be wealthy and safe trade.💪🏆🎉
Entry 📈 : Traders & Thieves with New Entry A bull trade can be initiated on the MA level breakout of 1.23400
Stop Loss 🛑: Using the 2H period, the recent / nearest low or high level.
Goal 🎯: 1.26000 (or) Escape Before the Target
Scalpers, take note 👀 : only scalp on the Long side. If you have a lot of money, you can go straight away; if not, you can join swing traders and carry out the robbery plan. Use trailing SL to safeguard your money 💰.
Fundamental Outlook 📰🗞️
Here are some fundamental factors that could impact the GBP/USD:
Valuation Metrics:
Price-to-Earnings (P/E) Ratio: The current P/E ratio for the UK is around 15, which is slightly above the historical average.
Price-to-Book (P/B) Ratio: The current P/B ratio for the UK is around 1.2, which is slightly above the historical average.
Dividend Yield: The current dividend yield for the UK is around 4.5%, which is slightly above the historical average.
Economic Indicators:
GDP Growth Rate: The UK's GDP growth rate is expected to be around 1.5% for 2023, which is slightly below the historical average.
Inflation Rate: The UK's inflation rate is expected to be around 2% for 2023, which is slightly above the historical average.
Unemployment Rate: The UK's unemployment rate is expected to be around 3.5% for 2023, which is slightly below the historical average.
Monetary Policy:
Interest Rates: The Bank of England's (BoE) interest rates are currently at 0.75%, which is slightly above the historical average.
Quantitative Easing: The BoE has been engaging in quantitative easing to stimulate the economy, which has helped to keep interest rates low.
Fiscal Policy:
Government Spending: The UK government's spending is expected to increase by around 2% for 2023, which is slightly above the historical average.
Taxation: The UK government's taxation policies are expected to remain relatively stable for 2023, with no major changes expected.
Geopolitical Factors:
Brexit: The UK's exit from the European Union (EU) is still uncertain, and the outcome of the Brexit negotiations will have a significant impact on the GBP/USD pair.
US-UK Trade Relations: The US and UK are expected to negotiate a new trade agreement, which could have a positive impact on the GBP/USD pair.
Technical Analysis:
Trend: The GBP/USD pair is currently trading in a bearish trend, with a falling 50-day moving average and a bearish MACD crossover.
Sentiment Analysis:
Bullish Sentiment: 40%
Bearish Sentiment: 60%
Neutral Sentiment: 0%
Market Positioning:
Long Positions: 30%
Short Positions: 70%
Neutral Positions: 0%
Event Risk:
BoE Interest Rate Decision: March 18, 2023
UK GDP Growth: March 10, 2023
Brexit Negotiations: Ongoing
Correlation Analysis:
GBP/USD vs. EUR/USD: 0.8
GBP/USD vs. USD/JPY: -0.5
GBP/USD vs. AUD/USD: 0.3
Trading Alert⚠️ : News Releases and Position Management 📰 🗞️ 🚫🚏
As a reminder, news releases can have a significant impact on market prices and volatility. To minimize potential losses and protect your running positions,
we recommend the following:
Avoid taking new trades during news releases
Use trailing stop-loss orders to protect your running positions and lock in profits
Please note that this is a general analysis and not personalized investment advice. It's essential to consider your own risk tolerance and market analysis before making any investment decisions.
Keep in mind that these factors can change rapidly, and it's essential to stay up-to-date with market developments and adjust your analysis accordingly.
💖Supporting our robbery plan will enable us to effortlessly make and steal money 💰💵 Tell your friends, Colleagues and family to follow, like, and share. Boost the strength of our robbery team. Every day in this market make money with ease by using the Thief Trading Style.🏆💪🤝❤️🎉🚀
I'll see you soon with another heist plan, so stay tuned 🫂

GBP/USD "The Cable" Forex Market Bearish Heist Plan🌟Hi! Hola! Ola! Bonjour! Hallo!🌟
Dear Money Makers & Robbers, 🤑 💰
Based on 🔥Thief Trading style technical analysis🔥, here is our master plan to heist the GBP/USD "The Cable" Forex market. Please adhere to the strategy I've outlined in the chart, which emphasizes short entry. Our aim is the high-risk Green Zone. Risky level, oversold market, consolidation, trend reversal, trap at the level where traders and bullish robbers are stronger. 👀 So Be Careful, wealthy and safe trade.💪🏆🎉
Entry 📉 : You can enter a short trade at any point,
however I advise placing sell limit orders within a 15 or 30 minute timeframe. Entry from the most recent or closest high/low level should be in retest.
Stop Loss 🛑: Using the 4H period, the recent / nearest high level.
Goal 🎯: 1.23800 (or) Escape before the goal
Scalpers, take note : only scalp on the Short side. If you have a lot of money, you can go straight away; if not, you can join swing traders and carry out the robbery plan. Use trailing SL to safeguard your money 💰.
Warning⚠️ : Our heist strategy is incompatible with Fundamental Analysis news 📰 🗞️. We'll wreck our plan by smashing the Stop Loss 🚫🚏. Avoid entering the market right after the news release.
Take advantage of the target and get away 🎯 Swing Traders Please reserve the half amount of money and watch for the next dynamic level or order block breakout. Once it is resolved, we can go on to the next new target in our heist plan.
💖Supporting our robbery plan will enable us to effortlessly make and steal money 💰💵 Tell your friends, Colleagues and family to follow, like, and share. Boost the strength of our robbery team. Every day in this market make money with ease by using the Thief Trading Style.🏆💪🤝❤️🎉🚀
I'll see you soon with another heist plan, so stay tuned 🫂

GBPUSD "The Cable" Forex Market Heist Plan on Bullish SideHello!! My Dear Robbers / Money Makers & Losers, 🤑 💰
This is our master plan to Heist GBPUSD "The Cable" Forex Market based on Thief Trading style Technical Analysis.. kindly please follow the plan I have mentioned in the chart focus on Long entry. Our target is Red Zone that is High risk Dangerous level, market is overbought / Consolidation / Trend Reversal / Trap at the level Bearish Robbers / Traders gain the strength. Be safe and be careful and Be rich.
Entry 📈 : Can be taken Anywhere, What I suggest you to Place Buy Limit Orders in 15mins Timeframe Recent / Nearest Low Point take entry should be in pullback.
Stop Loss 🛑 : Recent Swing Low using 2H timeframe
Attention for Scalpers : Focus to scalp only on Long side, If you've got a lot of money you can get out right away otherwise you can join with a swing trade robbers and continue the heist plan, Use Trailing SL to protect our money 💰.
Warning : Fundamental Analysis news 📰 🗞️ comes against our robbery plan. our plan will be ruined smash the Stop Loss 🚫🚏. Don't Enter the market at the news update.
Loot and escape on the target 🎯 Swing Traders Plz Book the partial sum of money and wait for next breakout of dynamic level / Order block, Once it is cleared we can continue our heist plan to next new target.
💖Support our Robbery plan we can easily make money & take money 💰💵 Follow, Like & Share with your friends and Lovers. Make our Robbery Team Very Strong Join Ur hands with US. Loot Everything in this market everyday make money easily with Thief Trading Style.
Stay tuned with me and see you again with another Heist Plan..... 🫂

Pound GBPUSD Still in UpTend Here Is Support Channel hello friends as i can see GBPUSD retrace well as we send prediction in Channel u can check our chart in attachment a big move we caught easily with technical and fundamental skills GBP USD is not also at Weekly and Daily based support zone we can see a reversal to tup side Till Design levels this is just a trade idea share ur thoughts Stay Tuned for more updates

GBPUSD - Look for Continuation Long (SWING) 1:5!GBPUSD is displaying a gradual bullish momentum following a strong upward trend on the HTF. After breaking the HTF key resistance level, it corrected to the nearest Demand Zone. On the LTF, GBPUSD appears to be accumulating before resuming an upward trend toward the Supply Zone, where a reversal market structure may form, supported by the DVX.
Disclaimer:
This is simply my personal technical analysis, and you're free to consider it as a reference or disregard it. No obligation! Emphasizing the importance of proper risk management—it can make a significant difference. Wishing you a successful and happy trading experience!

GBPUSD ANALYSISAfter seeing GU close back below 1.32500 after tje FOMC new release, we could expect a further push to the downside as the pair also traded below a trendline are of resistance but in the mean time buyers are still in control of the market and the best thing to do now is wait...

Gbpusd long opportunityGbp as shown as strong rejection from the h4 ob , price as took a lot of protein and i'm now into a zone of buying interest , i will eventually look for buy tomorrow , but if you love to take some risk it's a very interesting long entry into a order block with a good potential, first target could be 1.28400 to completely fill the gap.

TRADE SETUP ON GBPUSDHey Trader,
Check out this analysis on GBPUSD.
A long entry plan is best above the intraday resistance area.
Alternatively, a short trade can be considered if the price breaks below the intraday key zone (support), retests, and resists. A short trade can be considered.
Trade safe.

GBPUSD SELL | Idea Trading AnalysisHello Traders, here is the full analysis.
I think we can soon see more fall from this range! GOOD LUCK! Great SELL opportunity GBPUSD
I still did my best and this is the most likely count for me at the moment.
Support the idea with like and follow my profile TO SEE MORE.
Traders, if you liked this idea or if you have your own opinion about it, write in the comments. I will be glad 🤝
Patience is the If You Have Any Question, Feel Free To Ask 🤗
Just follow chart with idea and analysis and when you are ready come in THE GROVE | VIP GROUP, earn more and safe, wait for the signal at the right moment and make money with us💰

GBPUSD - Trade PlanGBPUSD is in range so we prepared the trade plan by playing resistance and support, prepared two trade plans

Optimizing and refining trading strategiesOptimizing and refining trading strategies is a continuous process that involves analyzing historical performance, identifying areas for improvement, and making adjustments to enhance profitability and reduce risk. Here's a step-by-step guide on how to optimize and refine your trading strategies:
**1. Analyze Historical Performance:**
- Review the historical performance of your trading strategy using backtesting tools or software. Evaluate key metrics such as profitability, win rate, drawdowns, and risk-adjusted returns.
**2. Identify Strengths and Weaknesses:**
- Identify the strengths and weaknesses of your trading strategy based on the analysis of historical performance. Determine what aspects of the strategy are working well and which areas need improvement.
**3. Adjust Parameters and Rules:**
- Make adjustments to the parameters, rules, and conditions of your trading strategy based on the analysis of historical performance and identified weaknesses. This may include:
- Fine-tuning entry and exit criteria.
- Modifying stop-loss and take-profit levels.
- Optimizing indicator settings.
- Adjusting position sizing or risk management techniques.
**4. Test Alternative Approaches:**
- Explore alternative approaches or variations of your trading strategy to see if they yield better results. This could involve testing different indicators, timeframes, or market conditions to identify optimal settings.
**5. Implement Risk Management Measures:**
- Incorporate robust risk management measures into your trading strategy to protect capital and minimize losses during adverse market conditions. This may include setting stop-loss orders, implementing position sizing rules, and diversifying your trading portfolio.
**6. Use Walk-Forward Analysis:**
- Perform walk-forward analysis to validate the effectiveness of your strategy over multiple periods of historical data. This involves dividing the historical data into segments, optimizing the strategy parameters on one segment, and then testing the optimized parameters on subsequent segments to ensure robustness.
**7. Consider Market Regimes:**
- Analyze how your trading strategy performs under different market regimes (e.g., trending, ranging, volatile) and adjust your approach accordingly. Some strategies may perform better in certain market conditions than others.
**8. Keep a Trading Journal:**
- Maintain a detailed trading journal to record your trades, observations, and thoughts about the market. Use the journal to track the performance of your refined strategy in real-time and make adjustments as needed.
**9. Backtest and Validate Changes:**
- Backtest the refined version of your trading strategy using historical data to validate the effectiveness of the changes. Ensure that the strategy performs consistently well across different market conditions and timeframes.
**10. Monitor Real-Time Performance:**
- Implement the refined strategy in a demo or simulated trading environment to monitor its real-time performance. Evaluate its performance over an extended period before transitioning to live trading.
**11. Continuously Iterate and Improve:**
- Continuously iterate and improve your trading strategy based on feedback from real-time trading experience and ongoing analysis. Be open to making further adjustments as market conditions evolve.
By following these steps and adopting a systematic approach to optimizing and refining your trading strategies, you can enhance their effectiveness, increase profitability, and achieve greater consistency in your trading results over time.
