GOLD - GC | Weekly Recap & Plan 13.07.2025🟡 GOLD (GC) Weekly Recap & Outlook
Symbol: GC1!
Date: Week of July 8–12, 2025
Timeframes Used: 4H, Daily, Weekly, HTF structure
🔍 What Happened Last Week?
Gold saw a strong rejection from a confluence of two HTF trendlines, signaling resistance.
But that move was absorbed by:
🟦 Daily Demand (blue zone)
🔵 Daily Swing Liquidity (blue line)
This builds a bullish structure on the daily chart.
🧭 Scenarios I'm Watching
Scenario 1 — Minor Pullback:
🔹 Price may revisit the Daily Gap (pink line) and find support for continuation.
Scenario 2 — Deeper Pullback:
🟣 Price could retrace into the HTF bullish trendline (purple) before resuming upside.
🗞️ Bonus Macro Scenario: Powell Resignation?
There are growing rumors that Fed Chair Powell might resign this week.
📈 If that happens, I expect strong bullish momentum in Gold —
→ very limited retracement, and
→ potential straight breakout into new highs.
🎯 Targets for the Week:
✅ 1st Target:
W C DOL (purple line) → acts as a primary take profit area.
✅ 2nd Target (Expansion):
EQHs / DOL (extended purple levels)
Game Plan:
Watch for LTF confirmation on both retracement zones.
Maintain bullish bias unless Daily Demand fails.
If Powell resigns, be ready for breakout setups.
Gc!1

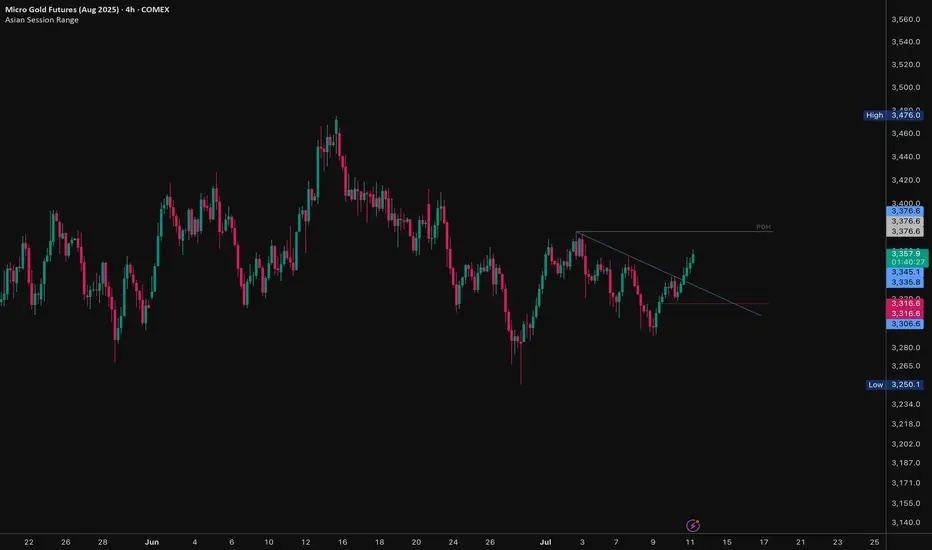
Gold - Watching for Trendline Retest Gold has shown a significant breakout from a recent downtrend resistance line on the 4-hour chart. The price action suggests a shift in momentum, but a potential retest of the broken trendline offers a high-probability entry point.
Technical Analysis:
Trendline Breakout Confirmed: The provided chart clearly shows XAUUSD breaking above a descending trendline that has defined the recent short-term consolidation/downtrend. This breakout indicates a potential resumption of bullish momentum or the end of the consolidation phase.
Immediate Resistance: The price has encountered resistance near the area of the previous daily high (PDH) or a local swing high around 3,376.6. This level will be the immediate target for buyers if the breakout holds.
Potential Retest Zone: A common occurrence after a trendline breakout is a "retest" of the broken resistance level, which now acts as support. The trendline itself and the immediate support levels identified on the chart (e.g., 3,335.8 to 3,316.6) form a potential retest zone.
Trade Idea & Strategy:
The primary trade idea is to wait for a technical confirmation of the breakout by observing a retest of the broken trendline.
Entry Strategy (Bullish Confirmation):
Wait for the price to pull back towards the broken trendline (approximately 3,330 to 3,345 area, depending on the exact slope).
Look for bullish reversal signals (e.g., candlestick patterns like hammers, engulfing patterns, or significant buying volume) at the trendline support.
Enter a long position upon confirmation of support at the retest zone.
Potential Target 1: The recent swing high/PDH area around 3,376.6.
Potential Target 2: If Target 1 is cleared, the high of 3,476.0 (or previous major resistance levels).
Stop Loss: Place a stop loss below the low of the retest candle or below the significant support area (e.g., below 3,300), invalidating the bullish setup.
Alternative Scenario (Bearish Rejection):
If the price fails to hold the trendline support during the retest and decisively breaks back below it, the breakout may be considered a false breakout. In this scenario, the market could revert to the previous downtrend structure.
Disclaimer: This is an analysis for educational purposes and is not financial advice. Always perform your own research and risk analysis before trading.
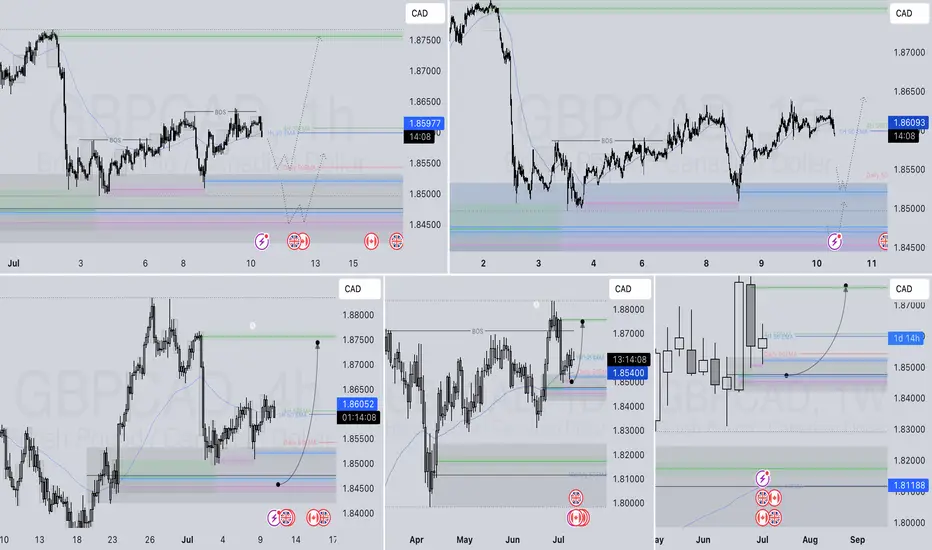
GBPCAD LONG FORECAST Q3 D10 W28 Y25GBPCAD LONG FORECAST Q3 D10 W28 Y25
Professional Risk Managers👋
Welcome back to another FRGNT chart update📈
Diving into some Forex setups using predominantly higher time frame order blocks alongside confirmation breaks of structure.
Let’s see what price action is telling us today! 👀
💡Here are some trade confluences📝
✅Daily Order block identified
✅4H Order Block identified
✅1H Order Block identified
🔑 Remember, to participate in trading comes always with a degree of risk, therefore as professional risk managers it remains vital that we stick to our risk management plan as well as our trading strategies.
📈The rest, we leave to the balance of probabilities.
💡Fail to plan. Plan to fail.
🏆It has always been that simple.
❤️Good luck with your trading journey, I shall see you at the very top.
🎯Trade consistent, FRGNT X
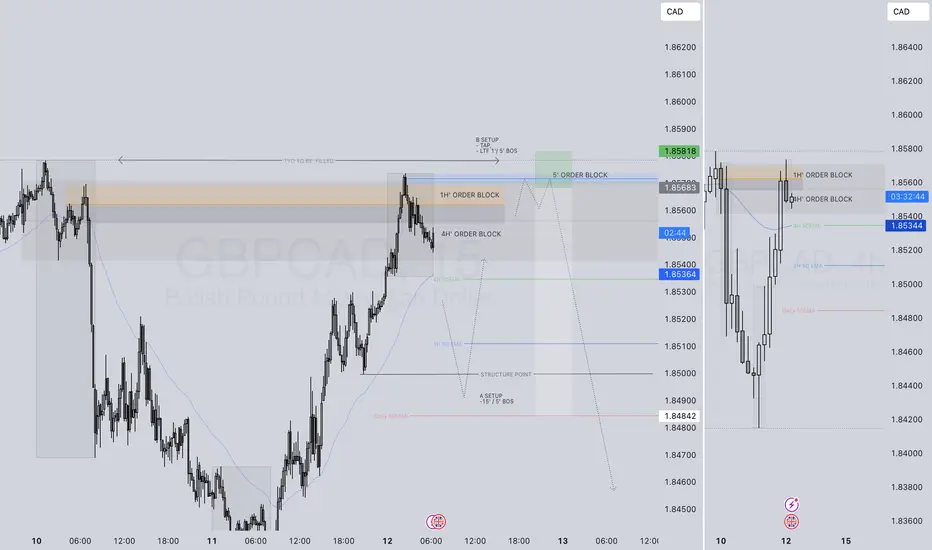
GBPCAD LONG FORECAST Q3 D8 W28 Y25GBPCAD LONG FORECAST Q3 D8 W28 Y25
Professional Risk Managers👋
Welcome back to another FRGNT chart update📈
Diving into some Forex setups using predominantly higher time frame order blocks alongside confirmation breaks of structure.
Let’s see what price action is telling us today! 👀
💡Here are some trade confluences📝
✅Daily Order block identified
✅4H Order Block identified
✅1H Order Block identified
🔑 Remember, to participate in trading comes always with a degree of risk, therefore as professional risk managers it remains vital that we stick to our risk management plan as well as our trading strategies.
📈The rest, we leave to the balance of probabilities.
💡Fail to plan. Plan to fail.
🏆It has always been that simple.
❤️Good luck with your trading journey, I shall see you at the very top.
🎯Trade consistent, FRGNT X

GBPCAD LONG FORECAST Q3 W28 Y25GBPCAD LONG FORECAST Q3 W28 Y25
Professional Risk Managers👋
Welcome back to another FRGNT chart update📈
Diving into some Forex setups using predominantly higher time frame order blocks alongside confirmation breaks of structure.
Let’s see what price action is telling us today! 👀
💡Here are some trade confluences📝
✅Daily Order block identified
✅4H Order Block identified
✅1H Order Block identified
🔑 Remember, to participate in trading comes always with a degree of risk, therefore as professional risk managers it remains vital that we stick to our risk management plan as well as our trading strategies.
📈The rest, we leave to the balance of probabilities.
💡Fail to plan. Plan to fail.
🏆It has always been that simple.
❤️Good luck with your trading journey, I shall see you at the very top.
🎯Trade consistent, FRGNT X

WHAT IS THE EXPECTED RETURN and DURATION of this GOLD Bull Run?Well, when measured against the DXY index, a clear trend becomes apparent.
A Golden Bull typically lasts about 40 quarters, which is essentially 1 decade (give or take a quarter).
Similar to #Bitcoin and its cyclical bull markets within a larger secular bull, the returns tend to decrease over time.
However, it seems that a triple-digit Gold price relative to the DXY is on the horizon at the very least.
What would that look like if the DXY were to hit a new low around 69? This would suggest a Gold price of $6900 at a ratio of 100:1.
A Gold price of $12K with a DXY of 80 only requires a ratio of 150...
Thus, a five-digit Gold price is certainly within the realm of possibility.
I have forecasts that extend as high as $12K.

Futures Watchlist for week ending 6/27/2025Come join as i go through the future tickers that im watching this week and where i see them going. With war talks filling up on social media this will add to our volatility and we will look at key levels to capitalize off of it! Let me know your thoughts on these tickers. Also let me know if there is another symbol futures or stocks that you want me to breakdown for you!

GOLD poised for breakout GLD & /gcAfter going on a huge run to 317 we have spent a significant time now basing out and consolidating we’ve come down into that 300 range and tested and built up quite a bit of support
With the Iranian intentions we could kickstart the next move in gold 317 is the breakout. I am looking to play this breakout on an intra day pull back with some calls one month out for a swing Trey looking at the 320 or 325 strike price

GBPCAD SHORT FORECAST Q2 W24 D12 Y25GBPCAD SHORT FORECAST Q2 W24 D12 Y25
Professional Risk Managers👋
Welcome back to another FRGNT chart update📈
Diving into some Forex setups using predominantly higher time frame order blocks alongside intraday confirmation breaks of structure.
💡Here are some trade confluences📝
✅Weekly highs POI
✅1H order block rejection
✅4H order block rejection
✅15’ order block identification
🔑 Remember, to participate in trading comes always with a degree of risk, therefore as professional risk managers it remains vital that we stick to our risk management plan as well as our trading strategies.
📈The rest, we leave to the balance of probabilities.
💡Fail to plan. Plan to fail.
🏆It has always been that simple.
❤️Good luck with your trading journey, I shall see you at the very top.
🎯Trade consistent, FRGNT X
GOLD SqueezeLooking at the 4-hour timeframe. Price is failing to make LL or HH, with pressure getting tighter and tighter. Personally, I'm not really interested in trading a market like this till price breaks out.

Gold's Correction May Not be Over Yet - Here's WhyHere is my 2-minute technical take on why gold could be looking at a break below 3200 as part of a deeper correction, before it even considers resuming its almighty bullish rally.
Matt Simpson, Market Analyst at City Index and Forex.com

Trade Plan – MGC (Micro Gold Futures) | Sunday, May 4Trend Bias (Multi-Timeframe Analysis):
• 1W: Bullish – Strong macro uptrend with pullback off all-time highs.
• 1D: Bearish – Lower highs and lower lows forming after topping out at $3,509.
• 4H: Bearish – Clean downtrend continuation forming.
• 1H: Bearish – Price rejected lower highs, now curling down again.
• 15M: Bullish – Short-term bounce from $3,210 low, but corrective in nature.
Trade Setup:
• Direction: Short
• Entry Zone: $3,250 – $3,260
• Price has retraced to a lower-high zone under supply; aligns with hourly resistance.
• Stop Loss: $3,270
• Just above 1H structure and 15M failed high.
• Take Profit: $3,210
• Prior swing low and liquidity zone.

GOLD (XAU/USD) - Long Opportunity from FVG Zone🔹 GOLD (XAU/USD) - Long Opportunity from FVG Zone
Price has filled a Fair Value Gap (FVG UP) and tapped into a clear demand area. Strong reaction confirms bullish intent. I'm watching for a possible retest around 3,232–3,227 before a continuation to the upside.
📍 Entry Zone: 3,232 – 3,227
🛑 Stop Loss: Below 3,223
🎯 Target (TP): 3,263
📐 RR: Approx. 1:3
Key Points:
Price broke structure to the upside.
Liquidity sweep below intra-day lows.
Bullish FVG acted as support.
Clean upside inefficiency above.
🔔 If price gives a bullish confirmation on the retest, I’m looking to go long toward 3,263.

GOLD v DXY in breakout move --- HVF hunt volatility funnelAlways good to measure against the DXY not just the USD value
Not perfect of course as it is mainly the Euro and Yen but still insightful.
Been watching the relationship for a while
currently breaking out to the upside
HVF theory means this should be a violent expansion
Target 1 coming up.

GC heading down againGold is respecting the 2-2.5 stdv like clockwork. After reaching 3130 I expect gold to return down to first 3034, and then eventually down to 2959. This will retrace back to fib 0 for the original manipulation legs as showed on chart. There is also an RSI div on 1H

Gold is reversing before reaching the round $3,000 mark.Gold is reversing before reaching the round $3,000 mark.
As you can see on the chart, we’ve hit the 227% Fibonacci level.
— Back in 2008, after testing this level, we went into a correction.
— I think we might see a similar scenario play out from here.
Dollar Index:
SP500/SPY:

Gold Above $3,000 and MoreAccording to the World Gold Council, more than 600 tons of gold — valued at around $60 billion — have been transported into vaults in New York. Why are they doing that?
Since Donald Trump election in November, there is around $60 billion worth of gold that has flowed into a giant stockpile in New York.
The reason why physical gold is flowing into the US is because traders are afraid Trump might put tariffs on gold.
Gold Futures & Options
Ticker: GC
Minimum fluctuation:
0.10 per troy ounce = $10.00
Micro Gold Futures & Options
Ticker: MGC
Minimum fluctuation:
0.10 er troy ounce = $1.00
1Ounce Gold Futures
Ticker: 1OZ
Minimum fluctuation:
0.25 per troy ounce = $0.25
Disclaimer:
• What presented here is not a recommendation, please consult your licensed broker.
• Our mission is to create lateral thinking skills for every investor and trader, knowing when to take a calculated risk with market uncertainty and a bolder risk when opportunity arises.
CME Real-time Market Data help identify trading set-ups in real-time and express my market views. If you have futures in your trading portfolio, you can check out on CME Group data plans available that suit your trading needs www.tradingview.com
Trading the Micro: www.cmegroup.com

Shorting Gold!Gold has been on a TEAR through 2025. Overextended in ATH territory and more expensive than ever before in history. Logically, we should expect a return to historically normal (still expensive) prices.
Daily chart is showing 3/3 sell signals
1. Price below 9 period MA
2. RSI bearish fanning beautifully from overbought levels
3. Average Daily Range expanding with volatility
I'm aggressively watching for shorts on Gold, Silver, and Copper in the weeks ahead. I've outlined 3 possible entries IF we're lucky enough to see some kind of relief from last weeks selloff. Should price proceed to fall, preparing smaller time frame short trades. I strongly believe we will see 2800. Strategy is invalidated if price breaches ATH's

GC - Golden Rocketship To The U-MLHWe got on the Rocket-Ship earlier and took profit.
If you're still in with a position, or if you can manage to get in with a decent Risk/Reward, you may want to aim for the U-MLH.
The Stars look good and profits are twinkling §8-)
If the 1/4 line is cracked, we will see a follow-through.

GOLD AssertationNot 100% confident in this trade Based on whats been happening in the market Missing about two confluence to be More Confident But Will See How This Works Out and Learn From my Mistake Even if i Am Right Originally my confidence in this wasnt there So i will dissect That Reason To better Pin Point High Confluence Trades

The 3rd Major Pivot in Gold’s Uptrend - Since Trade War in 2018We just witnessed the start of another pivot in gold when Trump won the U.S. presidential election in November 2024. My gold trading strategy has always focused on buying dips while keeping any short-selling opportunities short-term.
The chart above clearly illustrates three major V-shaped formations in gold. After each tariff or trade war, a V-shaped pattern formed in the same month the policy was initiated, followed by a subsequent uptrend.
Recently, I published a video analyzing other significant tariffs since the U.S.-China trade war began in 2018. We observed a consistent pattern: after each tariff or trade war, the same month of policy initiation saw the formation of a V-shaped trough, followed by an uptrend.
This time, the V-shaped trough occurred during the U.S. presidential election month. The right side of this V-shape was completed with the announcement of 25% tariffs on Canada and Mexico, signaling the expansion of the trade war beyond China.
The consequence of trade wars is inflation, and gold has historically served as a leading indicator of this trend.
If the trade war persists and intensifies, a continued uptrend in gold seems inevitable. Analyzing the long-term monthly chart using my parallel channel approach, we observed gold prices encountering resistance around $2,600 in September 2024 and beyond. However, by the close of January, the price action provided a clear confirmation of the ongoing gold uptrend. Gold firmly closed above $2,600, reaching $2,835 for COMEX Micro Gold Futures.
On the 3-hour chart, I have provided another set of parallel channels as a guide to track support and resistance levels as gold trends further.
As gold prices continue to climb, their notional value can become quite large for retail traders. COMEX Micro Gold Futures, being 1/10th the size of the regular gold contract, is a better option for me when the next buying opportunity arises. Recently, CME launched a new contract—a pocket-sized one-ounce gold contract. One key to successful trading is selecting the right contract size for oneself, which is crucial for effective risk management.
Once again, my strategy for gold remains the same: focus on buying dips while keeping any short-selling opportunities short-term.
Please see the following disclaimer and information that you may find useful:
Gold Contracts:
Gold Futures & Options
Ticker: GC
Minimum fluctuation:
0.10 per troy ounce = $10.00
Micro Gold Futures & Options
Ticker: MGC
Minimum fluctuation:
0.10 er troy ounce = $1.00
1Ounce Gold Futures
Ticker: 1OZ
Minimum fluctuation:
0.25 per troy ounce = $0.25
Disclaimer:
• What presented here is not a recommendation, please consult your licensed broker.
• My mission is to create lateral thinking skills for every investor and trader, knowing when to take a calculated risk with market uncertainty and a bolder risk when opportunity arises.
CME Real-time Market Data help identify trading set-ups in real-time and express my market views. If you have futures in your trading portfolio, you can check out on CME Group data plans available that suit your trading needs www.tradingview.com

How High Can BITCOIN go versus GOLD (sorry uncle Peter Schiff)One of the frequent topics of discussion revolves around the legitimacy of this pattern. There’s a widespread misunderstanding about the continuation type of the Head and Shoulders (H&S) pattern.
Indeed, it is a valid and dependable chart pattern.
Let’s explore this often-recognized chart pattern in more detail.
The Head and Shoulders chart pattern can manifest as a continuation on price charts. In an uptrend, a continuation H&S will closely resemble a H&S bottom, while in a downtrend, it will look like an inverse H&S. The implications and interpretations of a continuation H&S are generally consistent with those of reversal patterns. Price targets can be established in the same manner as they are for reversal patterns.
When a head and shoulders continuation forms during an uptrend, it typically breaks out to new highs once the pattern is completed. Breakouts to all-time highs from bullish continuation patterns are often reliable and robust.
Edwards and Magee highlighted the H&S continuation in their book, "Technical Analysis of Stock Trends," back in the 1930s. The pattern remains largely unchanged in today’s price charts.

Gold Update: $3,000 Is Not the Final DestinationGold futures broke above minor consolidation, so the map should be updated.
Wave 3 becomes extended (blue small waves) and it is looking to test the trendline resistance near magic $3,000 level.
But that's not all as we didn't see wave 4 yet.
It should be complex to alternate wave 2, which was simple.
Wave 4 could hit the $2,500-2,550 area to complete correction.
We can measure it after wave 3 will be completed.
And finally, wave 5 is usually extended in commodities.
It could be huge, wave 3 already travelled over $1,000,
imagine where wave 5 could rocket then.
It will depend on how deep wave 4 would retrace first.
Stay tuned, share your thoughts below, lucky trades to all of you!
