Short Gold: My highest conviction trade right nowGold has closed the week with a bearish cloud cover candlestick pattern. We also have negative bearish divergence on the RSI and cyclically we can see that from the 2011 high to the 2016 low we are due for another turning point here in 2020. I have already posted a trade to short gold last week but I am reiterating this trade as I think gold can go much much lower from here.
Gc_f

#GC_F #GOLD Just follow the FibAs the market reprice, and the FED pretends to know what they are doing, just follow the Fib to trade the safe haven, #gold.

Reverse Position On GoldThe bear flag did not have much follow through and was stopped out. Shortly after the short position was closed, a long position was initiated for a reversal trade.

Bear Flag Short On GoldAfter a huge run up due to the Middle East bombing from Iran, a dramatic reversal presented a potential bear flag trade on gold for the near term. Here are the possible entry, exit and profit target zones for this bear flag.


$GOLD $GC_F - Back In The Zone ConsolidationAfter putting-in a solid month of June, whereby Gold- GC_F finally went topside of the previously noted all important $1375 - $1400 zone that had acted as significant resistance for the past six (6) years, the yellow-metal now finds itself in pullback mode consolidating (which should be expected and healthy) the recent thrust into higher ground as well as back into 'The Zone' ($1375-$1400) as we can observe from the Monthly chart above.
While debate rages from both the Bull and Bear camps as to whether the recent action constitutes the beginnings of a new bull leg or, merely a 'Fake-out', which will ultimately be sold lower and deliver disappointment yet once again to those whom have been patiently awaiting Gold's awakening from its long slumber, we'll continue to defer to the final and ultimate arbiter, which is Price.
Nonetheless, when observing the action from a technical perspective, Gold continues to display favorable technical characteristics across the Daily; Weekly and Monthly time-frames, which bodes well from our perch.
Additionally, while Gold may require some backing-and-filling and further consolidation in order to 'work-off' as well as digest the recent thrust, we suspect that such development would merely be building cause/energy for its next meaningful advance moving forward from and intermediate and long-term perspective.
Thus, while both investors/traders may be focused on the short-term 'wiggles and jiggles', we think that it's of more importance to focus on the 'Big Picture' of what may be taking place and that is, the beginnings of Phase III of Gold's secular bull that began in the early 2000's with a potential measured move that finds Gold trading into the $1700-$1750 range down the road as and initial objective.


6 years long basing pattern"the bigger the base the higher in space"
Waiting patiently for the price to breakout...

GOLD - Possible double-bottom, hence long buy oppAfter yesterdays FOMC, we have seen a flush in GOLD. However, from broader perspective GOLD is still flagging - if that scenario is confirmed target of 1300 very much possible, with a prospective follow through to 1300+.

Gold/GC Outlook for MTPrice has pulled back to retest:
-the breakdown level post breakdown
-composite HVN
Looking for price to test the levels from last fall.
If price breaks above $1292 and holds, will consider trade thesis void.
Support levels:
-$1250
-$1236
-$1226
-$1222
Resistance levels:
-$1291
Short-term play included


New Gold Sell Signal Could Trigger Any Day!New Gold Sell Signal Could Trigger Any Day with a break of support trendline and trigger bear flag.

Gold Price Clearly Defined and Price TargetsThis last chart, a Monthly price chart, illustrating the Pennant/Flag formation in Gold should be the clearest example we can provide that Gold will soon break out to the upside and rally extensively higher if our research and analysis are correct. The momentum that has built up over the past 2+ years, as well as the global demand for Gold by central banks and by investors as a hedging instrument, could prompt Gold and Silver to rally at least 50~60% in this first upside breakout wave – resulting in $1900 gold prices. Silver could rally to well above $18~19 in a similar move and the number our researchers believe may become the upside target in Silver is $21.

Just admit that gold is at resistance and bearish!Just admit that gold is at resistance and bearish!
The chart speaks for its self.
The Russell 2000 ETF continues to deliver critical technical and longer-term price patterns for skilled technicians. Combining the IWM chart with the Transportation Index, Oil, Gold, and others provide a very clear picture of what to expect in the immediate future.
Recently, we posted a research article about the Head-n-Shoulders pattern setting up in the $INDU. Again, the IWM chart is also showing a very clear Head-n-Shoulders pattern with critical resistance near $159.50 and support near $144.25. Our researchers, at Technical Traders Ltd., believe this right Shoulder will prompt a downside market move towards support near $144.25 before a downward sloping wedge pattern sets up. This first downward price leg will setup and congesting wedge formation that will, eventually, break to the upside and drive market prices higher.
I also posted a Russell 2K ( IWM ) forecast here www.thetechnicaltraders.com


GOLD TO 1180 / 800 on 5% RatesSilver down, Euro down, Yuan up, US stocks up, Dax up, 10yr US bond up. crossing the 20 day m.a with the 26 m.a
will validate a further drop of the price. also breaking 1200 will confirm that movement for intraday

USDOLLAR KEY Reversal Day on BLOOD RED MOON MERCURY RETROGRADEDONT Forget MARS ALIGNMENT FAVORS WAR.
The US 2Q GDP came in at 4.1% with a revision to the 1Q (they are still revising that number). The GDP is the quarter change... annualized. Taking the 2 quarters (2.2% and 4.1%) and dividing by 2 gets 3.15%. The 4 quarter average is 2.85%. (2.8%, 2.3%, 2.2% and 4.1%)
The initial knee jerk reaction in the dollar is a little lower.
The USDJPY fell to a low of 110.95. That is still above the low for the day at 110.92.
The price is below the 100 hour MA at 111.113. The price today has been waffling above and below that MA line today. We trade at 111.08 currently. Move above the MA and perhaps the sellers turn around and buy. Stay below keeps the sellers more in charge.
The EURUSD moved up and back down. The high reached 1.1639. That was just below the 61.8% of the move up from last weeks trading range. Yesterday, the price moved below the 100 and 200 hour MA and has remained below those MAs since (blue and green lines).
The initial reaction was dollar lower (expecting 4.8% perhaps), but "the market" overall is stymied trying to figure what to do next.

Gold Mercury Retrograde and Friday Blood RED MoonThe uncertainty surrounding the ongoing trade war between the US and China has been driving the price of gold lower, instead of higher, as would normally be the case in times of heightened geopolitical risk. This is due to the close correlation between gold and the Chinese yuan which has remained firm in recent months. The Chinese government has allowed the Chinese currency to weaken in order to offset the drag on Chinese growth caused by US tariffs on billions of dollars worth of goods. Furthermore, mounting signs of a renewed round of monetary easing has also been weighing on the currency. Especially following Monday’s announcement of tax cuts and infrastructure projects and after the PBoC on Wednesday said that a capital requirement for some banks would be eased in order to support lending.
From their recent respective peaks back in April, the yuan is down by 8% while gold has lost 9.3%. Most of the relatively worse performance seen in gold has occurred during the past week as the market prepares for what is expected to be a very strong US Q2 growth number on Friday.
Gold has once again managed to find support ahead of $1,200/oz, an area which has provided support in the past and which represents a 50% retracement of the $329/oz rally seen between December 2015 and July 2016. For this level to hold, however, it is clear that the dollar appreciation needs to pause or reverse, especially against the yuan as highlighted above.
In the week to July 17, gold’s continued slump to a one-year low helped trigger another spate of heavy short-selling by funds. The net-short reached 22,000 lots, just shy of the 24,000 lots record seen in December 2015. Back then this bearish view was reached just before the first US rate hike signalled a low point from where gold rallied strongly. The current gross-short of 132,000 lots has never been seen bigger and it has left gold in a much better position to react to price-friendly news.

Gorgeous setup for a strong rally in Gold!Gold has a great setup with a tight stop for a strong rally
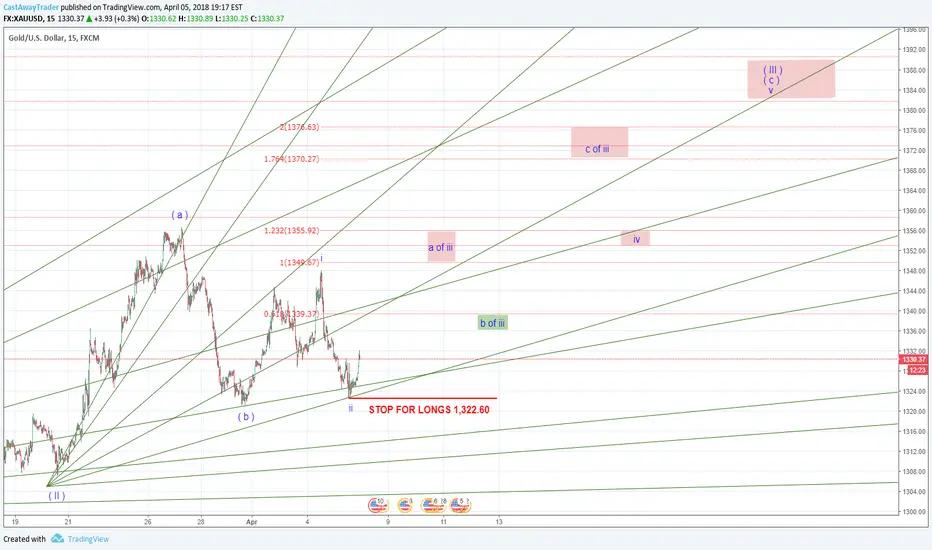
#GC_F #gc new targets 4/3 continuation of previous analysis, after hitting LONG TARGET 3 price retrace tp 1339 and broke support.

#GC #GC_F new analysis and targets 3/29New targets base on price. To the long side little retrace ( 1320?) and bounce back

GLD Higher?Bullish Wedge + ABC Correction + 50% Retracement = Move Higher....Looking at this scenario as my first choice. If so, should play out this week.

Reclaiming very important resistanceSilver is reclaiming very important resistance and once again bouncing from a LT rising trendline. It could very soon be the time for a major rally, but a good entry opportunity offering now. Tho waiting for a confirmation with price break above ~17.70.
