This bullish pattern may be deceivingIf stocks weaken, as I think they will, this bullish pattern will break hard to the down side.
Disclaimer: The above is not an investment advice. It is merely an opinion and I share it for your entertainment only. Do your own due diligence and above all, trade safely and stay safe!
GDX


GOLD Barrick: Divergence-> left turn? -Divergence of RSI MACD STOCH against the general downward trend, similar to late 2018,
-lows holding, highs descending between 32%and50% RT
-similar to 2018, same as gdx
-ONE dirty dirty DIRTY heart crushing gap from the Spring rebound (not on chart)
I'm like NASCAR, left turns only please.

GDXJ Road to $95-100I just can't see any other outcome on this one. Every single thing on this thing looks bullish AF.

GOLD MINERS GDX bearish tonesPlease see Chart... recent minor failures hint of bearish tones, and technicals are crossing down.
Overall, the equity markets are pushing higher on air and expecting a serious pullback soon, after a surprise trigger.
Gold prices are not moving despite USD weakening... this is bad for Gold, and Gold Miners particularly.
Once the USD jumps, and Gold drops, then the Gold Miners will be in double jeopardy.
I like GDX, but it is reeking of danger right now. I would be very wary IMHO...

XAUUSD: Gold bottomed, buy it...I'll just leave this here, I leave the specifics to you, but I believe the selloff in Gold is over and it is about to resume the yearly timeframe uptrend.
My clients and me are long already, and looking to capitalize on this run since it is likely to outperform stocks together with most commodities going forward.
Cheers,
Ivan Labrie.

GD Headed back up in the near future - go longLooks like a cup & handle are forming on the 1hr timeframe. Handle could lead to a jump up to 1950 in the near future. Dont miss out!

Gold consolidating for a (potential) move to $2500 in early 2021With gold being in consolidation mode for a few months, this is a potential path out of the bull flag and trend it's trading in. I've drawn ideal support backtests with little flushes below to shake out weak hands.
The measured move out of this trend will replicate the move up from our March generation lows, placing the target somewhere in the $2500 range. Inflation will show up in commodities/PMs as we have the regime change in the US and more stimulus packages to aid the economic recovery.


BTD on $GOLD $GLD $GDX $JNUG $GDXUWe got some good news on the Stim bill today but it hasn't passed FR FR yet.
The House and Senate will vote today on a roughly $900 billion pandemic relief package, with the White House saying President Donald Trump would sign it. The deal includes help for small businesses, the jobless and direct payments to most Americans. The bill that lawmakers will vote on will be attached to a $1.4 trillion measure to fund government operations through the end of the fiscal year. As part of the compromise needed to reach agreement, Democrats allowed a provision to be inserted that would prohibit the Federal Reserve from restarting a program supporting corporate bonds and small businesses due to expire Dec. 31. (no more ink/paper for Powell? )
GOLD- i talked about this a while back, I'm overall bullish on Gold/Gold miner because stimulus passed = more inflation = good for GOLD fundamentally.(yea i know, who cares)
$22.20 has been a nice buying opportunity for this company but you could use that area as stoploss as well.
Entry $22.20 area
Target $25.20
Target 2 $28.20
Stoploss 21.20

THE WEEK AHEAD: SLV, GDX, XLE, IWM/RUTWith two shortened market weeks in a row for Christmas and New Year's, I probably won't be doing a ton here, but figured I'd do a post for how exchange-traded funds are looking in the waning weeks of 2020 ... .
EXCHANGE-TRADED FUNDS ORDERED BY PERCENTAGE THE AT-THE-MONEY SHORT STRADDLE NEAREST 45 DAYS IS PAYING AS A FUNCTION OF STOCK PRICE:
SLV (32/46/11.9%)
GDX (18/43/11.0%)
XLE (25/42/10.7%)
EWZ (14/40/10.0%)
XBI (21/36/9.1%)
KRE (18/36/9.3%)
I'm currently in small XLE, EWZ, KRE, and GLD positions, but will consider adding on weakness if any comes my way and the implied volatility sticks in there. One thing I don't want to do is to constantly follow high implied volatility, only to find myself grossly overweighted in energy, Brazil, and regional banks, however, so don't want to go too crazy adding in sectors that have been high in the list week in and week out over the past several months.
BROAD MARKET:
IWM (22/29/6.9%)
QQQ (19/26/6.5%)
SPY (13/22/4.9%)
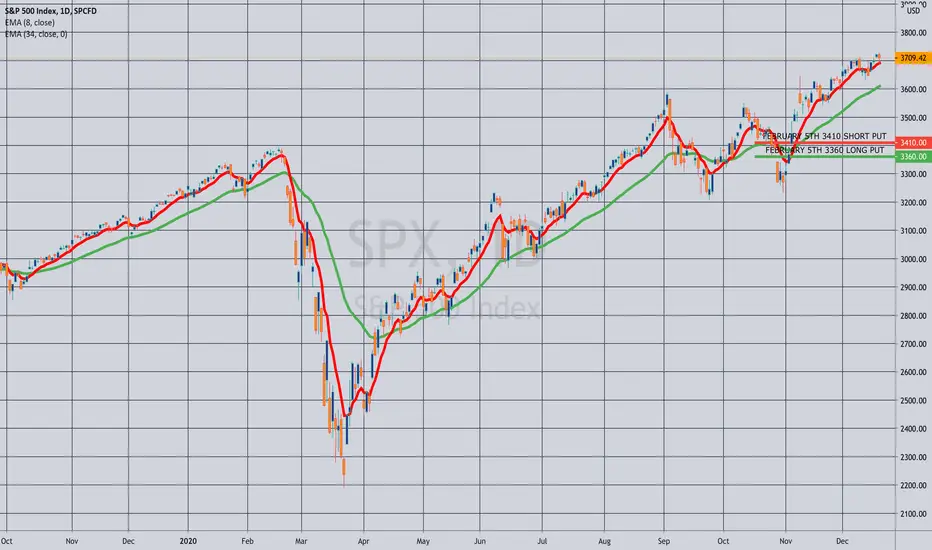
Pictured here is an SPX 50 wide set up to pay at least 10% of the width of the spread, or around 5.00/contract in the expiry nearest 45 days, which would be the February 5th weekly (currently 47 days until expiry). I would ordinarily opt for a higher implied volatility RUT setup, but there currently isn't a February 5th expiry available. You can certainly go with the January 29th (40 days) or the February 19th (59 days), with the preference being to put these on in a down day or days. Smaller account should consider going with SPY or QQQ spreads* with the appropriate combination of of contracts and spread widths commensurate with your account size.
BOND FUNDS:
TLT (1/15/3.5%) (1.609% Yield)
EMB (11/8/2.6%) (4.024% Yield)
HYG (7/10/2.1%) (4.917% Yield)
AGG (29/9/1.9%) (2.252% Yield)
In the IRA, I've been selling HYG short put here of 30 days' duration or so for a credit that is around the monthly dividend. With the December 18th short put having expired worthless, I'll look at adding some in the January 22nd cycle, where the 85 is paying .41 at the mid. As I've pointed out before, the premium in bond funds generally stinks, but I've been using this strategy as a way to deploy buying power that would otherwise be sitting there earning virtually nothing while I await down days or a higher volatility environment.
* -- Unfortunately, NDX isn't as liquid as either SPX or RUT, so I virtually never trade NDX spreads, opting instead for equivalent sizing in the QQQ's (e.g., 5 10-wides).

Get ready for the $SILVER move! $SLVThe Q4 FOMC combined with mid December tax loss selling is a prime time to sneak your way back into the precious metals sector. It has been a great year for metals, and believe it or not the 4 month correction from August to December is perfectly normal and reasonable given history.

(DXY) What Really Is Driving Gold (Yields)There is much speculation across the investor universe about what influences Gold prices and vice versa. Today I will be focusing on the false theory that Gold prices lead treasury yields and that by extension, Gold signals market crashes.
The Financial Solar System
Taking a look at the chart it is clear that sometimes Gold prices parallel and slightly lead treasury yields. However, if we overlay the Dollar index it is astronomically clear that the only times that Gold does this is when the Dollar's gravitational pull temporarily alters Gold's trajectory. Gold prices at the root are inversely corelated with Treasury yields.
It is really that simple. The Treasury market is the Sun while Gold, the Dollar, and the Stock market are planets. As treasury yields ultimately dominate and inversely lead Gold prices, the Dollar acts as a secondary force.
Yields are the only pre-signal for Market crashes and it looks to me like another leg down is imminent. However, it also looks like the dollar is setting up for a relief rally which means Gold would plummet along side stocks before the Sun sling shots it to new highs.


GOLD - Cup and Handle formation. Very Bullish!GOLD - Cup and Handle formation. Very Bullish!
For shorter term, yellow channel range bound. Breakout likely to the upside.

GDX - ready to break out ?GDX is bullish against the last low. Same for GDXJ.
There's no sure thing - you trade what's in front of you.

GOLD 19 YEARS AGOThe GOLD to SPX ratio currently looks similar to 2001. Where were you 19 years ago? I know where I was and I was clearly not buying enough gold! Hindsight is clear.. or should I say 20/20? Seeing as history tends to rhyme, precious metals look like the better deal over the next decade- especially if you hold them in your possession.


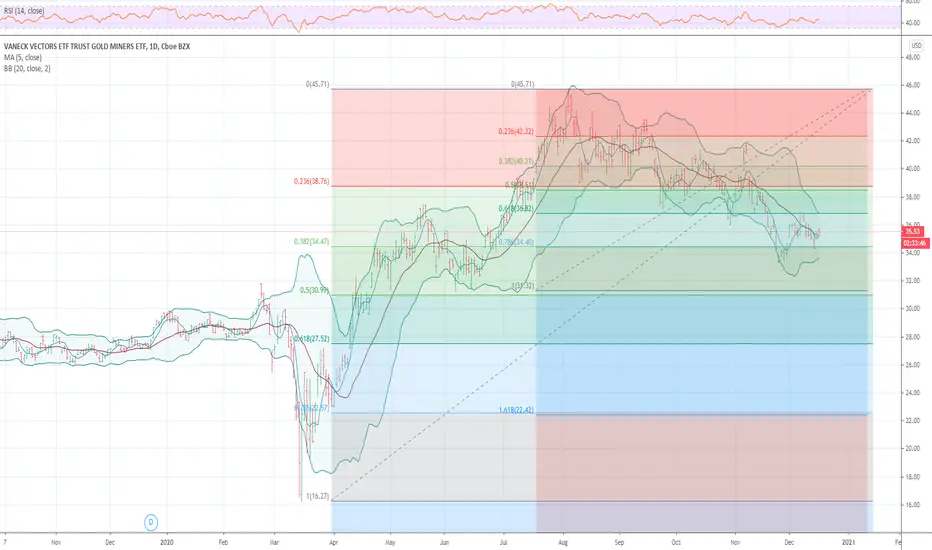
Elliott Wave View: GDX Ended Correction and Ready to Resume HighElliott Wave view in $GDX suggests that the Gold Miner Index ended cycle from March low in wave ((2)) at 33.16. The Index has turned higher again in wave ((3)) with the internal unfolding as an impulse Elliott Wave structure. Gold Miners still need to break above previous wave ((1)) high on August 5 at 45.78 to avoid a double correction. Up from wave ((2)) low at 33.16, wave ((i)) ended at 34.5 and wave ((ii)) pullback ended at 33.35. Gold Miners then extended higher again in wave ((iii)) towards 36.07, and pullback in wave ((iv)) ended at 35.7. Final leg higher in wave ((v)) ended at 36.4 and this completed wave 1 in higher degree.
The Index then corrected cycle from November 24 low and ended wave 2 at 34.87. Internal of wave 2 unfolded as a double three structure where wave ((w)) ended at 35.23, wave ((x)) ended at 35.81, and wave ((y)) ended at 34.87. Up from wave 2 low, wave ((i)) ended at 36.92. Expect wave ((ii)) pullback to stay above wave 2 at 34.87, but more importantly above 33.16. As far as pivot at 33.16 low stays intact, expect dips to find support in 3, 7, or 11 swing for more upside. Potential short term target higher is 100% – 123.6% Fibonacci extension from November 24 low at 38.09 – 38.86.

