GDX

Gold (AUD)- Similarity of post-2008 GFC to Post Covid-19Gold (AUD)- Similarity of post-2008 GFC to Post Covid-19
Post crisis stimulus and slashing of interest rates, provides a tail wind to Gold.

THE WEEK AHEAD: XOP/XLE, GDXJ/GDX, KRE, EWZ, IWM/RUTEARNINGS:
It's a light week for earnings announcements, which means it's an even lighter week for options liquid underlyings, none of which meet my cut-off for 30-day implied >50%.
EXCHANGE-TRADED FUNDS RANKED BY PERCENTAGE THE JANUARY AT THE MONEY SHORT STRADDLE IS PAYING AS A FUNCTION OF STOCK PRICE:
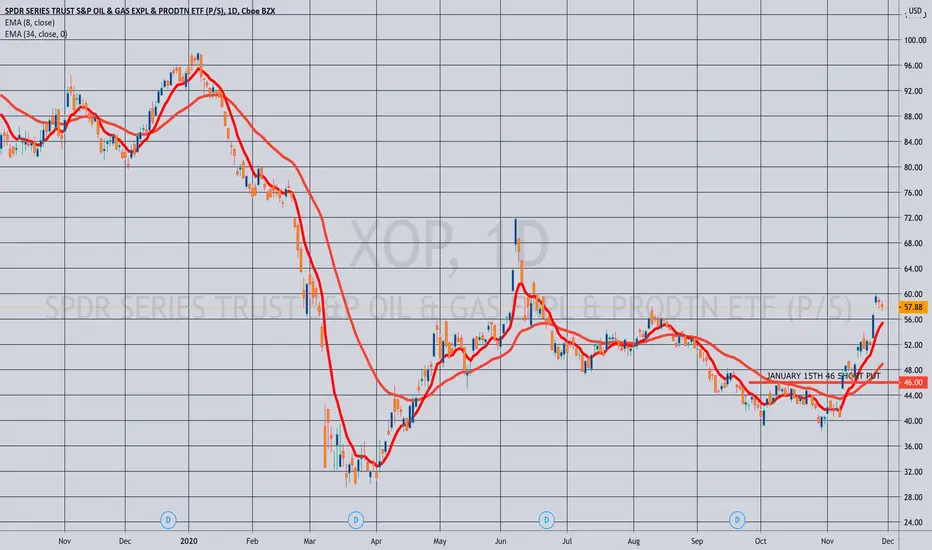
XOP (18/59/15.8%)
GDXJ (16/42/13.2%)
XLE (26/46/11.6%)
KRE (24/40/11.4%)
GDX (17/40/11.4%)
USO (7/46/11.0%)
EWZ (15/39/10.6%)
SLV (25/38/10.3%)
Honorable Mention:
GLD (23.5/18.5/5.0%)
* * *
Pictured here is an XOP January 15th 46 short put, which was paying .92 as of Friday close (2.04% ROC as a function of notional risk at max; 15.5% annualized at max). I still like bullish assumption, pandemic recovery plays in the oil space, although implied volatility has bled out quite a bit here, and the break even (45.08) would be above the 2020 lows.
GLD gets an honorable mention here due to its being nearly 15% off of its early August highs with the January 15th strike nearest the 16 delta (the 157) paying .94 as of Friday's close (.60% as a function of notional risk at max; 4.6% annualized). The ROC %-age isn't great, however, but if you're looking to establish a gold position, now might be the time to consider starting one. I'm already working one here, (See Post Below), and will consider adding once December out-of-the-money's fall off or I manage them.
Alternatively, look to establish a position in SLV, GDXJ, or the more liquid GDX, all of which are more scalable due to size and provide more bang for your buck, with the GDXJ January 15th 42 paying .70 (1.7% ROC as a function of notional risk; 12.9% annualized), the GDX January 15th 30 paying .40 (1.4% ROC at max; 10.3% annualized), and the SLV January 15th 19 paying .30 (1.6% ROC at max as a function of notional risk; 12.9% annualized at max).
For those of a defined risk bent, the GLD January 15th 153/158 short put vertical was paying .54 at the mid as of Friday close (10.8% ROC at max; 82.1% annualized).
BROAD MARKET
IWM (23/29/7.8%)
QQQ (19/25/6.9%)
DIA (16/22/5.8%)
SPY (13/21/5.3%)
EFA (16/18/4.6%)
Volatility has pissed out mightily here, and the <10% the at-the-money short straddles are paying in the January cycle are reflective of that.
The IWM January 15th 157 short put was paying .94 (.6% ROC at max as a function of notional risk; 4.6% annualized) as of Friday close, which isn't exactly great. Here, defined is more compelling from a pure ROC %-age return perspective (it usually is), with the IWM January 15th 158/163 was paying .54 as of Friday's close (10.8% ROC at max; 82.1% annualized) and its cash-settled counterpart RUT, paying 5.10 for the January 15th 1610/1660 with similar ROC %-age metrics with the short option legs camped out at the 16 delta strike. Naturally, you can be more aggressive, bringing in the setup more toward the expected move.
GOLD - WHAT IS THE DEAL WITH NOVEMBER?Gold has entered the pivot zone. The hard metal is always a hold to me personally, but it helps to study the charts to get an idea of the algorithmic driving forces and other oddities. In this case, I couldn't help but see this Nov Nov Nov trend and the math behind the madness. The pattern suggests it'll be supportive. Watch it closely the next few weeks. We need to see strength come in to confirm support and upward continuation. Do not dismiss the possibility of a deeper correction.. There's no such thing as "impossible" when in comes to financial assets.. especially in 2020-after all, we did see oil trade MINUS $37 this year. Keep an open mind while in wonderland.

AX.OZL Oz MineralsHey investors,
Gearing up for the future
Long term outlook for the company is great. technically it has a long way to appreciate from a wave perspective
regards,
Limitlesss

AX.DEG De Grey Mininghey investors
in line with the GDX position. De-grey retracement looks to be completing.
like and share our pages
regards,
limitlesss

AX.NST Northern Star ResourcesHey investors
Setup in the GDX and GLD at the moment is begging for gold miners to revert back into an upward cycle
Technically we have enough waves down to consider the formation complete and divergence is coming through stronger as the days pass
NST is one of those stocks. ASX listed
All the best. Please hit like and support the ASX listed traders on TradingView
Regards,
Limitlesss
Find us on facebook Limitlesss


When a bullish sign gets negated...Disclaimer: The above is not an investment advice. It is merely an opinion and I share it for your entertainment only. Do your own due diligence and above all, trade safely and stay safe!

GDX - gold minersThe good news is that we are approaching some serious levels
The bad news is the way we crushed the 200MA


Will it? Is it finally time?Looks like the Euro is making another attempt at breaking above trend.
Also trying to complete bull flag structure
If it breaks, will it be Armageddon? Will heads explode? Or will it be like Y2K?

GDX 45 call expiry : jan 2022 cost:2.09$ cmp:33.5 SL: below 31 GDX 45 call
expiry : jan 2022
cost:2.09$
cmp:33.5
SL: below 31
24/nov/2020

Confluence abound, expecting a bounce-Daily 200 SMA/EMA
-Bottom of primary trend channel
-Fib 1.618 of lower Distribution (or Reaccumulation) phase
-2012-2013 triple top (previous bull market top if you discount the initial blow off top)
-Fib 1.272 extension of BC to AR Distribution (or Reaccumulation ) phase
-Supply zone at ~1800
-Lowest 4Hr RSI since Aug-2018 (Wyckoff spring and start of current bull market)
-Bottom of Fall season channel
-1800 nice round number
I'm expecting a bounce or a bottom here...

Gold - next 12-months is the last chance to accumulateGold - next 12-months is the last chance to accumulate


GDX pushing further down to target !As previously observed, analyzed and projected... GDX is going down hard.
There is a current rotation ongoing, and GDX needs to retrace strongly, base out and rotate back in again.
Wait for it...

Everything Update 11.20.20Taking a look at the weekly progress of multiple correlated markets and updated price targets: Bitcoin, Gold, Silver, USD, S&P500
Bitcoin
Excluding the March mayhem deviation in price, weeks ago there were hints of a parabolic trend starting to develop.
The breakout of a macro downtrend and weekly candle close above it was the buy signal.
Using macro fibonacci extensions I'm still anticipating a relentless squeeze with occasional dips to the longer term target of about $33,700, and will be watching for volume to start trending up.
US Dollar
Weeks ago it appeared a consolidation pattern was forming and momentum was to the downside.
I am still projecting one more leg down followed by a swift rebound up to the 200 week E M A. Eventually rolling back over to the longer term target below.
Gold
Not much changed with gold this week. Looks like a base is still building at the previous all time high levels.
Using macro fibonacci extensions, the intermediate term target is still $2300ish.
Next buy signal for Gold is a break out of the downtrend with the daily MACD above zero.
Silver
Weeks ago a consolidation pattern was forming.
Now that pattern has been validated and a breakout is imminent. Target $35ish.
Using the macro fibonacci extensions the longer term target looks to be around $58 or even $86.
SandP 500
Lots of speculation of a crash here. My thoughts are that reality lies somewhere in the middle and money will flow into the SandP stocks that have not fully recovered yet. I'm looking to buy short term dips, especially near the grey bars where heavy volume came in previously. If the dollar continues it's descent into the abyss then the SandP, along with all the aforementioned markets, will surely go up, up, and away.
Trading is risky. Don't do it and don't listen to me.
Long
Crypto: BTC, ETH
Gold: MGCG21, PHYS, GDX, other mining stocks
Silver: SLV, CEF
Other Equities: Oil/Gas stocks, TCEHY, BABA, and others

Its starting to look a lot like last yearBounced about 4% above the 200 day moving average. Then the usual merry xmas...

Elliott Wave View: GDX Correction Remains in ProgressElliott Wave view in Gold Miners (GDX) suggests the Index is correcting the cycle from March 16, 2020 low. The correction is unfolding as a double three Elliott Wave Structure. In the 60 minutes chart below, we can see wave (X) of this double three ended at $42.05. The Miners have turned lower in wave (Y).
The internal of wave (Y) is unfolding as a zigzag Elliott Wave structure. Down from wave (X) high at $42.05, wave ((i)) ended at $38.03, and bounce in wave ((ii)) ended at $39.24. Index resumes lower in wave ((iii)) towards $37.52, wave ((iv)) ended at $37.87, and wave ((v)) ended at $36.73. This ended wave A of (Y) in higher degree.
Index then bounced in wave B which ended at $38.42. Internal structure of wave B unfolded as a zigzag where wave ((a)) ended at $38.08, wave ((b)) ended at $37.39, and wave ((c)) ended at $38.42. The Gold Miners have extended lower in wave C. Down from wave B high at $38.42, wave ((i)) ended at $37.83 and wave ((ii)) ended at $38.29. Expect a few more lows in the Index to end wave C of (Y) before GDX finds support. A potential support area is 100% – 123.6% Fibonacci extension from August 5, 2020 high which comes at $31.05 – $33.10.


With more money printed - DXY fallsWith more money printed - DXY falls to new lows
Bullish for equities and precious metals!

Winter is coming...And everybody knows what gold likes to do at the start of a new year.
Current fall channel will collide with primary channel and 200 day moving average, sometime in mid December.
