Gold (+12.8%) & Silver (+59.41%); [Hold]I remain long both of these CFD's since the original signal given for both linked below.
GDX

THE WEEK AHEAD: M, CLDR, CRWD EARNINGS; GDXJ/GDX, SLV, QQQTHE WEEK AHEAD:
EARNINGS ANNOUNCEMENT VOLATILITY CONTRACTION PLAYS:
M (41/103/September 18.7%): Announces Wednesday before market open.
Potential Plays:
September 18th 13 short straddle, paying 1.30 as of Friday close, .33 at 25% max.
September 18th 5/7/7/9 iron fly, paying 1.07 as of Friday close, .27 at 25% max.
Look to take profit at 25% max.
CLDR (68/116/September 20.1%): Announces Wednesday after market close.
Potential Plays:
September 18th 13 short straddle, paying 2.60 as of Friday close, .65 at 25% max.
September 18th 9/13/13/17 iron fly, paying 2.13 as of Friday close, .53 at 25% max.
Look to take profit at 25% max.
CRWD (32/74/September 15.0%): Announces Wednesday after market close.
Potential Plays:
September 18th 101/145 short strangle, paying 4.03 as of Friday close, 2.01 at 50% max.
September 18th 100/105/140/145. Markets are showing wide in the off hours, but look to put on a setup that pays at least one-third the width of the wings in credit.
Comments: Not a ton is shaking next week for options liquid underlyings, but here are what appear to me to be the best candidates for volatility contraction plays. Naturally, I'm just preliminarily pricing these out to see whether they're potentially worthwhile, and actual strikes are likely to change somewhat running into earnings as price moves.
EXCHANGE-TRADED FUNDS SCREENED FOR >35% 30-DAY IMPLIED/OCTOBER AT-THE-MONEY SHORT STRADDLE PAYING >10% OF STOCK PRICE:
SLV (45/56/15.2%)
XLE (24/39/11.2%)
GDX (22/47/13.3%)
GDXJ (21/58/15.7%)
EWZ (17/44/12.3%)
XOP (13/50/14.1%)
GDXJ is paying the most as a function of stock price (15.7%), followed by SLV (15.2%), XOP (14.1%), and GDX (13.3%).
WHAT THE SHORT STRANGLES NEAREST 16 DELTA ARE PAYING:
The GDXJ October 16th 15/75 short strangle: 2.15, 3.6% as a function of stock price,
The SLV October 16th 22/32 short strangle: .97, 3.6% as a function of stock price.
The XOP October 16th 45/63 short strangle: 1.84, 3.5% as a function of stock price.
The GDX October 16th 38/47 short strangle: .84, 2.0% as a function of stock price.
Comments: I've already got a miners play on, so am likely to avoid getting into another closely correlated underlying here.
BROAD MARKET:
QQQ (29/32/8.8%)
IWM (22/28/7.6%)
EFA (17/20/5.6%)
SPY (12/22/5.3%)
WHAT THE SHORT STRANGLES NEAREST 16 DELTA ARE PAYING:
The QQQ October 16th 257/320 short strangle is paying 6.51, 2.2% as a function of stock price.
The IWM October 16th 140/170 short strangle, 2.93, 1.9%.
The EFA October 16th 60/69 short strangle, .93, 1.4%.
The SPY October 16th 317/391 short strangle, 4.95, 1.4%.
Comments: In the IRA, I've been mechanically selling 45 days 'til expiry puts at the two times expected move strike (basically, the 16 delta) and will pretty much continue to do so until 30-day drops below 20%. There's always hesitancy to continue to do this at successive all-time-highs, and, yes, it is likely I will be assigned shares at some point in a >2 times expected move sell-off, after which I'll proceed to cover. That being said, I've got an inordinate amount of undeployed buying power after all the acquisitional short put ladders I put on in the sell-off have come off; I'd rather take some risk here to earn "something," all while keeping a reasonable amount of dry powder free to take advantage if we get another one of those bodice rippers we had in mid-March. This week, I'll follow the implied volatility, and as of Friday close, that was in the QQQ's.
DIVIDEND EARNERS:
XLU (21/23/7.1%)
EWA (20/24/7.0%)
TLT (18/19/4.8%)
EFA (17/20/5.6%)
EWZ (17/44/12.3%)
IYR (17/24/6.5%)
HYG (17/14/2.8%)
SPY (16/22/5.3%)
EMB (11/11/2.7%)
The Brazilian exchange-traded fund leads the pack for the umpteenth week in a row, with XLU and EWA in distant second and third places. I'm fine with continuing to hit EWZ via acquisitional short put over and over again if that's where the implied volatility leads, but, yes, it's kind of getting old.
For what it's worth: The 2 times expected move EWZ October 16th 28 short put is paying .36 per contract as of Friday close (1.2% as a function of stock price).
Key: The first number in parentheses is the implied volatility rank or percentile (i.e., where implied volatility is relative to where it's been over the past 52 weeks); the second, 30-day implied volatility; and the third, the percentage of stock price that the specified monthly expiry at-the-money short straddle is paying.

GDX daily chart - looks like the pullback is overIt is breaking out both for the price and the RSI, RSI is above 50 and MACD is positive.

Gold (Inverted) vs. 10-Year Treasury Indexed Yield for 8/27Gold (Inverted) vs. 10-Year Treasury Indexed Yield for 8/27

IS THE DOLLAR ABOUT TO BOTTOM?You need to be paying close attention to the Dollar. We have some history written right on the chart if we'll just take a moment to interpret it. My interpretation might be different than yours but that's why we share our ideas.. and it would be a boring world if we all thought the same way. I don't watch the Dollar very often but I see very obvious price cycles on multiple levels going on here. There appears to be a potential larger cycle low that will begin pulling down on the Dollar over the next 7-8 years. However, the Dollar could be bottoming in the near term on a smaller cycle. I think it has the potential to rally back up to the upper trend (just like 1999-2002) before the long drop. Notice the symmetrical triangle and where the measured move is pointing to- I can't say if that target has been reached yet or if it's even valid but the measured move is near that upper trend. It'll be interesting to see if the Dollar can make that climb one more time (107-111?) before the likely descent. It'll also be interesting to see how precious metals respond if the Dollar does manage to rally again.. I would be thrilled to see another discount in the metals but there's a chance that the best discount is now.. There's no promise of lower prices in Gold & Silver again with what we're witnessing today.

$GDX (+18.47%) + $SLV (+53%) {HOLD}From two original buy signals given here on my profile linked below.

GDXJ to 43$ soon! After its bounce, Gold started to descend as the dollar is showing signs of bouncing back up.
Should stock show signs of weakness, it will bring this down...
50% FIB target around $43
Same analysis applies to GDX but target is different.
Disclaimer: The above is just an idea, not an investment advice. Do your own diligence, trade safely and stay safe!

🍾Warren Buffet joins Schiff - who is else is coming the party?If there was any doubt that the gold miners are not about to start a new bull market, that doubt has been squashed by Berkshire Hathaway buying some Barrack Gold.
Before this news I was expecting the GDX to go as low as $32 in this corrective move, but the cats out the bag and I’m sure bigger players will start entering into this space in the coming weeks/months (hedge funds etc).
From the $45~ top we’ve gone as low as $38~ which looked like a blow off top like we saw in gold. On top of that there was some bearish divergence between price and RSI that I have highlighted in yellow.
The bounce from this level backtested the old trend line and it looks like the next move is lower.
The gold chart looks be in a corrective phase too which gives me greater reason to believe the GDX will follow suit (you can see my gold chart by checking out my profile).
The first area to add to longs is the $37, this has been a major support/resistance where I expect a bounce.
If that level does not hold, a while back I thought we would make the move all the way down to $32~, but that seems rather unlikely thanks to Warren, instead I’d welcome prices to hit $35-$34 level, the GDX did face some heat at this level in May and June.
Have any questions about the GDX in the short-term? Leave a comment below.

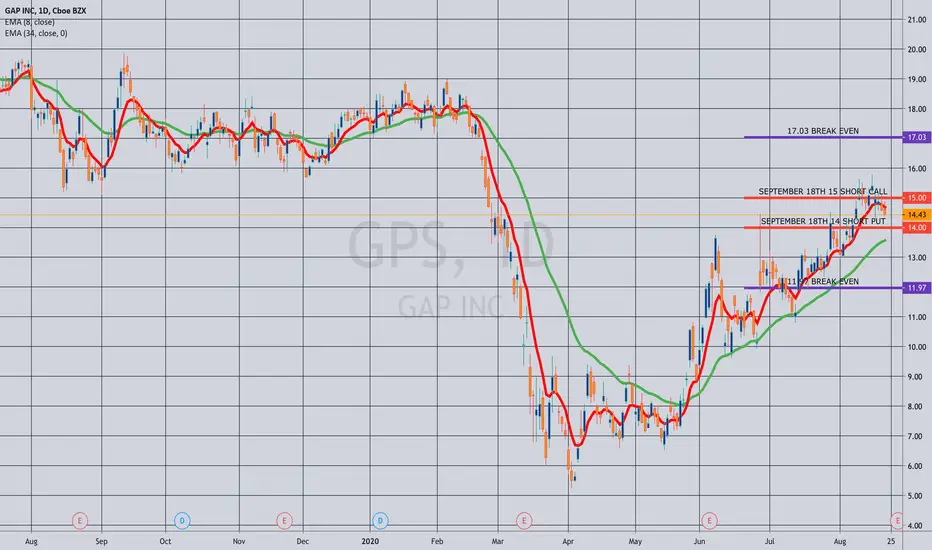
THE WEEK AHEAD: GPS; SLV, GDX/GDXJ, XOP, IWM/RUTEARNINGS:
GPS (37/82/17.0%) is really the only earnings announcement that interests me from a volatility contraction perspective. Pictured here is a September 18th skinny short strangle, which was paying 2.03 as of Friday close.
EXCHANGE-TRADED FUNDS SCREENED FOR IMPLIED >35% AND WHERE THE OCTOBER AT-THE-MONEY SHORT STRADDLE IS PAYING >10% OF STOCK PRICE:
SLV (50/61/17.4%)
GDX (22/47/14.1%)
XLE (21/37/11.6%)
GDXJ (19/55/16.7%)
EWZ (18/45/13.2%)
XOP (14/49/14.0%)
Juice as a function of stock price resides in SLV (17.4%), followed by GDXJ (16.7%), GDX (14.1%), and XOP (14.0%).
BROAD MARKET:
QQQ (23/28/8.2%)
IWM (23/29/8.4%)
EFA (17/21/5.6%)
SPY (16/22/5.8%)
IWM/RUT is where the premium is, relatively speaking, followed by the QQQ's.
DIVIDEND YIELDERS:
XLU (18/22/6.8%)
EWA (18/22/7.8%)
EWZ (18/45/13.2%)
IYR (17/22/6.9%)
EFA (16/22/5.6%)
SPY (16/22/5.8%)
HYG (15/13/3.3%)
TLT (14/16/4.6%)
EMB (11/10/2.8%)
Brazil ... again?!
Miners bull trend resumes.After this week I´m convinced we have seen the bottom in gold stocks.
From here on, prices will go up and retrace, but making higher lows.
I think we´ll probably face two phases.
1) From here to the end of August, GDXJ will go up and retrace a few times until they surpass the previous high. I expect GDXJ 61-62$ Tuesday - Wednesday.
(63$ or more would need gold to reach almost previous high). Keep an eye close. After this top, a retracement back to 58-59$ for next week, and up again.
I´ll pay attention that price don't fall the big channel. I seriously would be surprise if it does. The trend to the upside is very strong.
2) After that, prices should flow alike June, until the end of September, inside a tiny channel. From the 21th of September on, I should pay special attention, because i believe prices would begin to behave "toppy", like past two weeks. Gaps up, and drops, new highs also, and the last week of September or the first of October the Top.
I expect GDXJ around 90 $ (86 to 96) in those dates.
And Gold around 2.300 also at the end of September.
It's early, but this is a possible road map following previous patterns. I'm totally convince in a bullish scenario, after August (for example). If it fit this one it would be just coincidence.
www.youtube.com
If prices fall from the channel, a bearish scenario. I don't believe it would happen, but Mr. Market doesn't care what I believe.
And after that....well, If we reach the 90s...the we could correct and come back to the 60s. It happened before. But that is another tale, and we are far from there.
www.youtube.com
Have a nice week and good luck.

KGC- Gold/Silver mining play (Industry)As usual, demand for Gold mining stocks has risen with the ore rally. Mining stock such as KGC has outperformed major gold/silver mining ETFs and completely obliterated gold/silver ETFS since March.
It is a higher risk and higher reward play for investors who want to ride the gold/silver trend.
EV/EBITDA TTM, Price/cash flow TTM and many other valuation ratio indicate that KGC are undervalued compared to its peers.

Silver ... another wave up brewingSilver ... another wave up brewing. See my chart and notice pricing is going up in the last few bars in the 4h against a negative red ROC. Since ROC indiactor (top chart) is lagging. It it'll print the green ROC on a green most of all times.
I'm in AGQ for a small position and short day trading play.

The case for QUAD-digit silverIs it so difficult to imagine silver going 10x over the next 3-4 years? That would put the price over 290 per oz. What about a 30-40x move to over 1000 per oz? I can make an easy case for triple & quadruple digit silver over the next decade just by looking at the silver : M2 money supply. The creation of our currency = inflation. While this inflation (expansion) tends to go into financial assets first, it will catch up with the real economy in time. I believe deflation is temporary and the lag that we're witnessing is similar to the count down before a rocket takes off. Take a look at the Federal Reserve's balance sheet. We have a problem and it's going to catch up with us quickly. Look at the chart below of SILVER:M2 to understand where silver price is in relation to M2 money supply and how historically cheap silver actually still is..

Elliott Wave View: Gold Miners (GDX) Ready to Resume HigherGDX 45 minutes chart below shows that the stock has ended the cycle from June 5 low as wave (3). The rally ended at 45.78 high. From there, the stock did a pullback in wave (4), which unfolded as a zigzag Elliott Wave Structure. Down from August 5 high, wave A ended at 42.25 low. The bounce in wave B ended at 44.18 high. Afterwards, the stock resumed lower in wave C, which ended at 38.82 low. This ended wave (4) in larger degree.
Afterwards, the stock has resumed higher from wave (4) low. Up from that low, the stock ended wave ((i)) at 40.69 high. Wave ((ii)) pullback ended at 39.05 low. Currently wave ((iii)) is in progress, where wave (i) of ((iii)) ended at 41.03 high and wave (ii) ended at 39.72 low. As long as pivot at 38.82 low stays intact, the dips in 3,7 or 11 swings is expected to find support for more upside. However, the stock still needs to break above wave (3) high at 45.78 to confirm that wave (4) is already in place and the next leg higher in wave (5) has started. Otherwise, the stock can still do a double correction in wave (4).


Silver losing the shine.Firstly, please support our work by clicking like button & or following! These really assist us to reach more investors & traders like you! Silver lost momentum and slid below $27,00. Technically it is forming a pennant and a break-out seems to be still far. Any further bearish movement will target the $23,00 per ounce support region.

Could Gold be headed for a double top? Gold could form a double top like it did in early March before heading lower and hit the .618 Fib target of low 1700.
This is a short term move so you could play this with GLD Aug 28th calls with: Stop at GLD below 178.5.
First Target 190 (gap fill)
Second Target 194.5 (double top)
If that plays out, the next move down would be even bigger! It would then be followed by a very bullish trend for gold even bigger again and for the longer term!
Miners could also be an option for this play but in March, although Miners did go up, they did not rise to their February top (see blue line). So I prefer GLD for this setup.
Disclaimer: The above is not an investment advice. It is merely an opinion and I share it for your entertainment only. Do your own due diligence and above all, trade safely and stay safe!

Gold; Life below $2000,00 againFirstly, please support our work by clicking like button & or following! These really assist us to reach more investors & traders like you!
Prices collapsed into a long-term ascending channel before quickly recovering. Prices are yet to stabilize and create a better technical structure.

Updated- GOLD (AUD) daily chart. Still in UpTrend for now. Updated- GOLD (AUD) daily chart. Still in UpTrend for now.


The gold reset we've been waiting forAgain, I am very bullish for gold long-term but things were getting crazy. Too much distance between price and mean, too over-bought, and (of course) the parabolic shape GLD and SLV began taking. Today is not a suprise and I expect the bleeding to continue. An amazing buying opportunity awaits us but we will need to be patient!!
