Generalelectric
Correlation trading of cheap stockCorrelation trading strategy idea analysis.
Today I showed you possible correlation trading of $MU.
This was an example of not expensive stock.
In this idea, I will go even further and show you possible correlation trading on the example of $GE.
$GE is a cheap stock, so it is good for correlation trading with a small deposit.
Look at the $SPY and $GE charts.
Actual corresponding support&resistance levels look so much alike.
Correlation is good enough to expect future similar moves.
I said in the previous idea that now it is a good time for intraday shorts.
So, it is desirable to watch on support levels with particular attention.
But in one moment the trend can make U-turn.
In that case, a lot of short positions will be clothed.
SPY will return to growth.
So, it is desirable to mark important resistance levels and be ready for this scenario.
Following the correlation trading strategy, it is reasonable to wait for correlated level breaking.
When $SPY and $GE simultaneously break their resistance levels, It will be possible to buy $GE.
When $SPY and $GE simultaneously break their support levels, It will be possible to short $GE.
Do not view this idea as a recommendation for trading or investing. It is published only to introduce my own vision.
Always do your own analysis before making deals. When you use any materials, do not rely on blind trust.
You should remember that isolated deals do not give systematic profit, so trade/invest using a developed strategy.
If you like my content, you can subscribe to the news and receive my fresh ideas.
Thanks for being with me!
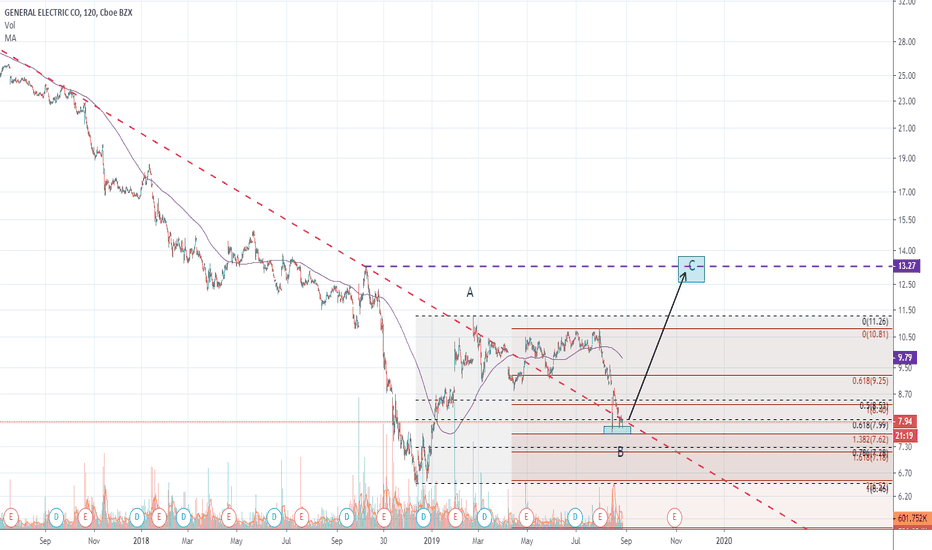
General Electric - contrarian buy?NYSE:GE is not the stock you probably want to own given all the heat experienced by the company recently.
But from contrarian perspective, nice levels right now to attempt speculative buy. Price retraced by 61.8% of previous bounce and is holding the line of previous resistance. Today may be the third daily candle when 7.8 is held, indicating that good support zone might be formed at around current levels.
Trade: stop at 6.39 (previous low), target at ~13$
GENERAL ELECTRIC (GE): Close To Supply Zone
General Electric is very close to a decent area of supply.
looking left at structure we can see how the underlined area was significant for the market participants in the past.
+ rsi has reached the overbought condition and we haven't seen a bearish reaction on this stock since summer 2019.
good luck!
General Electric: New Bull Cycle starting.GE is on Higher Highs on the 1W chart for the first time since August 2016. That was the last peak before a strong 2 year bear cycle hit the company. As you see on the chart General Electric's trend is a parabolic Channel starting with the All Time Highs in 2000. This long term curve has entered its asymptotic phase and may initiate the recovery back to the ATH.
At this stage however we choose to focus on the next Bull Cycle which based on the following parameters is about to start:
* As mentioned Higher Highs on 1W.
* RSI on a Channel Up.
* Long term support at 5.50 holding.
A Golden Cross will simply confirm the new Bull Cycle. We are still in the early stages, GE is an excellent long term investment for your portfolio.
Our Target Zone is 28.00 - 32.00.
** If you like our free content follow our profile (www.tradingview.com) to get more daily ideas. **
Comments and likes are greatly appreciated.
GE (General Electric), Look at this Mirror Level!..In this chart, you can see a nice example of how Mirror Levels works.
If you see such a situation you can open your position with a nice risk/reward ratio!
Push like if you think this is a useful idea!
Before to trade my ideas make your own analysis.
Write your comments and questions here!
Thanks for your support!
GE at key W resistance | Opp. for shortGeneral Electric has reached a key daily and weekly resistance.
It has already re-tested this resistance and I would like to use it as an opportunity. Now, if the price will have really weakness it should drop and filled a market gap at $9.70 which would be also our target.
If there will be no strength in our resistance I will immediately cut this trade, because overall this stock looks very strong in the short term. Take this idea as some relief to take more longs at $9-10 levels.
GE Short Setup - 1:4 Risk to Reward / RISKYGE daily chart shows weakness. I am expecting a pullback to $10.50. I can buy some puts for this. However there's no reversal signal yet. If I wait for a confirmation, the risk to reward will be less. I have decided to buy the risk.
GE SHORT TRADE SETUP
Entry: 11.39
Stop-Loss: 11.60 (0.21)
Take-Profit: 10.56 (0.83)
Risk to reward: 1:3.95
Winning probability: Less than 40%
NOTE: I am not very comfortable with the stop-loss. During the trade, i can move it up to 1:2 Risk to reward. That's why I'm not going to risk more than 1% of my account.
Disclaimer: This is not an investment or financial advice. Please do not copy my trades.
Remember to follow me.
Trade safe,
Atilla Yurtseven
Lifetime opportunity, soon Bankruptcy, short with PUT options!!It's time to talk about the story of a decade!
It is now clear, that General Electric has been cooking it's books for years now!
Says Harry Markopolos, a legendary whislteblower, who runs a finical fraud detection company, famous with him exposing Bernie Madoff and his Wall Street firm Bernard L. Madoff Investment Securities LLC, a hedge fund that turned out to be a giant Ponzi Scheme!
The company is allegedly lacking 39 billion in cash, that being a conservative estimation, covering up it's losses with sophisticated accounting and it's organizational structure!
I am long PUT options on the 2.00-1.5 level with 4-6 moths expiration, and will be adding to the portfolio each month!
When the company announces it's bankruptcy the stock price will go below the mentioned levels, ideally to a couple of cents per share!
A MASSIVE opportunity with 1:100/ 1:300 returns, as the put options on these levels are currently worth almost nothing!
even if the odds of it going bankrupt is 1:2, the risk return ratio is just mind blowing!
It is important to note, that I am taking 4-6 months as an average for the previous cases of such fraud detection, like Enron and WorldCom, which both went bankrupt within 4 moths after the exposure!
S NYSE:GE o I am just being on the safe side here, being up put options with further expiration each month!
It does not matter how the stock's price behaves during these 4 months.If it goes up, take it as the opportunity to double down on your PUTS position.
General Electric - Expect volatilityGE, America's sweetheart has been accused of fraud allegations before. This time though, it's by the same person who did it on the Madoff Scheme (Harry Markopolos)
Markopolos’ main points of contention are:
1) GE’s insurance obligations are woefully under-reserved and it has been lying to the Kansas Insurance Department
2) GE shouldn’t have consolidated BHGE’s financial statements, which are a source of confusion
3) GE’s evolving presentation makes it very difficult to evaluate GE’s operating performance.
-------
In response to the whole ordeal, General Electric's CEO bought $2million in shares.
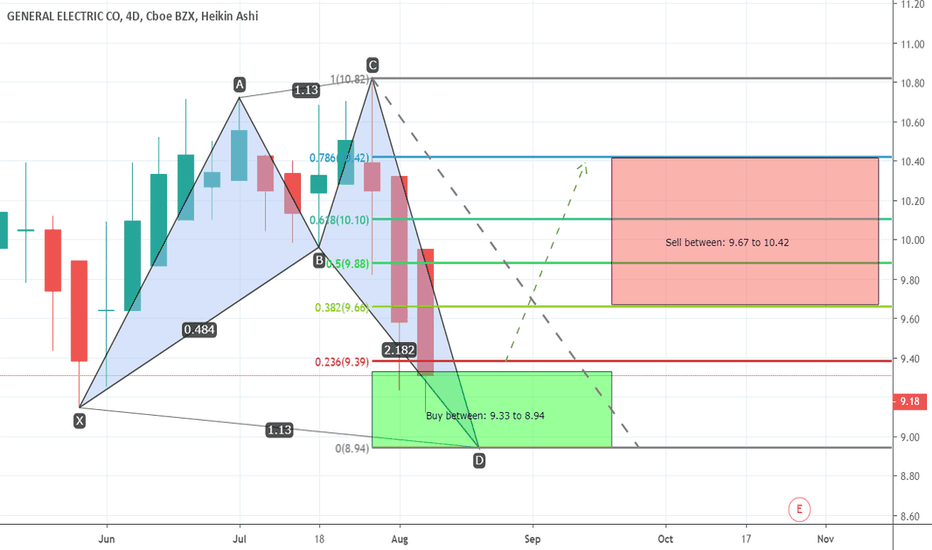
GE formed bullish shark a good long opportunityPriceline of GENERAL ELECTRIC CO (GE) Stocks has completed a bullish shark pattern and entered in potential reversal zone.
From here price aciton will take bullish divergence soon insha Allah.
I have defined targets using Fibonacci sequence as below:
Buy between: 9.33 to 8.94
Sell between: 9.67 to 10.42
Regards,
Atif Akbar (moon333)


