Analyzing Inflation: COVID-19, Energy, Conflict & LaborInflation, a critical financial and economic indicator, has been significantly impacted by various factors in recent years. This article delves into the influence of COVID-19, changes in work patterns, labor market shifts, energy sector decisions, and the Russia-Ukraine war on inflation, presenting a comprehensive analysis of our present financial landscape.
COVID-19 and Supply Chains: A Recipe for Inflation
The global pandemic, COVID-19, significantly disrupted supply chains worldwide. With a combination of limited supply and robust or surging demand, the result was inevitable - a price increase, a key driver of inflation. Rising costs of materials, labor, energy, and transportation, all amplified by the pandemic, made goods more expensive to manufacture and transport, further contributing to inflation.
The aftermath of these disruptions led to a ripple effect: a rise in supply chain costs. Consumers facing higher prices found themselves with reduced disposable income, which could, in theory, lower demand. However, the essential nature of many goods affected by these disruptions likely negated this potential offset, fueling inflation further.
In the long run, these disruptions could lead to persistent inflation. The pandemic has exposed the fragility of 'just-in-time' inventories and the impact of underinvestment in global commodity supply chains, adding to inflationary pressures. Consequently, inflation may become a more permanent fixture, disrupting business planning and forecasting and adding another layer of complexity to the economic environment.
Labor Market Shifts: From Crisis to Recovery
The pandemic has considerably affected the labor market, resulting in significant shifts and shortages across various sectors. The initial outbreak led to severe job losses, with the global unemployment rate peaking at 13%. However, as economies start to reopen, we're seeing an interesting trend: people voluntarily leave their roles, even as worker demand increases.
This labor shortage, induced by changing demographics, border controls, immigration limits, and the call for better pay and flexible work arrangements, presents another challenge in our economic landscape. Furthermore, the acceleration of digitalization and the gig economy could have enduring effects on labor supply and productivity. The crisis has potentially long-term implications, like automation's role in slowing the employment recovery in service occupations.
Remote Work: A Double-Edged Sword
The rise of remote work, while offering significant societal and economic benefits, also carries potential inflationary effects. Increased demand for houses/apartments, home office equipment, utilities, and other home-centric products and services has led to price hikes, accelerating inflation.
Moreover, while remote work has the potential to boost productivity and create new job opportunities, it also brings challenges. Difficulties in collaboration, communication hurdles, and blurred work-life boundaries could negatively impact productivity, painting a more complex picture of remote work's overall effect on productivity and inflation.
Energy Decisions: A Balancing Act
The decision to reduce investments in nuclear energy and fossil fuels can influence inflation and the overall energy market. A decline in energy production can lead to price increases due to supply-demand imbalances, contributing to inflation. Moreover, reduced domestic energy production may increase dependence on imported energy, which, if more expensive or if international energy prices rise, could also lead to inflation.
Transitioning to green energy without adequate investment and planning could lead to shortages and disruptions, driving up energy prices and contributing to inflation. While renewable energy technologies are advancing rapidly, they cannot fully replace the capacity provided by nuclear and fossil fuels in many countries. This could lead to energy shortages and price increases, particularly if the transition to green energy outpaces the technology's readiness.
The variability of renewable energy sources, such as wind and solar, presents another challenge. Without adequate energy storage and grid infrastructure investment to manage this variability, energy supply disruptions and price spikes could become more common.
Moreover, a rapid transition to green energy could displace existing energy jobs before adequate green energy jobs are created. This could lead to economic instability and potentially contribute to inflation. While the long-term costs of renewable energy can be lower than fossil fuels, the initial investment required to build renewable energy infrastructure can be high. Higher energy prices can pass these costs to consumers, contributing to inflation.
In conclusion, while the transition to green energy is crucial for addressing climate change, this transition must be well-planned and well-managed. Policymakers must strike a careful balance between the urgency of climate action and the need to maintain energy security and economic stability.
The Russia-Ukraine War: Geopolitical Inflation
The ongoing conflict between Russia and Ukraine has also played a role in driving inflation. The war has disrupted the supply of essential commodities such as oil, gas, metals, wheat, and corn, pushing their prices upwards. These nations are major suppliers of these commodities, and their reduced supplies have led to sharp price increases worldwide.
Furthermore, the conflict has exacerbated global supply chain disruptions, already strained by the COVID-19 pandemic. This has led to heightened inflationary expectations among businesses and consumers. Additionally, the war has significantly increased oil and gas prices, particularly in Europe, directly impacting inflation and household spending.
The war has also weakened global economic confidence, further fueling inflationary pressures. Countries already grappling with financial challenges, such as Lebanon and Zimbabwe, have been severely impacted by the inflationary effects of the Russia-Ukraine war. Overall, the conflict is estimated to add about 2% to global inflation in 2022 and 1% in 2023, compared to pre-war forecasts.
Conclusion
In conclusion, the dynamic interplay of the COVID-19 pandemic, remote work, labor market shifts, energy sector decisions, and the Russia-Ukraine war has significantly influenced inflation. Policymakers, economists, and businesses must navigate this complex landscape to develop effective strategies that mitigate inflationary pressures while promoting sustainable economic growth. As we move forward, we must continue to monitor these factors to understand their ongoing effects on inflation and the broader economy.
Geopolitics


UJ ShortAfter negative dollar sentiment, and a rejection off the MA on multiple timeframes. UJ and all USDXXX pairs will be expected to fall going into the rest of the trading week.

EUR/USD Daily Chart Analysis For Week of February 17, 2023Technical Analysis and Outlook:
The Eurodollar this week continued a downward retreat. The price action created new Mean Sup 1.066 as the intermediary beak point from the knockout punch. The leading upside target designation is Mean Res 1.075 - dead cat rebound. Once this puppy settles down, we will see a revival to the downside aiming for the main target of the Inner Currency Dip of 1.046.

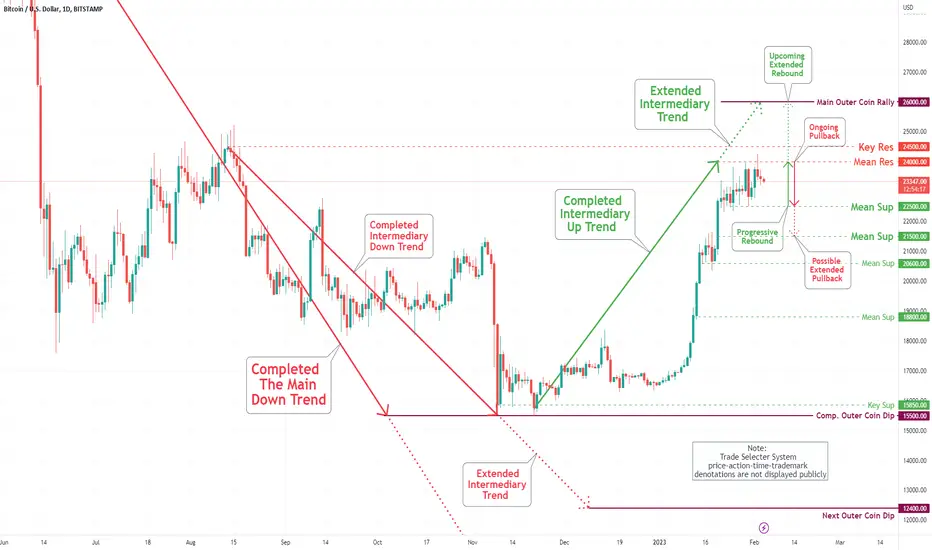
Bitcoin (BTC/USD) Daily Chart Analysis For Week of Feb 3, 2023Technical Analysis and Outlook:
Bitcoin extended a progressive rebound to a new Mean Res $24,000 - with the expectation of a pullback to the Mean Sup $22,500 and, possibly, an extension to Mean Sup $21,500. Once this puppy flushes out weak-longs, resumption to retest the Mean Res $24,000 and the Key Res $24,500 is imminent with a rally all the way to the Outer Coin Rally of $26,000.
EUR/USD Daily Chart Analysis For Week of January 20, 2023The euro-dollar continuously stayed close to our newly created Key Res $1.086 this week and displaying a solid movement towards Outer Currency Rally $1.110 as specified in EUR/USD Daily Chart Analysis for December 30. However, be aware that this puppy is prone to breaking downwards to Mean Sup $1.078 and possibly $1.070 to reignite upward action Outer Currency Rally $1.110.

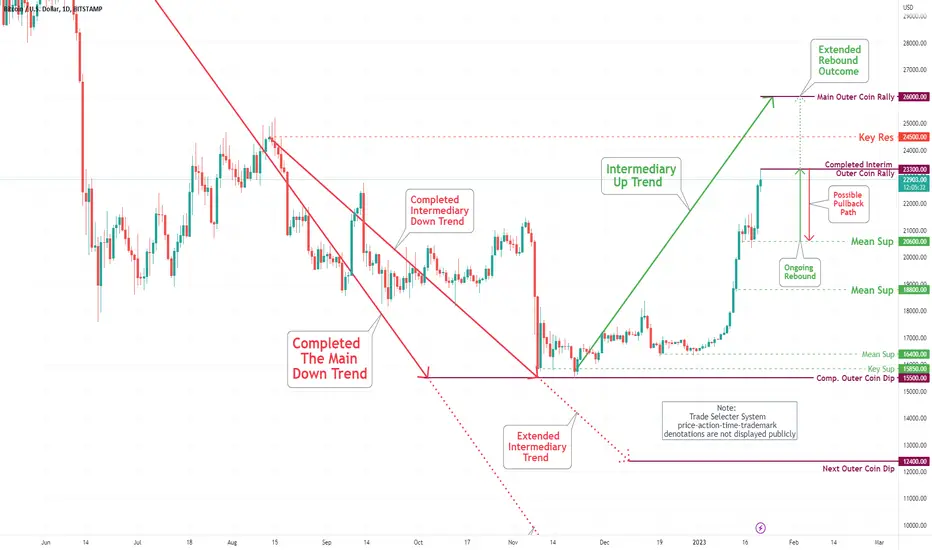
Bitcoin (BTC/USD) Daily Chart Analysis For Week of Jan 20, 2023Technical Analysis and Outlook:
Bitcoin completed the Outer Coin Rally of $21,200 and Key Res $ 21,300 on January 14 and stayed very near the outcome throughout the week - busting through on Friday with follow-through on Saturday to complete the interim Outer Coin Rally of $23,000 (Not shown 60 min chart). The pending confirmation is in the process - Once confirmed, the pullback to Mean Sup $20,600 is inevitable. Once this puppy settles down, we will see a resurgence on the upside to finalize the Outer Coin Rally of $26,000.
Economic Outlook for 10-15 years aheadMy Economic Outlook for 10-15 years ahead
The rare double-dip recession
October CPI report shows Inflation slightly decreased to 7.7% and The Fed already made a statement to decrease The Fedfunds Rate. Potential Fed pivot approximately will occur in Q1 or Q2 of 2023. That will be the time of disinflationary period or maybe we are already in by now. What to be expected in disinflationary period is stock market drawdown will continue, rising unemployment, more business entities will collapse, fewer job openings, in short 2023 will be dark especially in the US. Technically it is a recession.
The good news is inflation can be pushed back to 2% area and from there QE can be restarted. Most people that already tired by long economic drawdown are strongly craving for bull market. Productivity will rise again along with its economic and secondary leverage and a creeping up inflation leaving the 2% area. An inherent nature of capitalism.
The question is what will be the destiny of Petrodollar as its losing control over the total international trade volume. The rapid change of global power dynamics which spearheaded by BRICS+ economy has substantially diminish the Dollar hegemony. The regional powers that have control over the world commodities are grouping up to create a new, commodity-backed currency. In addition to that there is a strongly rising tension between Russia and NATO.
More than 50 years ago, the US left the Bretton-Woods System and to keep the US dollar relevant as global reserve currency, Petrodollar was introduced and rapidly embraced by the OPEC which consequently making the US Dollar became the world's most traded currency. That is the underlying value of the Dollar besides of debt.
But the current astronomical $30+ Trillion of government debt and the weakening of Petrodollar globally has come to a critical question of what will be the next US decisive move?
Chaos has to be applied first to disrupt any potential challenger to the US Dollar, and from there a revolutionary economic policy has to be implemented.
Worst case scenario is the new Great Depression can manifest after almost 100 years since its first occurrence in 1929.
Note: This economic outlook which also the same with any version of economic outlook is subject to a high degree of uncertainty. This post is mean for educational purpose only.

EUR/USD Daily Chart Analysis For Week of December 2, 2022Technical Analysis and Outlook:
The euro dollar continues to rally onto Mean Res 1.0585 is intact with the possibility of an extension to the Key Res 1.0780. The upcoming prevailing down path is pointing to the new Mean Sup 1.0330. Once the current down sentiment occurs, a furious decline to the previously specified support level will emerge - See previous chart analysis postings.

EUR/USD Daily Chart Analysis For Week of November 25, 2022Technical Analysis and Outlook:
Eurodollar declined to our Mean Sup 1.0285 as specified on the EUR/USD Daily Chart Analysis For November 18 chart followed by a rebound to strategic completed and retested Inner Currency Rally 1.0380. The current prevailing down path is pointing to the new Mean Sup 1.0237. The current down sentiment is prone to further declines: Mean Sup 1.014, 1.000, and 0.975. The down-trend projects for the Next Outer Currency Dip of 0.937 is being delayed.

EUR/USD Daily Chart Analysis For Week of November 18, 2022Technical Analysis and Outlook:
Following the strong Eurodollar rebound the previous week, the currency
completed our designated target of the Inner Currency Rally 1.038 this week, as specified on the EUR/USD Daily Chart Analysis For November 11 chart. Since completing the target, the Eurodollar is in retreat mode to Mean Sup 1.0285, potentially followed to a completed Inner Currency Rally of 1.038 retests one more time.
The prevailing down move is prone to pull back to our additional Mean Sup 1.014, 1.000, and 0.975. The down-trend projects for the Next Outer Currency Dip of 0.937 for the foreseeable future is being reignited.

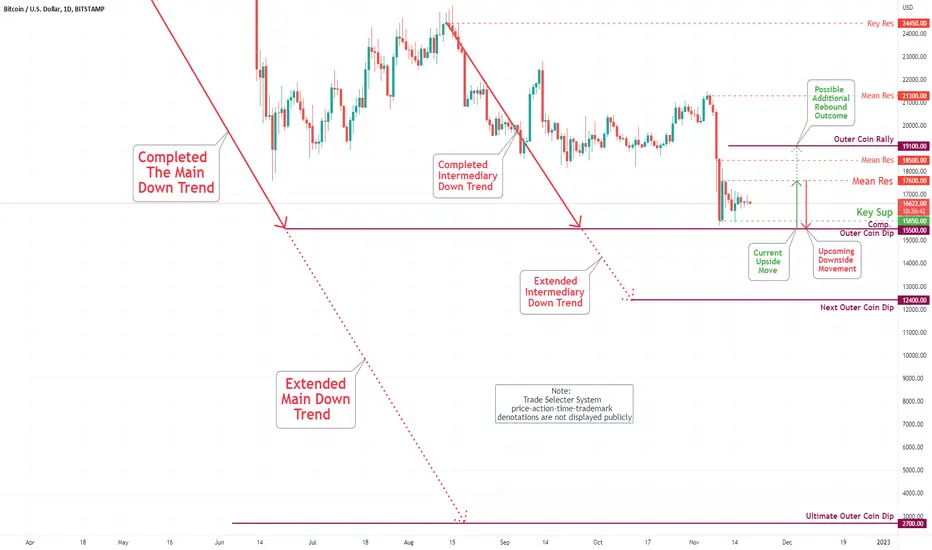
Bitcoin (BTC/USD) Daily Chart Analysis For Week of Nov 18, 2022Technical Analysis and Outlook:
Bitcoin has repeated bounce from our Key Sup $15,850 on Nov 14. The coin is currently positioned itself to hit the Key Sup $15,850 and completed the Outer Coin Dip marked at $15,500, launching sharp upside movement to Mean Res $17,600 and Outer Coin Rally $19,100. The down-trend projects for the next Outer Coin Dip of $12,400 in the foreseeable future is being shelved for now.
Bitcoin (BTC/USD) Daily Chart Analysis For Week of Nov 11, 2022Technical Analysis and Outlook:
Bitcoin has completed our designated Outer Coin Dip of $15,500, as shown since Bitcoin Daily Chart Analysis For June 17. As a result, a massive rally was staged, creating Mean Res $17,600 launching from Key Sup $15,850 for an upcoming upside move with an additional Outer Coin Rally marked at $19,100. The down-trend projects the next Outer Coin Dip of $12,400 in the foreseeable future.

S&P 500 Daily Chart Analysis For Week of October 28, 2022Technical Analysis and Outlook
The upside target marked at 3875 has been completed. Mean Res 3955 and Outer Index Rally 3975 are in the making. Follow-through above targets down move designated to Mean Sup 3805 is very high, with the possibility of the two additional targets - for NOW.

EUR/USD Daily Chart Analysis For Week of October 28, 2022Technical Analysis and Outlook:
Eurodollar has completed a market rebound by producing a high-probability retest marked at Mean Res 1.0080 and 1.0150. The downside move shows Mean Sup 0.9870 as a first stop with follow through three significant down destinations, with a continuation to the next Outer Currency Dip of 0.9370, which is in the making.

Bitcoin (BTC/USD) Daily Chart Analysis For Week of Oct 28, 2022Technical Analysis and Outlook:
Bitcoin has completed a market rebound by producing medium strength Mean Res $20,800 with the continuous outcome mark at Outer Coin Rally of $22,200. The down path shows us a retracement to Mean Sup $20,300 and possibly all the way down to Mean Sup $19,300.

Uranium Spot Hype is Nearing local peakit might cool off next year, i wouldn't suggest investing in uranium and thinking its a long term growth opportunity.
stick to facebook, amazon, bitcoin, or google

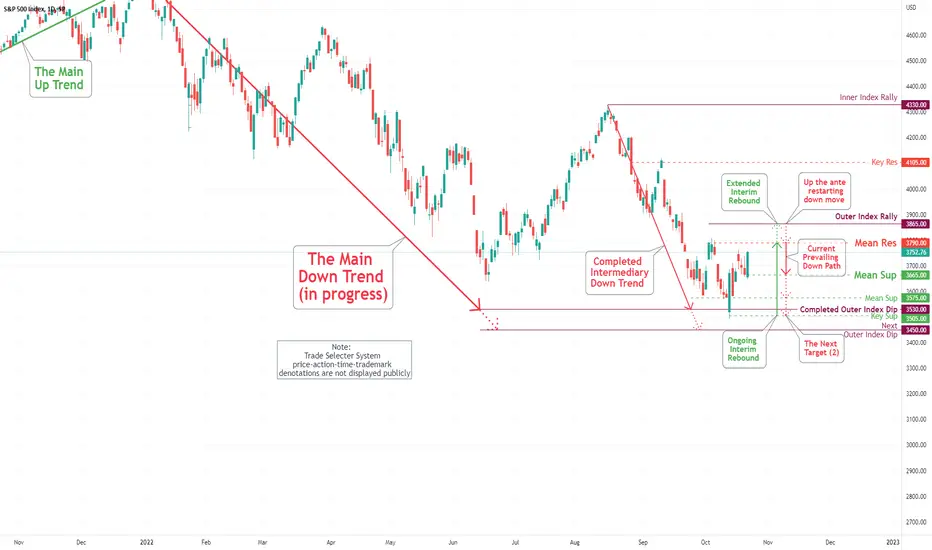
S&P 500 Daily Chart Analysis For Week of October 21, 2022Technical Analysis and Outlook
Currently, in the S&P 500 market, we have tremendous volatility both ways . . . traders/investors are losing both ways. The longs get stopped on the downside, and the shorts get stopped on the upside. What we got is that the whole floor gives way. Pay attention to the critical data presented here.
The upside target is marked at Mean Res 3790 and Outer Index Rally 3865. The downside destination is the retest of the Mean Sup 3665: Followed by the Mean Sup 3575, a retest of the completed Outer Index Dip 3530, and Key Sup 3505. Continuation to the next Outer Index Dip of 3450 is in the making.
EUR/USD Daily Chart Analysis For Week of October 21, 2022Technical Analysis and Outlook:
The Eurodollar bounced swiftly from our Mean Sup 0.9700 and rested at our Mean Res 0.9860; however, retesting the Mean Res 0.9987 and 1.0020 is probable. The significant downside move is a) from the current position, b) From up the ante restarting down move of 1.0020. The main targets continue to be our Key Sup 0.9595 and completed Inner Currency Dip 0.9570. Continuation to the next Outer Currency Dip of 0.9370 is in the making.

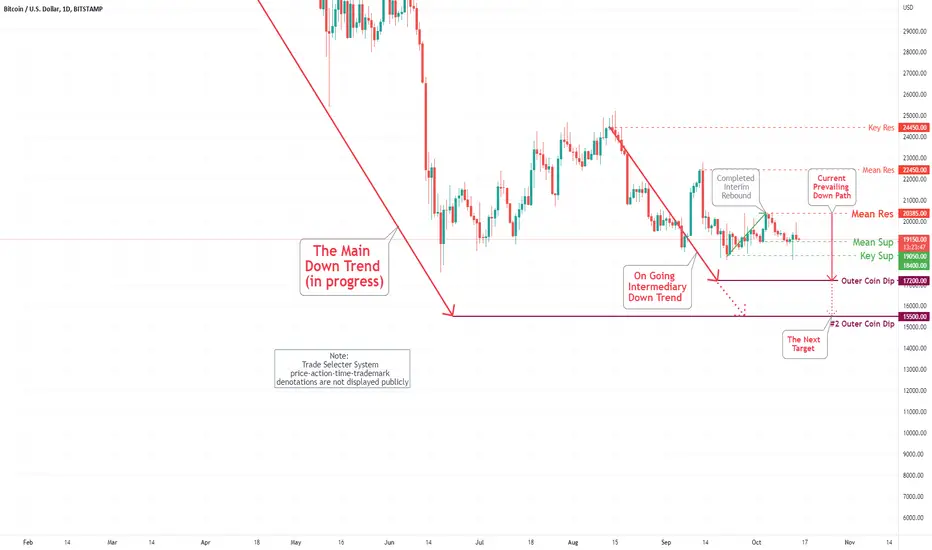
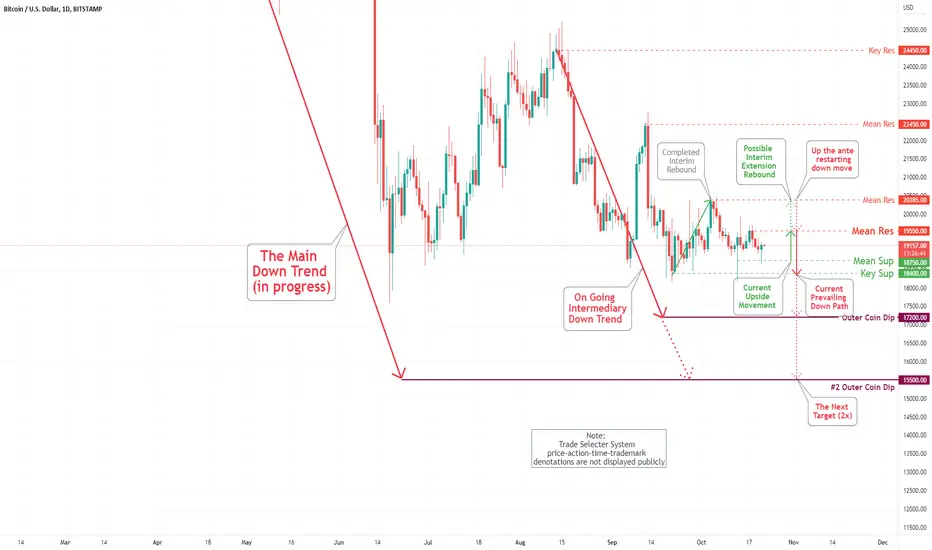
Bitcoin (BTC/USD) Daily Chart Analysis For Week of Oct 21, 2022Technical Analysis and Outlook:
The Bitcoin is churning between our Mean Res $19,550 and Mean Sup $18,750. As specified on the Bitcoin (BTC/USD) Daily Chart Analysis For October 14, the possibility of moving to the Outer Coin Dip of $17,200 and extending the overall outcome to the #2 Outer Coin Dip at $15,500 is in the process. Reaching out in the short-term to the Mean Res $19,550 and possibly Mean Res $20,385 is blowing hot and cold.
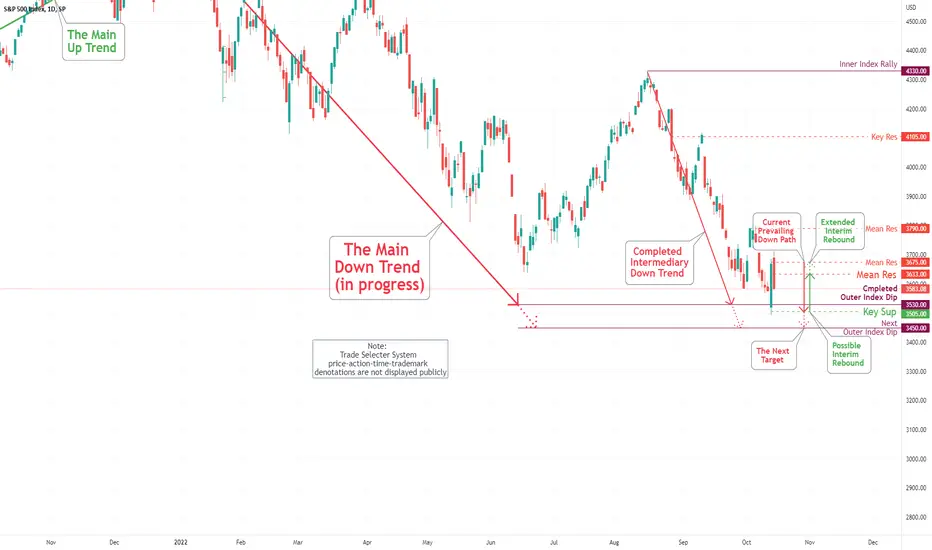
S&P 500 Daily Chart Analysis For Week of October 14, 2022Technical Analysis and Outlook
The immediate reversal on Friday of the vigorous upside rebound (Dead-cat ricochet) on Thursday was caused by the long-term specified Outer Index Dip 3530 (Oversold market): The downside target is the retest of the Key Sup 3505, Outer Index Dip 3530 with the Next Outer Index Dip 3450 is in the making. Following the completed above-specified targets, a short-term move leading to the newly created Mean Res 3633 is possible.
EUR/USD Daily Chart Analysis For Week of October 14, 2022Technical Analysis and Outlook:
The Eurodollar's failed attempt to retest our Mean Res 0.9987 indicates high negative market sentiment; however, the retest of the newly created Mean Res 0.9780 is probable. As specified in the EUR/USD Daily Chart Analysis For Week of October 7, the main downside targets continue to be our Key Sup 0.9595 and completed Inner Currency Dip 0.9570. Continuation to the next Outer Currency Dip of 0.9370 is in the making.

Bitcoin (BTC/USD) Daily Chart Analysis For Week of Oct 14, 2022Technical Analysis and Outlook:
The Bitcoin completed down movements to targets of Mean Sup $19,050 and Key Sup $18,400 as specified Bitcoin (BTC/USD) Daily Chart Analysis For October 7, with the possibility of extending to the prevailing move to #2 Outer Coin Dip at $15,500 is much greater at the current market sentiment. The case of the short-term upside move to the Mean Res $20,385 is low.