Why QuickLogic? Unpacking its Semiconductor Surge.QuickLogic Corporation, a vital developer of embedded FPGA (eFPGA) technology, currently navigates a rapidly evolving semiconductor landscape marked by intense technological innovation and shifting geopolitical priorities. Its recent inclusion in the Intel Foundry Chiplet Alliance signals a pivotal moment, affirming QuickLogic's expanding influence in both defense and high-volume commercial markets. This strategic collaboration, combined with QuickLogic’s advanced technological offerings, positions the company for significant growth as global requirements for secure and adaptable silicon intensify.
Critical geopolitical imperatives and a profound shift in semiconductor technology fundamentally drive the company's ascent. Nations are increasingly prioritizing robust, secure, and domestically sourced semiconductor supply chains, particularly for sensitive aerospace, defense, and government applications. Intel Foundry's efforts, including the Chiplet Alliance, directly support these strategic demands by cultivating a secure, standards-based ecosystem within the U.S. QuickLogic’s alignment with this initiative enhances its status as a trusted domestic supplier, expanding its reach within markets that value security and reliability above all else.
Technologically, the industry's embrace of chiplet-based architectures plays directly into QuickLogic’s strengths. As traditional monolithic scaling faces mounting challenges, the modular chiplet approach gains traction, allowing for the integration of separately manufactured functional blocks. QuickLogic's eFPGA technology provides configurable logic, perfectly suited for seamless integration within these multi-chip packages. Its proprietary Australis™ IP Generator rapidly develops eFPGA Hard IP for advanced nodes like Intel’s 18A, optimizing power, performance, and area. Beyond defense, QuickLogic's eFPGA integrates into platforms like Faraday Technology's FlashKit™-22RRAM SoC, offering unparalleled flexibility for IoT and edge AI applications by enabling post-silicon hardware customization and extending product lifecycles.
Membership in the Intel Foundry Chiplet Alliance offers QuickLogic tangible advantages, including early access to Intel Foundry's advanced processes and packaging, reduced prototyping costs through multi-project-wafer shuttles, and participation in defining interoperable standards via the UCIe standard. This strategic positioning solidifies QuickLogic’s competitive edge in the advanced semiconductor manufacturing landscape. Its consistent innovation and robust strategic alliances underscore the company’s strong future trajectory in a world hungry for adaptable and secure silicon solutions.
Geopolitics

Platinum's Quiet Ascent: What Drives Its New Value?Platinum, often operating in the shadow of gold, has recently experienced a significant surge in value, reaching multi-year highs and capturing considerable investor attention. This resurgence is not arbitrary; it stems from a complex interplay of industrial demand, tightening supply, evolving geopolitical dynamics, and a notable shift in investment sentiment. Understanding these underlying forces becomes crucial for investors seeking to decipher the trajectory of this vital industrial precious metal.
A primary catalyst for platinum's price rally is its strong industrial utility, particularly within the automotive sector, where it remains indispensable for catalytic converters. While the rise of battery electric vehicles presents a long-term shift, the robust growth in hybrid vehicle production continues to sustain demand. Critically, the market faces persistent physical deficits, with supply consistently falling short of demand for the past two years, a trend projected to continue into 2025. Mine output struggles due to disruptions in key producing regions, such as South Africa and Zimbabwe, and secondary supply from recycling has proven insufficient to bridge the growing gap.
Geopolitics and strategic investment further amplify platinum's upward trajectory. China has emerged as a pivotal market, with a sharp rebound in demand as consumers increasingly favor platinum for both jewelry and investment amidst record gold prices. This strategic pivot by the world's largest consumer market is reshaping global platinum price discovery, supported by China's initiatives to develop new trading ecosystems and futures contracts. Concurrently, renewed investor confidence is evident in growing inflows into platinum Exchange-Traded Funds (ETFs) and robust physical buying, with anticipated lower borrowing costs also enhancing its appeal.
In essence, platinum's current rally reflects a powerful combination of tightening supply and resilient industrial demand, underscored by strategic shifts in major consumer markets and renewed investor interest. As above-ground stocks gradually deplete and the market anticipates continued deficits, platinum is poised for a sustained period of relevance, offering compelling prospects for those who recognize its multifaceted value proposition.

EUR/USD Daily Chart Analysis For Week of June 6, 2025Technical Analysis and Outlook:
During the current trading session, the Eurodollar has exhibited notable volatility, mirroring patterns observed in the previous week. The currency surpassed a significant Mean Resistance level of 1.142 and encountered substantial resistive price action near the crucial Key Resistance level of 1.151. Recent analyses indicate that the Euro is likely to approach the critical Mean Support level at 1.137 and may decline to the subsequent Mean Support level at 1.129. Nevertheless, there exists the possibility of an upward movement from the current level or the Mean Support at 1.137, which could result in a target Mean Resistance of 1.145 and a retest of the Key Resistance at 1.151.

Nu Holdings: Is Latin America's Fintech Star Sustainable?Nu Holdings Ltd. stands as a prominent neobank, revolutionizing financial services across Latin America. The company leverages the region's accelerating smartphone adoption and burgeoning digital payment trends, offering a comprehensive suite of services from checking accounts to insurance. Nu's impressive trajectory includes acquiring 118.6 million customers, accumulating $54 billion in assets, and consistently demonstrating robust revenue and net income growth, primarily driven by its strong presence in Brazil, Mexico, and Colombia; - this strategic alignment with digital transformation positions Nu as a significant player in the evolving financial landscape.
Despite its remarkable expansion and optimistic projections for continued customer and asset growth, Nu faces notable financial headwinds. The company experiences an erosion in its net interest margin (NIM), influenced by increased funding costs from attracting new, high-quality customers and a strategic shift towards lower-yield, secured lending products. Furthermore, the depreciation of the Brazilian Real and Mexican Peso against the US dollar impacts their reported earnings. Nu's ambitious ventures, such as the NuCel mobile phone service, require substantial capital investments, introducing execution risks and demanding efficient capital allocation.
Beyond internal financial dynamics, a significant, albeit external, geopolitical risk looms: a potential Chinese invasion of Taiwan. This event would trigger a global embargo on China, leading to unprecedented supply chain disruptions, widespread stagflation, and hyperinflation worldwide. Such a catastrophic economic cascade would profoundly impact Nu Holdings, even given its regional focus. It would likely result in drastically reduced consumer spending, a surge in loan defaults, severe challenges in accessing funding, further currency devaluations, and soaring operational costs, thereby threatening the company's stability and growth prospects.
Ultimately, Nu Holdings presents a compelling growth narrative rooted in its innovative model and strong market penetration. However, internal pressures from evolving interest margins and high capital expenditure, combined with the low-probability but high-impact global economic upheaval stemming from geopolitical tensions, necessitate a cautious and comprehensive assessment. Investors must weigh Nu's demonstrated success against these complex, intertwined risks, acknowledging that its future prosperity is inextricably linked to both regional economic stability and the broader global geopolitical climate.

EUR/USD Daily Chart Analysis For Week of May 30, 2025Technical Analysis and Outlook:
The Eurodollar has experienced significant volatility during this week's trading session. It reached a significant Mean Resistance level at 1.142 while also encountering Mean Support at a target of 1.122. Recent analyses suggest that the Euro is likely to revisit the critical target of 1.142, which includes Key Resistance at 1.151 and the completed Outer Currency Rally at 1.157. However, there is a potential for a downward correction from the current level, which could lead to prices retesting the Mean Support of 1.122. There is also a possibility for further declines, reaching the Outer Currency Dip at 1.108.

EV Crossroads: Is BYD's Price War the Future of Mobility?The electric vehicle (EV) sector is currently navigating a period of significant turbulence, exemplified by the recent stock decline of Chinese EV giant BYD Company Limited. This downturn follows BYD's aggressive strategy of implementing sweeping price cuts, ranging from 10% to as much as 34% across its electric and plug-in hybrid models. This bold maneuver, primarily aimed at reducing a burgeoning inventory that swelled by approximately 150,000 units in early 2025, has ignited fears of an intensified price war within China's fiercely competitive EV market. While analysts suggest these discounts could temporarily boost sales, they also underscore deeper anxieties stemming from slowing EV demand, persistent economic sluggishness in China, and ongoing US-China trade frictions, leading to concerns about margin compression across the industry.
In stark contrast to BYD's emphasis on manufacturing scale, vertical integration, and aggressive pricing, Tesla distinguishes itself through a relentless pursuit of technological supremacy, particularly in autonomous driving. Tesla's foundational commitment to autonomy is evident in its Full Self-Driving (FSD) software, which has accumulated over 3.5 billion miles of data, and its substantial investments in the "Dojo" supercomputer and custom AI chip development. While BYD is also investing in advanced driver-assistance systems (ADAS), including the adoption of DeepSeek’s R1 AI model, Tesla's ambitious Robotaxi project represents a higher-risk, higher-reward proposition centered on true unsupervised autonomy, a strategy that proponents believe could fundamentally transform its valuation.
Further complicating the competitive landscape are escalating geopolitical tensions between the US and China, casting a long shadow over Chinese companies with exposure to US capital markets. Despite BYD's strategic avoidance of the US passenger car market by focusing on other international regions like Europe and Southeast Asia, the broader implications of Sino-American friction are inescapable. Chinese firms listed on US exchanges face rigorous regulatory scrutiny, the persistent threat of delisting under legislation like the Holding Foreign Companies Accountable Act (HFCAA), and the chilling effect of broader trade restrictions. This environment has led to stark warnings from financial institutions, with Goldman Sachs, for instance, outlining an "Extreme Scenario" where the collective market value of US-listed Chinese stocks could effectively vanish, highlighting how geopolitical stability is now as crucial to investment outcomes as any balance sheet.

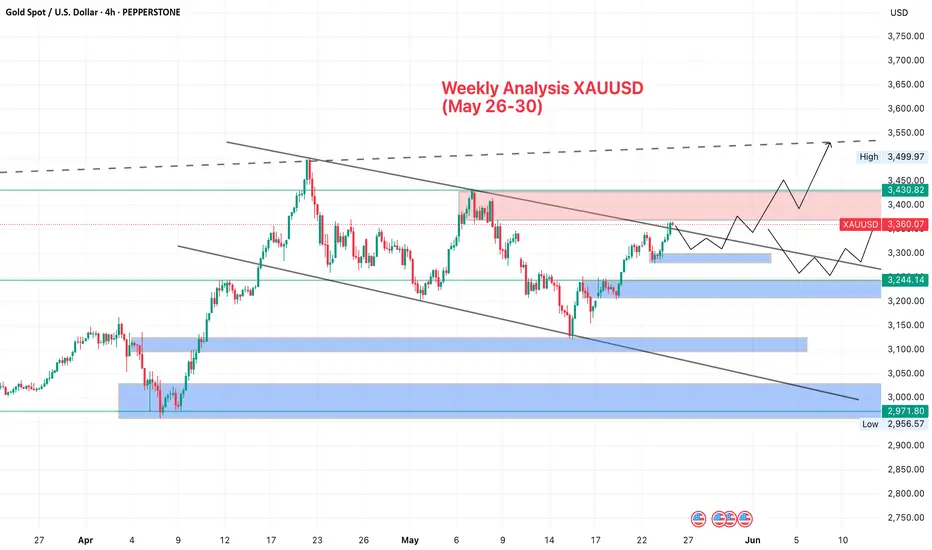
Weekly Analysis For XAUUSD (stress free trading) Weekly Analysis for Goldie (May 26–30)
From last week's analysis, we’re still on track and the move was fueled by news as expected. (just following Technical levels)
Gold broke the trendline clean and retested it, with structure still holding bullish. Price rejected around 3365, which aligns with the 4H fib (23%) and a minor supply zone. volume faded on Friday due to the early US close and the long weekend.
Powell’s speech is set for early Monday before the market opens. If he leans dovish or hints at rate cuts, gold could break above 3371 and push toward 3430 or even 3498. But if he stays hawkish, we might get another rejection at 3365 and a pullback to 3330 or even 3292 though the bullish bias remains intact unless 3244 breaks.
On the macro side, US/EU tariffs kicking in June 1 ongoing (but still unresolved) Iran talks, Trumps new tax bill adding more debt, and the Moody’s downgrade of the US credit outlook all lean toward further upside for gold. COT data also shows instiution still holding strong net long positions in gold.
⭐️ Expect low NY session volume on monday due to the US holiday. Key zones to watch 3371 for breakout continuation, 3330 and 3292 for pullback buys, and 3365 for short-term scalp rejections. Overall bias remains bullish with strong structure and macro confluence.
EUR/USD Daily Chart Analysis For Week of May 23, 2025Technical Analysis and Outlook:
The Eurodollar has demonstrated significant strength during this week's trading session, attaining a notable Inner Currency Rally at 1.129 and encountering Mean Resistance at 1.137. Recent analyses indicate that the Euro will likely progress towards the forthcoming target levels, specifically the Mean Resistance at 1.142 and the Key Resistance at 1.151. A retest of the completed Outer Currency Rally at 1.157 may facilitate this advancement. However, a potential downward pullback could emerge from the current price range, particularly in proximity to the Mean Resistance level of 1.137, with a possibility of declining to the Mean Support at 1.127.

Will Middle East Tensions Ignite a Global Oil Crisis?The global oil market faces significant turbulence amidst reports of potential Israeli military action against Iran's nuclear facilities. This looming threat has triggered a notable surge in oil prices, reflecting deep market anxieties. The primary concern stems from the potential for severe disruption to Iran's oil output, a critical component of global supply. More critically, an escalation risks Iranian retaliation, including a possible blockade of the Strait of Hormuz, a vital maritime chokepoint through which a substantial portion of the world's oil transits. Such an event would precipitate an unprecedented supply shock, echoing historical price spikes seen during past Middle Eastern crises.
Iran currently produces around 3.2 million barrels per day and holds strategic importance beyond its direct volume. Its oil exports, primarily to China, serve as an economic lifeline, making any disruption profoundly impactful. A full-scale conflict would unleash a cascade of economic consequences: extreme oil price surges would fuel global inflation, potentially pushing economies into recession. While some spare capacity exists, a prolonged disruption or a Hormuz blockade would render it insufficient. Oil-importing nations, particularly vulnerable developing economies, would face severe economic strain, while major oil exporters, including Saudi Arabia, the US, and Russia, would see substantial financial gains.
Beyond economics, a conflict would fundamentally destabilize the geopolitical landscape of the Middle East, unraveling diplomatic efforts and exacerbating regional tensions. Geostrategically, the focus would intensify on safeguarding critical maritime routes, highlighting the inherent vulnerabilities of global energy supply chains. Macroeconomically, central banks would confront the difficult task of managing inflation without stifling growth, leading to a surge in safe-haven assets. The current climate underscores the profound fragility of global energy markets, where geopolitical developments in a volatile region can have immediate and far-reaching global repercussions.

Honeywell: Quantum Leap or Geopolitical Gambit?Honeywell is strategically positioning itself for significant future growth by aligning its portfolio with critical megatrends, notably aviation's future and quantum computing's burgeoning field. The company demonstrates remarkable resilience and foresight, actively pursuing partnerships and investments designed to capture emerging market opportunities and solidify its leadership in diversified industrial technologies. This forward-looking approach is evident across its core business segments, driving innovation and market expansion.
Key initiatives underscore Honeywell's trajectory. In aerospace, the selection of the JetWave™ X system for the U.S. Army's ARES aircraft highlights its role in enhancing defense capabilities through advanced, resilient satellite communication. Furthermore, the expanded partnership with Vertical Aerospace for the VX4 eVTOL aircraft's critical systems positions Honeywell at the forefront of urban air mobility. In the realm of quantum computing, Honeywell's majority-owned Quantinuum subsidiary recently secured a potentially $1 billion joint venture with Qatar's Al Rabban Capital, aiming to develop tailored applications for the Gulf region. This significant investment provides Quantinuum with a first-mover advantage in a rapidly expanding global market.
Geopolitical events significantly influence Honeywell's operational landscape. Increased global defense spending presents opportunities for its aerospace segment, while trade policies and regional dynamics necessitate strategic adaptation. Honeywell addresses these challenges through proactive measures like managing tariff impacts via pricing and supply chain adjustments, and by realigning its structure, such as the planned three-way breakup, to enhance focus and agility. The company's strategic planning emphasizes leading indicators and high-confidence deliverables, bolstering its ability to navigate global complexities and capitalize on opportunities arising from shifting geopolitical currents.
Analysts project strong financial performance for Honeywell, forecasting substantial increases in revenue and earnings per share over the coming years, which supports expected dividend growth. While the stock trades at a slight premium to historical averages, analyst ratings and institutional investor confidence reflect positive sentiment regarding the company's strategic direction and growth prospects. Honeywell's commitment to innovation, strategic partnerships, and adaptable operations positions it robustly to achieve sustained financial outperformance and maintain market leadership amidst a dynamic global environment.

EUR/USD Daily Chart Analysis For Week of May 16, 2025Technical Analysis and Outlook:
During the current trading session, the Eurodollar has exhibited notable signs of weakness, ultimately reaching a critical Outer Currency Dip at 1.111, facilitated by Mean Support at 1.119. Following this decline, the market experienced a pronounced rebound. Recent analysis indicates that the Euro will likely close with a retest of the completed Outer Currency Dip at 1.111, while it may progress towards the next Outer Currency Dip at 1.095. It is essential to highlight that upward "dead-cat" rebounds may arise within the current price range, particularly around the Mean Resistance level of 1.125, and could potentially approach an Inner Currency Rally at 1.129.

Global Calm, Fiscal Storm: The Yen's Challenge?The USD/JPY currency pair has recently experienced a notable surge, driving the Japanese Yen to its weakest level against the US Dollar in a month. This appreciation primarily stems from a significant improvement in global risk sentiment, sparked by a breakthrough trade agreement between the United States and China. This deal, aimed at reducing the US trade deficit, has bolstered investor confidence and diminished the traditional safe-haven appeal of the Yen. Adding to the dollar's strength is the Federal Reserve's continued hawkish stance, signaling no immediate plans for interest rate cuts and reinforcing the attractiveness of dollar-denominated assets amidst easing concerns about a US recession.
Simultaneously, internal economic pressures in Japan significantly weigh on the Yen. The nation's public debt has reached an unprecedented high, driven by persistent increases in defense spending and social welfare costs due to an aging population. Government subsidies for energy bills and the need to issue more bonds to cover rising expenditures exacerbate this fiscal strain. This challenging domestic backdrop contrasts sharply with the Federal Reserve's position, creating a widening divergence in monetary policy outlooks that favors the US Dollar through yield differentials, despite the Bank of Japan's cautious consideration of future rate adjustments.
Furthermore, reducing global geopolitical tensions has contributed to the shift away from safe-haven currencies. Recent ceasefires and prospects for diplomatic talks in key conflict areas have encouraged a "risk-on" environment in financial markets. This increased appetite for riskier assets directly reduces demand for the Japanese Yen, amplifying the impact of fundamental economic factors and monetary policy divergence on the USD/JPY exchange rate. The pair's trajectory remains subject to evolving global dynamics, upcoming economic data releases, and central bank communications.

EUR/USD Daily Chart Analysis For Week of May 9, 2025Technical Analysis and Outlook:
During this week's trading session, the Eurodollar exhibited signs of weakness following a rebound at the Mean Resistance level of 1.137. With decisive, vigorous bearish price activity, the currency pair decisively breached the critical Mean Support level of 1.128. Current market indicators suggest that the Euro will likely close on a Mean Support level of 1.119, moving further towards an Outer Currency Dip at 1.111. However, it is essential to acknowledge that upward dead-cat rebounds may re-emerge at the present price range level.

EUR/USD Daily Chart Analysis For Week of May 2, 2025Technical Analysis and Outlook:
The Euro currency has shown weakness in this week's trading session and is resting at the Mean Support designation marked at 1.128. The current trajectory indicates that the Euro is targeted to the downside, with a Mean Support level of 1.119 and an Outert Currency Dip of 1.111. However, it is essential to recognize that upward dead-cat rebounds may re-emerge from the Mean Resistance level or Outer currency Dip.

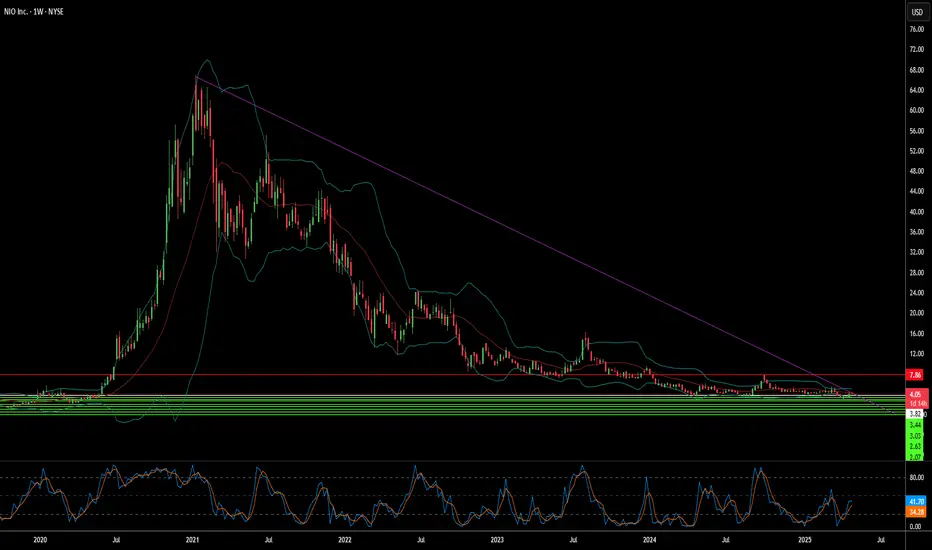
Is Nio’s ambition outpacing reality?Chinese electric vehicle maker Nio faces significant challenges despite strategic efforts like the recent launch of the Firefly brand. A successful and innovative company known for its battery swaps, Nio is now grappling with increasing domestic competition, slowing economic growth, and significant financial losses reflected in its low share price and market cap. The company’s path forward, and particularly its ambitious global expansion, increasingly appears fraught with external pressures and technological hurdles that threaten its long-term viability.
Chief among these challenges is rising geopolitical risks. Rising trade tensions between major global powers, including potential tariffs from the US and Europe, directly threaten Nio’s access to the international market and its growth prospects. More critically, the unresolved situation regarding Taiwan poses a serious risk of conflict (a Chinese invasion of Taiwan) and subsequent international embargoes. Such a scenario could disrupt global supply chains, especially for critical components such as semiconductors essential for electric vehicles, and cripple Nio’s production and sales.
Furthermore, Nio is in an expensive technological arms race, particularly in autonomous driving, competing with global leaders such as Tesla. While Nio uses a multi-sensor approach with LiDAR in its Navigate on Pilot Plus (NOP+) system, Tesla’s vision-only strategy and extensive data collection pose a formidable challenge. Both companies face obstacles, and with the complex task of perfecting autonomous technology in diverse environments, Nio must not only adapt to technological advances but also navigate complex regulatory landscapes and execute flawlessly to compete effectively and justify its significant investments in this space.
Is Europe's Decline Grounding Airbus's Ascent?Europe's economic situation presents a complex picture of modest growth juxtaposed with significant challenges, creating uncertainty for major players like Airbus. In 2024, the European Union's GDP growth was projected to be below 1%, with only a slight acceleration anticipated for 2025. This sluggish economic expansion, when coupled with persistent inflation and ongoing geopolitical tensions, lays an unstable foundation for sustained economic prosperity.
The cohesion of the European Union itself is increasingly in question, influenced by the rise of nationalist sentiments and the potential for increased trade protectionism. The EU faces structural challenges, including economic disparities, political divisions, and growing Euroscepticism, which could precipitate its disintegration. Should this occur, individual countries would be forced to navigate complex economic and geopolitical landscapes independently, generating significant implications for multinational corporations like Airbus.
Concurrently, Airbus is navigating a highly competitive environment, most notably with its enduring rivalry with Boeing, which is actively seeking to overcome its recent operational and reputational hurdles. While Airbus has recently secured a larger market share, Boeing's inherent resilience, combined with the potential entry of new competitors, may challenge Airbus's current market dominance.
To sustain its competitive edge, Airbus must not only effectively manage the economic uncertainties and potential fragmentation within Europe but also maintain its commitment to technological innovation and efficient production. The company's ability to nimbly adapt to these multifaceted challenges will be crucial in determining its long-term success and continued leadership in the global aerospace industry.

Peace Headlines Are Here — But Markets Have Already Moved OnA Russia-Ukraine peace deal making headlines right now is historic news — politically and emotionally.
But for the forex and commodities markets?
The real money already left this story behind months ago.
🧠 Smart Money Knows: Markets Price in the Future, Not the Past
Two years ago, the war sent shockwaves through oil, gas, wheat, and risk currencies.
By late 2023, price action had already normalized — the "war premium" faded out quietly.
Commodities stabilized. Forex volatility shifted. Safe havens lost their edge.
Traders adapted, recalibrated, and moved on to new battlegrounds.
Bottom Line:
The market already priced in a future where this conflict would eventually fade — peace or no peace.
📊 What Actually Drives Forex Now
While peace headlines grab attention, the real macro drivers today are:
🔥 Tariff escalation and global trade wars
🔥 Sticky inflation battles (core services inflation still high)
🔥 Central bank pivot games (Fed, ECB, BoJ)
🔥 Global growth fears (China slowdown, EU stagnation)
This is where new money is flowing.
Not into a two-year-old headline finally catching up.
🛡️ "Buy the Rumor, Sell the Fact" in Action
For two years, markets have priced in an eventual end (or fade) to the Ukraine conflict.
A peace agreement now?
→ It confirms expectations, not shocks them.
→ It may trigger a short-lived risk-on pop (EUR, AUD, NZD up, gold down) —
→ But unless it unleashes massive new money flows (unlikely), that pop gets sold.
🔥 Final Thought:
If you're still trading the last war, you're already late.
The next major moves won't come from peace headlines — they'll come from tariff escalations, inflation battles, and central bank pivots.
Focus forward.
That's where opportunity lives.
💬 Question for Serious Traders:
Which macro theme are you really watching into summer 2025?
Peace headlines... or the new fires already burning?
Drop your insights below. 👇

EUR/USD Daily Chart Analysis For Week of April 25, 2025Technical Analysis and Outlook:
In the most recent trading session, the Euro successfully retested the completed Outer Currency Rally level at 1.142 and completed the subsequent target identified within the Outer Currency Rally at 1.157. Consequently, the Euro experienced a firm decline to the Mean Support level of 1.131. However, it is essential to recognize that upward momentum may re-emerge, facilitating a retest of the Key Resistance level at 1.151 or potentially leading to a further decline toward the next support level designated as Mean Support at 1.119.

The Ruble's Unlikely Triumph: What's Driving It?The early months of 2025 have seen the Russian Ruble emerge as the world's top-performing currency, achieving a significant appreciation against the US dollar. This unexpected rally is largely attributed to robust domestic economic measures. Faced with persistent inflation exceeding 10%, the Central Bank of Russia implemented a stringent monetary policy, raising the key interest rate to a high of 21%. This aggressive stance not only aims to curb price growth but also makes the Ruble highly attractive to foreign investors seeking elevated yields through carry trade strategies, thereby increasing demand for the currency. Furthermore, a healthy trade surplus, marked by increased exporter conversion of foreign earnings, has bolstered the Ruble's supply-demand dynamics.
Beyond internal economics, shifting geopolitical perceptions have played a vital role. Growing market anticipation of a potential ceasefire in the Ukraine conflict has notably reduced the perceived political risk associated with Russian assets. This improved sentiment encourages some international investors to return cautiously to Russian markets. Concurrently, a weakening trend in the US dollar, influenced by evolving US trade policies, has amplified the Ruble's relative strength on the global stage.
Strategically, Russia's ongoing efforts to decrease its reliance on the US dollar are also providing underlying support for the Ruble. Initiatives promoting trade settlements in national currencies, such as recent agreements enabling Ruble payments with Cuba, reflect a long-term pivot towards establishing alternative financial channels. However, this Ruble strength presents challenges, particularly for the state budget heavily dependent on converting dollar-denominated oil revenues. A stronger Ruble yields fewer domestic funds, potentially straining finances, especially amidst volatile global oil prices. The balancing act between maintaining high rates to control inflation and mitigating their impact on domestic credit and investment remains a critical consideration for policymakers.

EUR/USD Daily Chart Analysis For Week of April 18, 2025Technical Analysis and Outlook:
During the current trading session, the Euro has demonstrated a successful pullback to the anticipated support level of 1.128, from which upward momentum has emerged. Consequently, the currency is positioned to retest the previously completed Outer Currency Rally level of 1.142, potentially advancing towards the subsequent target marked next Outer Currency Rally at 1.159. However, it is essential to recognize that there is a possibility of downward momentum re-emerging should the Euro challenge the completed resistance at 1.142 or the forthcoming target of 1.159.

Chips Down: What Shadows Loom Over Nvidia's Path?While Nvidia remains a dominant force in the AI revolution, its stellar trajectory faces mounting geopolitical and supply chain pressures. Recent US export restrictions targeting its advanced H20 AI chip sales to China have resulted in a significant $5.5 billion charge and curtailed access to a crucial market. This action, stemming from national security concerns within the escalating US-China tech rivalry, highlights the direct financial and strategic risks confronting the semiconductor giant.
In response to this volatile environment, Nvidia is initiating a strategic diversification of its manufacturing footprint. The company is spearheading a massive investment initiative, potentially reaching $500 billion, to build AI infrastructure and chip production capabilities within the United States. This involves critical collaborations with partners like TSMC in Arizona, Foxconn in Texas, and other key players, aiming to enhance supply chain resilience and navigate the complexities of trade tensions and potential tariffs.
Despite these proactive steps, Nvidia's core operations remain heavily dependent on Taiwan Semiconductor Manufacturing Co. (TSMC) for producing its most advanced chips, primarily in Taiwan. This concentration exposes Nvidia to significant risk, particularly given the island's geopolitical sensitivity. A potential conflict disrupting TSMC's Taiwanese fabs could trigger a catastrophic global semiconductor shortage, halting Nvidia's production and causing severe economic repercussions worldwide, estimated in the trillions of dollars. Successfully navigating these intertwined market, supply chain, and geopolitical risks is the critical challenge defining Nvidia's path forward.

Will Gold Retest 3170 ATHs in Sight Amid Rising Global TensionsXAU/USD has decisively broken above the significant 3170 resistance level, confirming bullish momentum and signaling a potential continuation of its long-term uptrend. This breakout is not just technical—it's backed by a growing fundamental storm.
With escalating geopolitical tensions, the ongoing trade war rhetoric surrounding Trump’s tariff policies, and persistent global macro uncertainty, gold is once again asserting its role as a premier safe haven asset. These drivers are creating the perfect backdrop for further upside, possibly pushing gold toward new all-time highs.
Currently, price is in a healthy correction phase, pulling back toward the former resistance zone at 3170, which now acts as strong support. A retest and confirmation in this area may offer a high-probability long setup for trend-followers and breakout traders alike.

XOM Analysis: Oil's Next Move & Policy ShiftsNYSE:XOM currently piques my interest, particularly with oil prices potentially stabilizing or rising further. Recent geopolitical developments and policy shifts under Trump’s administration—such as rolling back Biden-era energy regulations, reducing methane fees, and easing LNG export permits—could significantly influence the energy landscape.
My intuition suggests Trump’s "Mar-a-Lago Accord" might involve major global economies reducing holdings of US dollar assets, swapping short-term treasuries for century bonds. Such currency shifts and reduced drilling activity could lead to a tighter oil supply, benefiting prices. Additionally, a weakening US dollar could positively impact technology stocks, as investors rotate towards sectors less affected by traditional commodities.
Technical Analysis (Daily & Hourly Chart)
Current Price: Approximately $103.00
Key Resistance Levels:
Immediate resistance: $103.93 (L.Vol ST 1b)
Important resistance zone: $104.74 (118 AVWAP)
Critical resistance (Last week's high): ~$106.46
Key Support Levels:
Near-term support: $101.13 (Weeks Low Long)
Major support: $97.92 (Best Price Short)
Trading Scenarios
Bullish Scenario (Continued oil strength & supportive policy shifts):
Entry Trigger: Sustained breakout and close above immediate resistance at $103.93.
Profit Targets:
Target 1: $104.74 (AVWAP resistance)
Target 2: $106.46 (recent swing high)
Stop Loss: Below recent pivot around $101.00, limiting risk effectively.
Bearish Scenario (Oil price weakness or production surge):
Entry Trigger: Failure to sustain the above resistance at $103.93 or a breakdown below near-term support at $101.13.
Profit Targets:
Target 1: $99.00 (psychological & short-term support)
Target 2: $97.92 (strong support, ideal short target)
Stop Loss: Above $104.75 to control risk in case of a reversal.
Thought Process & Final Thoughts
Given the current geopolitical and regulatory environment, XOM appears poised for potential upside if oil prices remain strong and policy shifts materialize. However, caution is warranted, as oil companies seem hesitant to increase production due to profitability concerns. Clearly defined technical levels will help navigate trade entries and exits effectively around these evolving macroeconomic conditions.
Earnings Date: May 2nd—Keep positions nimble as earnings can significantly impact short-term volatility.
