DAX alternateInstead of the wave IV triangle proposed earlier, we could also get a wave IV expanded flat with a brutal dump.
German


WHERE WILL VOLKSWAGEN GO? $VOW3Price rejected the 160 resistance line.
We are now in the blue zone, where price action is telling, that the price will probably move to the south.
Target is the 137 area.

Thursday's retail sales day and Friday is a day offThe latest news on Thursday. About the publication of the United States retail sales data. Unexpectedly, for most people the data turned out to be much better than forecasts (+ 1.6% m / m with the forecast of + 1.0% m / m). Recently, the US is not very pleased with macroeconomic statistics. So, everything is completely mixed up and it is difficult to say what is really happening with the US economy. However, the Dollar Index is too close to local maxima to buy a dollar. So we continue to look for points for its sales on the intraday basis.
Canada posted quite good retail sales data (+ 0.8% m / m with a forecast of + 0.4% m / m). But in the battle of two dollars, the American turned out to be stronger than the Canadian.
The UK decided not to lag behind and also showed growth in retail sales (+ 1.1% m / m with a forecast of -0.3% m / m). However, this did not help the pound much, and together with the dollar, it set off to storm the support of 1.30.
Another reason for selling the euro has been provided by Germany. The PMI index in the manufacturing sector in Germany was worse than expected and well below 50 (44.5, with a forecast of 45.0), which is a negative signal for both the largest economy in the Eurozone and for the European single currency.
Meanwhile, in the United States the number of active rigs has dropped sharply again. According to Baker Hughes, the number of oil installations for the week decreased by 8 to 825 pieces. Such news has supported oil. However, it is still at the local top. Recall that while oil (WTI brand) is below 64.50, we will look for opportunities to sell the asset on the intraday basis.
Today will be almost a “day off”. US, UK and German markets will be closed. This means a low level of liquidity and a “thin” market. Accordingly, the probability of sharp and unpredictable price fluctuations sharply increases. Therefore, it is worth being extremely cautious in order not to run into another flash crash.

LTC gutes R:R setup für eine Long PositionLTC wird wie es aussieht bis zum golden pocket retraced bevor es eine kurzfristige Trendwende geben wird. Gutes RR!

Scope to retrace further into 2019=> After a very tough year for European Equities, the bad news keeps coming. End of QE with a very dovish ECB was expected to keep equities afloat, however, we can still extend the lows another -5% till 10,178 - 10,160.
=> Tracking this chart very closely into the FED and remainder of the year for any signs of a reversal once we clear the final targets. For those looking to buy the dip, here we need above 11,726 to give any opportunity of a meaningful correction.
=> Best of luck to all those trading DAX and other European Equities for the final hour in 2018.

EUR/USD — The Most Bullish It’s Been For MonthsThe USD weakness playing through after Powell’s Put is evident in the valuation of the Euro. While I’ve argued that I simply can’t envision the multi-month range to be decisively broken, price action and volume is king as they reflect the market’s intentions. The close above the first layer of resistance at 1.1443 is a major warning sign that yet another attack towards 1.15 is on the cards. Notice, the retest of 1.15 would be just 4 days after it was last tested, which suggests sellers’ conviction is definitely waning. The pick up in the risk environment underpins the USD liquidation short-term, as does the latest fundamental developments by the Fed (blinking), which was well telegraphed by the widening of the German vs US bond yield spread. However, the economic data in the EZ is far from giving us much enthusiasm as the repercussion for a dovish tilt in the ECB monetary stance cannot be underestimated. The bond yield curve in Germany should be a red flag. Overall, it looks like an opportunity to be a buyer on weakness remains the scenario most attractive, especially if one considers that the downside is now supported by the backside of the 1.1443 + range POC at 1.14.

Buy Dax Index at 10920 with the sl 10820 and tp 11100Buy Dax Index at 10920 with the sl 10820 and tp 11100

EUR/USD: Buy on weakness favored as valuation point northThe pair has been stuck in a 100+ pips range ever since the spike in demand off Nov 28 lows. Market makers and range traders have been dominating for now, with 1.13 to the downside being the line drawn in the sand by value buyers. I say ‘value’ because at present, any Euros being exchanged nearby the 1.13 are definitely offered at a discount based on where the German vs US yield spread and the Italian premium trade at. The decoupling is too obvious to ignore, which makes buying on weakness a very viable strategy. Ever since the origin of the demand candle on Nov 28, the price has been achieving higher levels, while any attempts to transact offers for bids that meet the 1.1315/20 periphery are rejected in no time. Overall, this is a market that has written on the wall, buy me at discount prices for now.

Dax buy opportunity if trend holds otherwise danger aheadThis is a long term chart of the German Stock Index Dax. The upper trendline was established at the pre Financial Crisis peak in 2007 and later at the peaks of 2015 and 2017. This were good selling points. The lower support trendline is giving support since the Creek Dept Default Crisis in 2011 and fears of a China Slow Down in early 2016. This were good buy points. Recently, the trendline was testet again on fears of a Trade War with China, Brexit and Italian Credit, which presents a buying opportunity als long the support trendline stays intact. Otherwise danger ahead, because of a huge rising wedge pattern of a historical size.

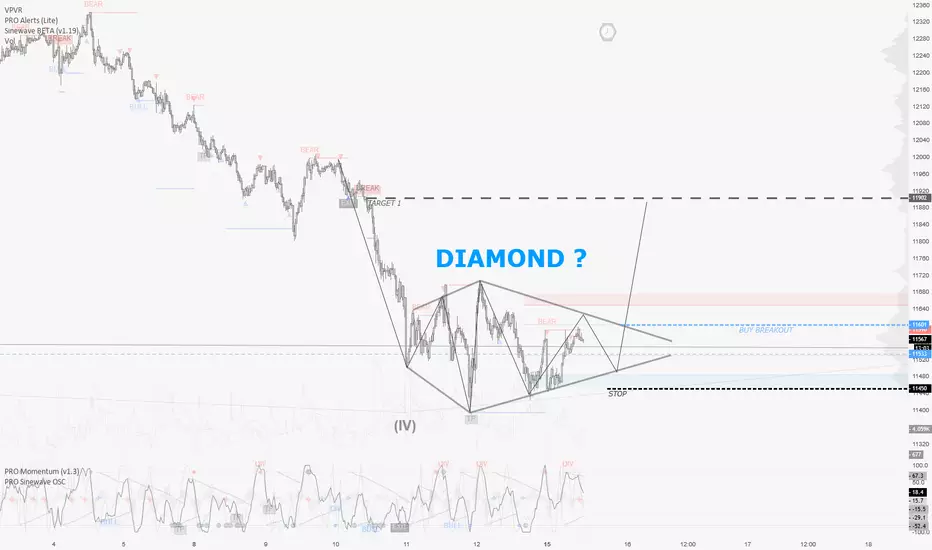
DAX / 15m : Diamond reversal on the way ?NOTE : This is an early trade scenario... still needs further wave confirmation before placing the actual trade..
Hope this idea will inspire some of you !
Don't forget to hit the like/follow button if you feel like this post deserves it ;)
That's the best way to support me and help pushing this content to other users.
Kindly,
Phil
German DAX Eyeing 14k-15k - Elliott wave AnalysisHello traders, and welcome to a new daily update regarding the German DAX.
On the Weekly time frame of DAX we see price trading in a nice and clear impulsive and bullish sequence up from 2009. We can see a nice five-wave movement up from the lows, with final wave (V) of a higher degree in play which can in weeks and months ahead take price towards the 14000-15000 region.
Now switching to the Daily time frame, where we see price trading in a contracting and sideways correction, which can be labelled as a higher degree sub-wave IV. This correction is known as a triangle, which is a continuation pattern and moves into the direction of the trend( in our case to the upside). Triangles also unfold prior to the final move within a cycle, meaning once this triangle fully unravels a new rally above 13600 as sub-wave V of (V) may follow. That said, a the moment we see leg D of a triangle in play, that can look for resistance near the upper triangle line.
Thank you, and take care.
Cheers!

Impulsive DAX sell off is early sign of trend reversalPrice potentially heading towards 12600 in the future because of major sell off within this bullish structure.
As I always mention, those are scenario's.
Without a stop loss, take profit, risk reward and proper position sizing there's no reason to get it. It's just a market prediction.
In this case, price didn't even got to the price where I want it to be, reject, and then drop off. So it no more then a view, no analysis, no trade setup, always keep that in mind.
So, I see a potential Head and Shoulders pattern forming up on the top of this upward move, with a potential break to the downside.

10Year German Yields : A Scenario to profit from QE endingHope this idea will inspire some of you !
Don't forget to hit the like/follow button if you feel like this post deserves it ;)
That's the best way to support me and help pushing this content to other users.
If you want to see my chart more closely, click the share button below that video.. You will be able to have access to the chart used in that video.
Indicators used in this forecast are PRO Sinewave BETA & PRO Momentum .
You can check my indicators via my TradingView's Profile : @PRO_Indicators
If you have questions about the topics discussed in that video post a comment with "@PRO_Indicators" handle.
Kindly,
Phil
If you want to learn more about the basic rules to trade with my indicators here's the educational video link :

Nice Trend Channel for a German Bank Since April 2017 the Chart showes a nice upward Trend Channel. The value is at the moment close to the base line. So there is enough space to follow the channel ;-)

Top & DropGood Morning Traders. Daxi With great force, but not for long. We will watch for short entry sooner then later. watch the EURO. when it turns thats Bearish signal for DAXI.
Drive Safe.

German DAX Trading Into Potential Reversal ZonesGerman Dax is finally breaking out of a fourth wave triangle, now in fifth wave so there is room for a move up to 12910/12950 region, where market may find a temporary resistance and send price south in three waves. We see some important Fibonacci ratios at the mentioned region that can react as turning point zones. A later minor five-wave drop and a break below the channel line would indicate a change in trend.
Disclosure: Please be informed that information we provide is NOT a trading recommendation or investment advice. All our work is for educational purposes only.

LongGreen Area buy region once rejection is seen. Will be adding long in green zone. Risk to reqard not decided yet. Will keep post later, once prices are near the green zone. Trade with care.

What A DAY ?? !!Hi traders. i hope today was profitable. its was great trading day. very classic.
look how nicely fibs level help us find targets.
enjoy the rest of the day. you sure earned it.
See you on the next ride !

DAX - More downside to comeThe DAX has clearly broken its March rally in April, with lower highs proof of growing sellers. The break through of the blue support line indicates a lack of buyers, and this morning it switched from support to resistance.

SGL CARBON GERMAN STOCK WITH 30% POTENTIALI pulled the trigger on this german stock. I am seeing very good potential in it.
After a multiyear downtrend which took it from 40€ to 8€ i believe we might be in for a correction, normally i dont like to pick bottoms, but this is a tasty R:R and the fundamentals are also increasingly promising.
+SGL Carbon was finally able to sell the final part of its losing operations. Leaving now more funds, to concentrate on its profitable segment.
+VW, BMW and SKion, have over the last year became big shareholders/investors in this company. They possess together about 45% of SGL Carbons shares and they have been constantly adding more.
+Societe General yesterday changed their outlook for the share price, they are now seeing 12€ per stock as fair value for SGL Carbon.
Now to the technical part:
We have a big bottom being formed since the beginning of 2016. One can see a potential double bottom.
The major multimonth trendline, is a very important line that market participants were testing several times.
Bulls managed to make a textbook bullish outside bar, enveloping the previous 5 weekly bars, this is chart technically speaking a bullish signal.
One can see on the daily chart a more detailed view of the current situation.
I am personally long since 8.45€ looking for this move to extend to 11€ midterm, but this is not a buy recommandations its just a view i have on this stock.
It might as well fall, no one knows for sure. My stop is currently placed at 7.90€.
I think dips toward 8.30 are a good buying opportunity with a stop below 8€.
Please use decent risk management and dont risk too much on one trade.
Finally, thanks for reading all this.
Blessings to you all.

DAX DAY TRADE System - SHORTSHORT @ Xetra Open - Stop Loss 0,9% - Close = Xetra Close 17:35 Uhr
Happy Trading

Morphosys AG Longafter a long correction we can se an breakout with EMA50 Support.
Could be good chance to buy. Target over 60€
