Germanindex


Allianz touching resistence line, might shoot upHi guys! This is my first published chart. As you can see it is touching the resistence line so the price could go up in the future.
Things to consider:
the exponential moving average shows that the price is below the line
RSI is decreasing
Volume decreasing constantly
If the trend reverts the target will be 230.

DAX: Sell opportunity within the Channel Up.DAX is trading within a 1D Channel Up since early November. At the moment the price is next to the Higher High trend line, which is technically an optimal sell entry assuming the pattern holds. With the RSI also at the top of its 2 month consolidation channel, we treat this as a strong medium term sell opportunity. Our Target Zone is 13,165 - 13,100.
** If you like our free content follow our profile (www.tradingview.com) to get more daily ideas. **
Comments and likes are greatly appreciated.

DAX30 CFD bears have advantage on their side below 13,200 pointsWith the economic calendar being thin into the start of the week, today we will look at the DAX30 CFD from a technical perspective.
After the drop below 13,000 points in the first half of last week, the German index recovered slightly into the weekly close. However, the bears have the advantage on their side as long as we trade below 13,180/200 points.
Below that level, another attempt to sustainably break below 13,000 points stays on the table, while a drop below the pre-weekly lows around 12,930 points activates the region around 12,800/830 points.
On the other hand: if bulls can recapture 13,180/200 (a move that may be induced by new trade dispute optimism), a move up to and above 13,300 points is an option, erasing most of the losses from last Monday.
Ready to start trading the live markets? Then open a free account with Admiral Markets - 8,000+ instruments to choose from, some of the market's tightest typical spreads, and the world's #1 multi-asset trading platform. www.admiralmarkets.com
Disclaimer: CFDs are complex instruments and come with a high risk of losing money rapidly due to leverage. 76% of retail investor accounts lose money when trading CFDs with this provider. You should consider whether you understand how CFDs work and whether you can afford to take the high risk of losing your money.

Elevated volatility in the DAX30 CFD into the start of the week?While the last week of trading primarily saw subdued volatility in the DAX30 CFD, this will likely change as we start this trading week.
Technically, the German index continues to trade sideways between 13,100 and 13,300 points. Due to its proximity to the 13,300 region, it is generally more likely to get to see a break on the upside, with a first potential target being seen around 13,370 / 13,400 points.
A break higher could be initiated by the upcoming US ISM manufacturing figures, which are due at 3 pm GMT. A better-than-expected dataset could initially dampen recession concerns for the world's largest economy. A lower-than-expected data set could, on the other hand, fuel speculation that a more dovish approach by the Fed at the policy meeting on December 11 would be more likely.
Or to put it another way: the DAX could be off to a win-win in the start of the week.
On the flip side, however, there is also the danger of a renewed escalation in the US-Chinese trade conflict, after US President Trump signed a Legislation Bill on developments in Hong Kong during the night from last Wednesday to Thursday.
The resulting support for Hong Kong and clear US position against China could spark a response from the Chinese that China could for the time being fail the current Phase 1 trade talks and put the DAX under pressure.
This would then put the region around 13,100 into focus and below the area around 13,040 / 050 points at the center of the action.
Ready to start trading the live markets? Then open a free account with Admiral Markets - 8,000+ instruments to choose from, some of the market's tightest typical spreads, and the world's #1 multi-asset trading platform. www.admiralmarkets.com
Disclaimer: CFDs are complex instruments and come with a high risk of losing money rapidly due to leverage. 76% of retail investor accounts lose money when trading CFDs with this provider. You should consider whether you understand how CFDs work and whether you can afford to take the high risk of losing your money.

#DAX is the Pullback coming this Week? #DE30EUR #GER30 The German Stock Index had a phenomenal uprise since the break of resistance around 12475, but at some time every Party has to at least close for a few hours to clean up the mess.
German Stocks where pushing strongs with gains about 10% - 20% across the board and the whole market has positioned itself in overbought territory where Profit taking will come into play to start some kind of Pullback.
Positioning your Risk Management with much breathing room above 12950 gives you a good Risk-Reward Setup to place yourself in the bearish Pullback Camp.
Pullback Targets
=============
1. Target: 12620 / Retest of Daily 20-EMA / 0.236 Fib Retracement
2. Target: 12450 / Retest of Daily 26 or even 50-EMA / 0.382 - 0.5 Retracement
Daily Stochastic is still in the Bullish Control Zone which did not gave you any Signal to be overall bearish on the Daily Chart and the Daily RSI is above 65 with a huge divergence from the EMA
Have your stops in place and trade safe!
===========================
You can copy and follow my Trades on eToro
www.etoro.com
===========================
#DAX #DAXPERFORMANCE #DAXTRADING #TECHNICALANALYSIS #GER30 #DE30 $DAX $GER30 $DE30 #GERMANINDEX #DEUTSCHERAKTIENINDEX #DE30EUR

DAX: One last bullish leg towards 13,000.DAX has been very bullish throughout October rising from the near 11,800 low to a 12,800 high today which is in fact a peak for 2019. This is all within the Channel Up pattern on 1W (RSI = 59.041, MACD = 182.700, Highs/Lows = 304.9427) that has been in effect since February.
As you see the two dominant bullish legs are very similar, the one from February to May and August to today: Phase 1 (circle) is a volatile Higher Low, then phase 2 (blue rotated rectangle) the first major pull back and lastly phase 3 (green rectangle) the last minor pull back before the Higher High.
Assuming that the rise on the current bullish leg will be symmetrical (+14.60%) then we have calculated the final Target Zone within 12,950 - 13,080. Long term traders though may wait for a safer larger pull back around 12,100 before buying, again as it happened in May.
** If you like our free content follow our profile (www.tradingview.com) to get more daily ideas. **
Comments and likes are greatly appreciated.

#GER30 #DAX #DAXINDEX #Trading Outlook; where are we heading to?Dax has opened on monday morning with a expected pullback Move, but how far will it retrace or will it go sideways?
Daily stoch and daily RSI are telling us since many days that past uprun is running into exhaustion as the oscillators are turning down starting to leave high levels.
We have major key levels that we can easily watch and manage our Risk From without being attached to any economic bias.
On a makro view a possible bullish perspective key level to watch is the major lower trendline. A Break of it would give first insights that makro upward trajectory is totally broken.
But until this happen Dax Index has given us in the past many opportunities to play Fibonacci Retracements to the Upside.
The current Dax Posture tells us not to blindly short the Market it is rather telling us to derisk Any Long Trades and lock in Profits which you might gained during this Year and derisk your Stocks (especially DAX Participants).
Also What gives the Dax a higher probability to go Sideways or decline with a slow pace is that many Dax Stocks have already had their major declines over the past weeks and Months and playing some kind of bounces trying to find buyers but according to current Dax Posture I also would not say that we will not see some lower major german stock prices.
Anyway shorting with prices trading with a rather narrow range to the daily 200EMA and daily 200SMA is not the Trade i am personally looking for.
If you are asking yourself which Fibonacci Retracement Level will be the best to manage your Risk of i can tell you following.
Looking at the daily RSI we are nowhere near any long entries on DAX and personally i am not allocating any eurocent to German Companies at this high Oszillator Levels.
Looking at the past i want to the RSI go back to 0.618 or 0.786 Levels which would go in confluence with chart prices and chart Fibonacci levels around 0.382, 0.5 or even as low as 0.618.
Choose your entries wisely and trade safe!

Bearish Head & Shoulders on $DAXBearish Head & Shoulders on $DAX
This is a representation of the German economy,
like the $DJI for the US economy.
Price is currently holding at the trend line support.
A break below would be a continuation of a downtrend
caused by such a pattern.
see more at: cryptoplanet.cash
instagram: www.instagram.com
telegram chat: bit.ly

GER.IDX/EUR 4H Chart: Bounces off support clusterThe DEU.IDX/EUR pair has been trading in a junior ascending channel pattern since June. The pair bounced off the bottom border of the channel pattern at 11616.2 on June 3.
The German 30 index made a pullback south from a resistance level at 12571.5 during yesterday's trading session.
Currently, the pair is testing a support cluster formed by the 50– and 200-hour SMAs at 12402.4.
If the cluster holds, the GER/IDX/EUR pair will continue its movement in the junior ascending channel pattern during the following trading sessions.

Dax daily: 12 Jul 2019 This is the last analysis of the week. As expected, Dax initially declined yesterday and closed the gap. Buyers entered at our support but didn't last long. After some 35 points, buyers were overpowered by sellers again. Following was a retest of 12 328 level which was broken out by some 16 points before buyers flexed their muscles. Today we open with an ascending gap, which is already closed at the time we write this.
Important zones
Resistance: 12 500
Support: 12 291
Statistics for today
Detailed statistics in the Statistical Application
Macroeconomic releases
NIL
Today's session hypothesis
After today's open, Dax started its downward momentum quite strongly. The first hour already has a range of some 60 points, which is unusual. Beware of some trend reversal signals. We have a nice support zone a 12 290 where we might find some buyers. In any way, it's better to be less aggressive in the long direction today.

Dax daily: 02 Jul 2019 The resistance zone at 12 601 we mentioned yesterday turned out to function perfectly. After retesting the 12 601 level, Dax went sloping down. The weekend gap has been filled from it's third only and today the price opens without a gap.
Important zones
Resistance: NIL
Support: 12 385, 12 428, 12 508
Statistics for today
Detailed statistics in the Statistical Application
Macroeconomic releases
NIL
Today's session hypothesis
There are quite a few support zones today, yet no resistance. The magnet on the lower prices is still 12 385. On the way down, buyers could enter around 12 428 and 12 385. The support zone at 12 508 could function as a bumper to head for further higher levels. At 12 428, we might see a correction, whereas the 12 385 level might function as a reversal signal. Thanks to a good distance towards 12 385, this hypothesis can be a multiple-day plan.


kcell jsc reg.shs:Being consolidated within "3.63 & 4.66"channelkcell jsc reg.shs:Being consolidated within "3.63 & 4.66"channel ,High stabilization of the above mentioned channel Triggers a bullish trend.
In general, low risk is evaluated
.
. Target 1: 7.12
. Target 2 : 9.24


DAX Germany30 Index Short OpportunityRising wedge with bearish divergence, entry at 12310/12320, minimum target 12.134 stop above 12354

DAX: A quarterly overview.We have seen the current trading set up on DAX during its previous mini bear cycle (April 2015 - February 2016). During that time the index finally broke upwards for the new mini bull cycle once both Lower High trend lines were crossed and held as supports on at least 1 re-test.
Currently DAX has broken above the first Lower High trend line (dashed) and has already re-tested it as a support once. Based on the 2015-2016 pattern, one more (lower) test is due and on a quarterly basis this is not unrealistic as the macroeconomic fundamentals have disappointed (PMI, Sales ect) raising economic growth concerns. The market needs some time to digest these data and re-balance the dynamics.
Once the upper (bold) trend line breaks and re-tested as support, then the new bull cycle will most likely begin. This perspective suits the needs for long term investors who seek safe and reliable buy entries not for daily traders.
** If you like our free content follow our profile (www.tradingview.com) to get more daily ideas. **
Comments and likes are greatly appreciated.

German Rally Exhaustion 1. Broke through rising wedge
2. RSI Bearish Divergence
3. Good RR.
**Wait for retracement to zone.

Some LongHi traders
Daxi In BUY zone
11650 as first target
BUT
if SPX does go GARTLEY, then dax will follow to 11700 ( 61.8% fib )
LOOK @ DMI - always turn point when BULL vs BEAR are far away
(bottom indicator)
Drive safe

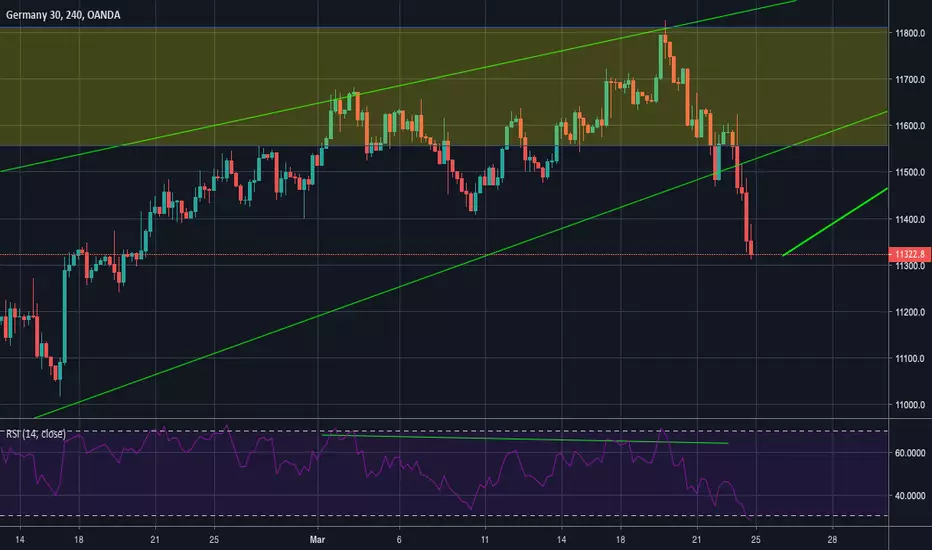
DAX: Sell opportunity on 1D.The index is still on a long term recovery within the 1D Channel Up (RSI = 58.547, MACD = 106.300, Highs/Lows = 0.0000). This time however 4H is on a Lower High sequence with 11,400 supporting this fragile set up. With the price already rejected just below the 11,686 - 11,838 1W Resistance Zone, we are expecting a stronger correction if 11,400 breaks. TP1 = 11,250, TP2 = 11,000.
** If you like our free content follow our profile (www.tradingview.com) to get more daily ideas. **
Comments and likes are greatly appreciated.

The bull is around the corner (DAX)Let the chart speak for itself.
This is NOT financial advice.
/onefouronetrading
