Daily MailiGood morning Daxers. Daily chart. Lets watch the Monster.
I'll look for some retrace before complete this 5 wave up.
Drive Safe.
Germanindex

DAX H&STake a look at DAX weekly chart. 11900 is a very strong support, on which the price bounced back multiple times. Are we going to see an head and shoulders pattern? We alredy have the first two elements. Now we need the right shoulder.


Monthly uptrend and demand level in control on German DAX 30Monthly uptrend on German DAX 30 index. Monthly demand level in control. Longs at new D1 and H4 demand levels. Shorts could happen if monthly demand zone is eliminated

BUY DAX 4HBuying opportunity on DAX30. Trend continuation. Level of support RSI oversold. Market overextended. Bullish on EU Equities until QE ends. Good Luck

DAX - DAILY - BUY SETUPDax - Daily time frame. I see a great buy setup on Dax for a quick 300-500 points move to the upside. Reason for the buy call is purely price action and simple technical analysis.

Top & DropGood Morning Traders. Daxi With great force, but not for long. We will watch for short entry sooner then later. watch the EURO. when it turns thats Bearish signal for DAXI.
Drive Safe.

Wait for a higher level to short. '13050 and 130100'Dax has broken its legendary support zone a few days back and now it is retracing upwards.
I would wait for the price to a little higher and go short around 13050.
levels to watch 13050. 13100.

DAX price projection up to 13715DAX is expected to cross the red trendline tomorrow Tuesday, December 12th; Most probably by a gap up open above it.
This will confirm a new bullish price projection up to 13715 and an euphoric Christmas rally to a final peak!
SP500daytrader

Xmas rally if we close the week above above 13127.5Unless we close the weekly bar below 13127.5
X-mas rally is on and new price projection is 13577
sp500daytrader


WobbelingGood morning Traders.
Dax Wall is marked. Break up Or Down ?
Euro strength and Us retrace will suggest we go DOWN.
Drive Safe.

Germany Dax DE30 Daily Update (21/11/17)13250 resistance zone
But..
Candle is still pretty bullish.
wait for a small consolidation with rejection candle before taking a short.
Do note, it is a counter-trend trade, the structure is still very bullish.
Disclaimer:
The information contained in this presentation is solely for educational purposes and does not constitute investment advice.
The risk of trading in securities markets can be substantial. You should carefully consider if engaging in such activity is suitable for your own financial situation.
SonicR Mastery team is not responsible for any liabilities arising from the result of your market involvement or individual trade activities

DE30/EUR 1D Chart: Rebound from 55-day SMADE30/EUR 1D Chart: Rebound from 55-day SMA
The index that compiles 30 largest German companies is advancing against the Euro in the long-term rising wedge formation. This pattern started to form two years ago and today consists of two reaction highs and three reaction lows. Consequently, the breakout of the pattern is expected to happen in the Q2 2018.
In the meantime, in the middle of this year the exchange rate started to form new junior ascending channel but due to support provided by the 55-day SMA it began to transform into another rising wedge. As the northern side contains no notable obstacles, the pair is expected to continue climbing to the top, thus ending the year near the 13,600 level. In case of sudden reversal, the above moving average should prevent the pair from making a premature breakout.

Dax - day viewTwo possible scenario for DAX.
We closed two gap.
Retest last high and continuation bullish scenario (blue arrows).
Or we will break the minimum of the last week and continue moving down (pink arrows).
Let`s see.
I will comment on the idea, as events unfold.
Thank you for your attention.

German Stocks Index DAX at Major Resistance of 13000 !!!Initiating a Short Position in DAX on daily chart off a major resistance a level with great Reward to Risk ratio of 3!

DAX 30 German Index longs at weekly demandDAX 30 German Index breaking all time highs. Pausing on the weekly timeframe before a breaks out to create a potential weekly demand level on the way up if the second leg is created
New weekly demand zones created on the way up. Longs at weekly demand zones

GER 30 BUY SETUP GER30 we have head and shoulders pattern buy if breakout targets on the chart
sl below the head 11900.00
thanks for attantion if you agree put the finger up it will be big support for me

LongGreen Area buy region once rejection is seen. Will be adding long in green zone. Risk to reqard not decided yet. Will keep post later, once prices are near the green zone. Trade with care.

DAX intradayintraday possible scenario for DAX
Potential targets on the chart.
Alternative scenario on the chart.
Let`s see.
I will comment on the idea, as events unfold.
High risk trade!
Thank you for your attention.

DAX intraday viewintraday two possible scenarios for DAX
Let`s see.
I will comment on the idea, as events unfold.
High risk trade!
Thank you for your attention.

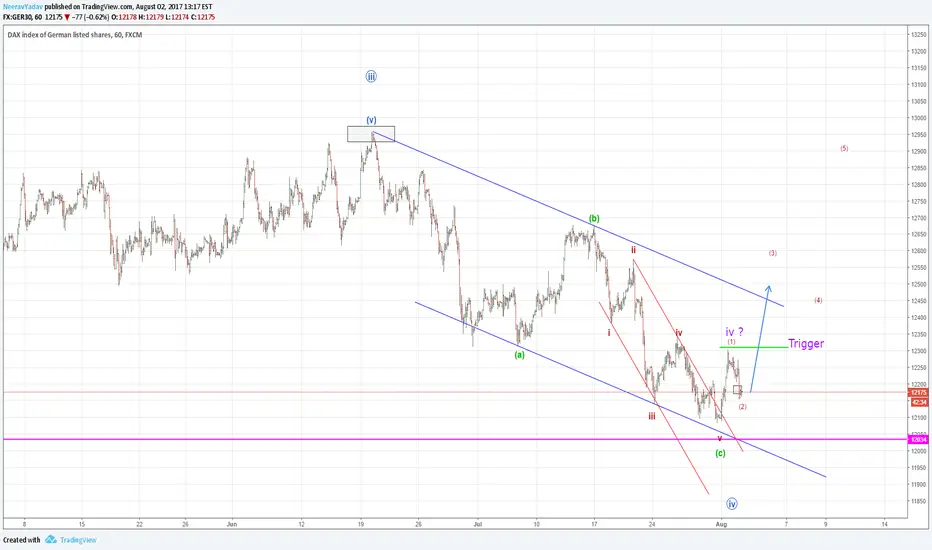
German Markets DAX 30 to head higher (Elliott Wave Analysis)It looks like DAX 30 (German Index) has just completed an A-B-C corrective Wave 4 (The circled Blue Wave iv) and hence we can expect good upside in the coming sessions.
From an alternate perspective it is also possible that the Wave iv of Wave (c) is still continuing as a Triangle or some other corrective structure, hence it would be best to look for longs only after the break of the Green Trigger line 12308 level to the upside.
The exact confirmation of the new leg up will only come after the break of the Blue upper channel line.
Even if the Wave iv (Blue circled) is continuing as a Flat, we still have a good trade setup here to look for longs untill atleast the all time highs of 12960.
I will update further as this market continues.
DAX intraday viewintraday possible scenario for DAX
Let`s see.
I will comment on the idea, as events unfold.
High risk trade!
Thank you for your attention.
