Guess?, Inc. Reports Fiscal Year 2025 Fourth Quarter ResultsGuess?, Inc. (NYSE: NYSE:GES ) a company that designs, markets, distributes, and licenses lifestyle collections of apparel and accessories for men, women, and children- operating through five segments: Americas Retail, Americas Wholesale, Europe, Asia, and Licensing, reports fiscal year 2025 fourth quarter results.
Reports Highlights
Fourth Quarter Fiscal 2025 Results:
Revenues Increased to $932 Million, Up 5% in U.S. Dollars and 9% in Constant Currency
Delivered Operating Margin of 11.1%; Adjusted Operating Margin of 11.4%
GAAP EPS of $1.16 and Adjusted EPS of $1.48.
Full Fiscal Year 2025 Results:
Revenues Increased to $3.0 Billion, Up 8% in U.S. Dollars and 10% in Constant Currency
Delivered Operating Margin of 5.8%; Adjusted Operating Margin of 6.0%
GAAP EPS of $0.77 and Adjusted EPS of $1.96
Full Fiscal Year 2026 Outlook:
Expects Revenue Increase between 3.9% and 6.2% in U.S. Dollars
Expects GAAP and Adjusted Operating Margins between 4.3% and 5.2% and 4.5% and 5.4%, Respectively
Expects GAAP EPS between $1.03 and $1.37 and Adjusted EPS between $1.32 and $1.76
Plans to Execute Business and Portfolio Optimization Expected to Unlock Approximately $30 Million in Operating Profit in Fiscal Year 2027
Financial Performance
In 2024, Guess?'s revenue was $3.00 billion, an increase of 7.88% compared to the previous year's $2.78 billion. Earnings were $60.42 million, a decrease of -69.15%.
Analyst Forecast
According to 5 analysts, the average rating for GES stock is "Strong Buy." The 12-month stock price forecast is $21.6, which is an increase of 115.14% from the latest price.
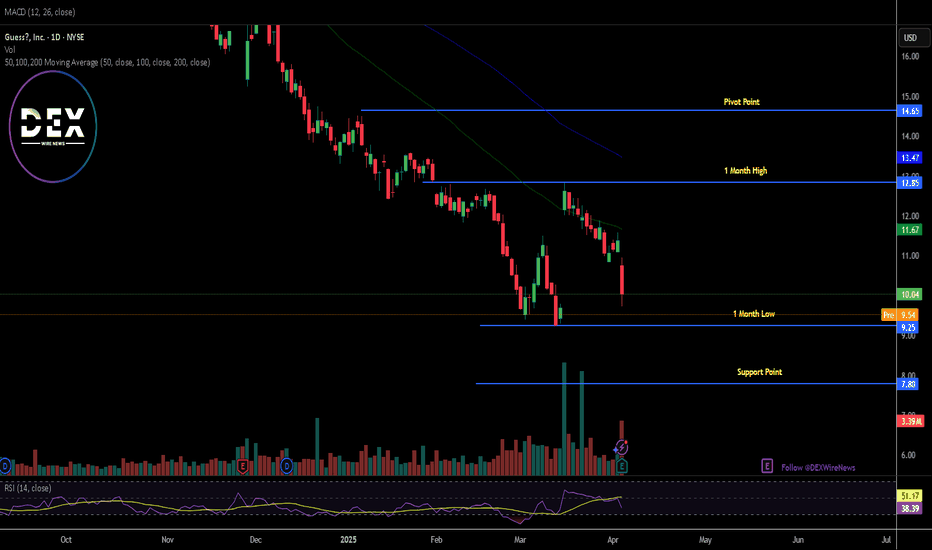
As of the time of writing, NYSE:GES shares closed Thursday's session down 11.78% extending the loss to Friday's premarket trading down by 2.38%. With a weaker RSI of 38, should trades open, NYSE:GES shares might break the 1-month low pivot and dip to the $7 support point. About $2.85 trillion was wiped out from the US stock market yesterday.
GES
GES Guess? Options Ahead of EarningsIf you haven`t sold GES before the previous earnings:
Then analyzing the options chain and the chart patterns of GES Guess? prior to the earnings report this week,
I would consider purchasing the 26usd strike price in the money Puts with
an expiration date of 2024-4-19,
for a premium of approximately $2.72.
If these options prove to be profitable prior to the earnings release, I would sell at least half of them.
GES Guess? Options Ahead of EarningsAnalyzing the options chain and the chart patterns of GES Guess? prior to the earnings report this week,
I would consider purchasing the 23usd strike price at the money Puts with
an expiration date of 2023-12-15,
for a premium of approximately $1.82.
If these options prove to be profitable prior to the earnings release, I would sell at least half of them.
Looking forward to read your opinion about it.
GES Guess? Options Ahead of EarningsAnalyzing the options chain and the chart patterns of GES Guess? prior to the earnings report this week,
I would consider purchasing the 19usd strike price Puts with
an expiration date of 2023-10-20,
for a premium of approximately $1.07.
If these options prove to be profitable prior to the earnings release, I would sell at least half of them.
Looking forward to read your opinion about it.
Long Kss if market rallyKohls has been a pretty good stock, they have expended last year and improved their overall brand in the process.
they took a huge beating with last earning and weak forecast but on the daily time frame, they are really bottoming out.
i think it's ready to rebound soon, especially if we start the bull run pass $300 on spy, this would be a good long shot.
Open position at $46.25
Stop loss at $45.25
Take profit at 49+ 2% trailing stoploss
The Breakaway Gap speak for itselfThis is the classic Chart Patterns you can watch in the Textbooks
My intention is not to try to convince you using sophisticated Indicators and a lot complicated financial jargon.
But here's the explanation:
First look the Support at the end of 2008 around 10.20 then go to the now exactly 2017/05/22 and again make a Support around 10.20
Then go to this date August 23 2017 and look the Daily Chart and identify the Full Gap between the close and the open this was a 16% Gap. This is called a Breakaway Gap
Then the price make some rally and now is consolidating between 15.20 and 17.40 and is forming a recognizable pattern
(The name of the Pattern do not care you only need to recognize and act in consequently with the price)
This is the now. you understand me.
The Analysis always start from a Weekly Chart and then I use the Daily Chart To be more precise
My Stock Picks are For Long Term Investors and The Fundamentals research are your responsibility the same thing is for the Position sizing and the Stop Loss
I'm just an analyst I not a Trader.
Here you can make your Fundamentals research:
www.marketbeat.com
Additional Material for learning about the Gap:
www.investopedia.com
stockcharts.com


