Jade Lizard on PLTR - My 53DTE Summer Theta PlayMany of you — and yes, I see you in my DMs 😄 — are trading PLTR, whether using LEAPS, wheeling, or covered calls.
I took a closer look. And guess what?
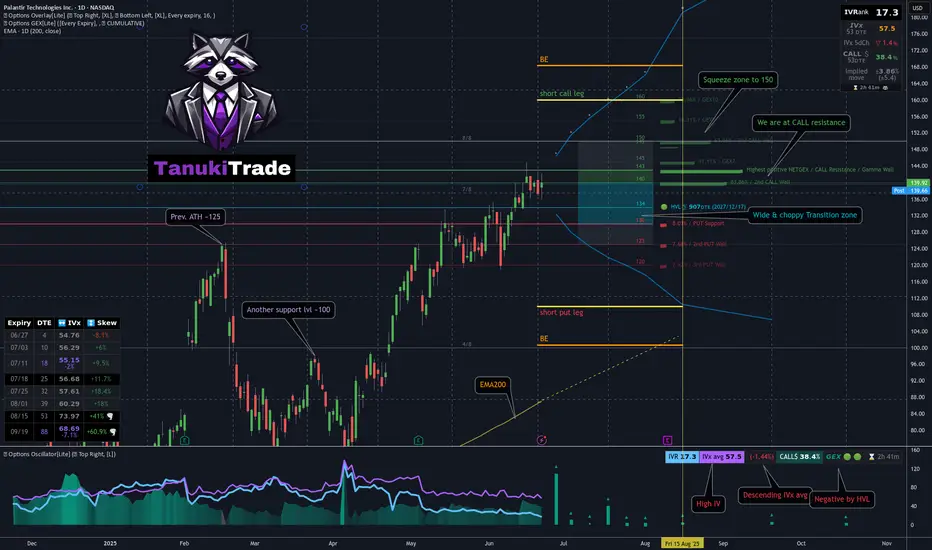
📈 After a strong move higher, PLTR was rejected right at the $143 call wall — pretty much all cumulative expiries cluster resistance there
Using the GEX Profile indicator, scanning all expirations:
After a brief dip, the market is repositioning bullish
Squeeze zone extends up to 150
The most distant GEX level is sitting at 160
On the downside, 130 is firm support, with some presence even at 120 — the market isn’t pricing in much risk below that
📉 From a technical standpoint:
We’re near all-time highs
125 (previous ATH) and 100 are key support levels
The OTM delta curve through August is wide, and the call side is paying well — with a current call pricing skew
🔬 IVx is at 57, trending lower + call pricing skew📉 IV Rank isn't particularly high, but the directional IVx matters more here
💡 Summer Theta Play: Jade Lizard on PLTR
Since I’ll be traveling this summer and don’t want to micromanage trades, I looked for something low-touch and high-confidence — and revisited an old favorite: the Jade Lizard.
If you're not familiar with the strategy, I recommend checking out Tastytrade's links and videos on Jade Lizards.
🔹 Why this setup?
Breakeven sits near $100, even with no management
On TastyTrade margin:~$1800 initial margin ~$830 max profit
53 DTE — plenty of time for theta to work
Earnings hit in August — I plan to close before then
Covers all bullish GEX resistance zones
Quickly turns profitable if IV doesn’t spike
Highly adjustable if needed
My conclusion: this strategy covers a much broader range than what the current GEX Profile shows across all expirations — so by my standards, I consider this to be a relatively lower-risk setup compared to most other symbols right now with similar theta strategies.
🔧 How would I adjust if needed?
If price moves up:
I’d roll the short put up to collect additional credit
Hold the call vertical as long as the curve supports it
If price drops:
Transition into a put ratio spread
Either extend or remove the call vertical depending on conditions
🛑 What’s the cut loss plan?
I have about 20% wiggle room on the upside, so I’m not too worried — but if price rips through 160 quickly, I’ll have to consider early closure.
If that happens, the decision depends on time:
If late in the cycle with low DTE:→ Take a small loss & roll out to next month for credit
If early with lots of DTE remaining:→ Consider converting to a butterfly, pushing out the call vertical for a small debit→ Offset this with credit from rolling the put upward
As always — stay sharp, manage your risk, and may the profit be with you.
See you next week!– Greg @ TanukiTrade
GEX
06/30 Weekly Gamma Exposure Outlook🧠 SPX Weekly Outlook — Gamma Breakout + Short Week Setup
The bulls finally broke through after weeks of painful grinding — and they did so with force.
📈 Thursday & Friday brought a textbook gamma squeeze as SPX sliced through the long-standing 6100 call wall , triggering sharp upside acceleration.
We are now firmly in positive Net GEX territory.
🔺 Entire GEX structure has shifted higher.
🎯 New squeeze zone at 6225 , with major call resistance near 6200 .
🔍 What Just Happened?
📊 The 6060–6120 zone acted as a tough resistance range for weeks — until last week’s breakout.
💥 Put skew collapsed , suggesting downside hedges are being unwound.
📉 VIX and IV keep dropping , confirming a shift toward lower-volatility environment .
🧲 Strong Net GEX across expiries created sustained upward dealer pressure → we’re in long gamma mode .
✅ Bullish Bias — But Stay Tactical
We're in a bullish gamma regime , so dips are likely to be bought.
Key pullback zone to watch: 6125–6060 .
🛠️ Strategy Ideas:
• Wait for a 6060–6125 retest before re-entering longs
• Use shorter-DTE bull put spreads or 0DTE gamma scalps above 6130+
• Scale out or trim risk near 6200–6225
⚠️ Risks to Watch
We’re overextended short-term.
🚨 Losing 6130–6125 could spark a quick flush to 6050 .
Bearish signals to monitor:
• IV spike or renewed put buying
• Loss of 6100 = no-man’s land without confirmation
• Consider short-term debit put spreads if breakdown confirms
🗓️ Short Trading Week Note
🇺🇸 U.S. markets closed Friday, July 5 for Independence Day.
This compresses flows into 4 sessions. Expect:
📌 Early week dealer hedging
📌 Possible positioning unwind on Thursday
💡 Weekly Trade Idea — Structure in Place
💼 Setup:
• Put Butterfly below spot
• 3x Call Diagonal Spreads above spot (5pt wide)
• Slight net negative delta , 11 DTE
🎯 Why it works:
• Leverages IV backwardation
• Profits from time decay
• Favors a stable or modestly bullish week
• Takes advantage of horizontal skew (July 11 vs July 14)
💰 Profit Target: 10–20% return on ~$1,730 risk.
Take profits before time decay kills the center valley — don’t overstay. 🏃💨
📌 Final Thoughts:
The 6100 breakout was technically & gamma-structurally significant ,
but big moves often retest before continuing.
Let price breathe.
Stay aligned with gamma exposure profile. 🔄

[06/16] Weekly GEX Roadmap - Diagonal Spreads or Put Hedges?📊 Weekly GEX Map (SPX)
This week’s GEX profile looks nearly identical to last week:
Positive bias above 6020 up to 6100
But a sticky chop zone remains from 5975 to 6020
Below 5950? That’s where things get interesting…
⚠️ What Happens If 5950 Fails?
In that case - welcome to negative gamma territory:
Delta becomes unstable → fast, erratic moves
Gamma loses influence → hedging effectiveness drops
Dealer hedging lags → market makers chase, not lead
Vega + theta distort readings → charm decay accelerates
Result:
GEX zones lose clarity.
Pinning breaks down.
Reactions become nonlinear and emotional.
If we drop below 5950, we might see acceleration instead of stabilization — despite the positive GEX profile.
💡 Trade Idea of the Week – With Caution
If not for Wednesday's macro risk (Fed rate decision), I'd suggest a bullish diagonal spread toward 6100–6150:
Limited downside
Defined risk
Covers the full squeeze zone
But with FOMC looming, I'd only hold this trade until Thursday and close once the debit doubles or earlier.
🧨 Macro + Geo Risks
Fed is priced for “no move” → any surprise = volatility spike
Rising tensions with Iran → oil and futures could react violently
Recommendation : Avoid OIL this week, especially futures and naked strategies
🛡️ Prefer Downside Protection?
If you expect weakness on SPX weekly:
Consider a put debit spread with the short leg at 5950, where the second strongest Put Support sits.
This type of structure can offer up to 6:1 reward-to-risk, making it one of the most efficient bearish hedges for this week.
If you enjoyed the above breakdown, feel free to check out my previous weekly analyses or explore my tools as well.
Until next time – Trade what you see, not what you hope,
– Greg @ TanukiTrade

[06/09] [GEX] Weekly SPX OutlookLast week’s outlook played out quite well — as anticipated, SPX hit the 6000 level, closing exactly there on Friday. This was the realistic target we highlighted in last week's idea.
🔭 SPX: The Bigger Outlook
It's difficult to say whether the rising SPX trend will continue. We're still in the "90-day agreement period" set by the administration, and so far, the market has shown resilience, avoiding deeper pullbacks like the one we saw in April.
With VIX hovering around 17–18, we’ve reached a zone where further SPX upside would require volatility. For the index to continue rising meaningfully, it needs to reverse the current bearish macro environment, and that can only happen with strong buying momentum — not a slow grind.
The parallel downward channel drawn a few weeks ago is still technically valid. Even a short 100-point squeeze would fit within this structure before a larger move down unfolds.
GEX levels give us useful clues heading into Friday. We're currently in a net positive GEX zone across all expirations, giving bulls a structural advantage, just like last week.
As of Monday’s premarket, SPX spot is at 6009.The Gamma Flip zone is between 5975–5990, with a High Volume Level (HVL) at 5985.
🔍 Let’s zoom in with our GEX levels — this gives us a deeper view than our GEX Profile indicator for TradingView alone.
🐂 🟢 If SPX moves higher, the following are logical profit-taking zones:
6050 (Delta ≈ 33)
6075 (Delta ≈ 25)
6100 (Delta ≈ 17)
🎯 Targeting above 6100 currently feels irrational — for instance, the next major gamma squeeze zone is at 6150, but that corresponds to a delta 6 level (≈94% chance the price closes below it), so I won’t aim that high yet.
🐻🔴 In a bearish scenario:
5975 and 5950 are the first nearby support zones (Deltas 30 and 38).
If momentum picks up, 5900 becomes reachable quickly, even if it's technically a 17-delta distance — because that’s deep in the negative GEX zone.
📅 Don’t forget: On Wednesday premarket, we’ll get Core Inflation Rate data — a key macro risk that could shake things up, regardless of TSLA drama fading.
📌 SPX Weekly Trading Plan Conclusion
Whatever your bias, keep cheap downside hedges in place. We've been rising for a long time, and even if SPX breaks out of the descending channel temporarily, resistance and the gamma landscape may pull price back swiftly.

[GEX] TSLA Breakdown & Options Trade Idea for 39DTELast week, TSLA dropped hard, likely due to political tensions. Let’s not forget — just a month ago, their EVs were showcased at the White House entrance...
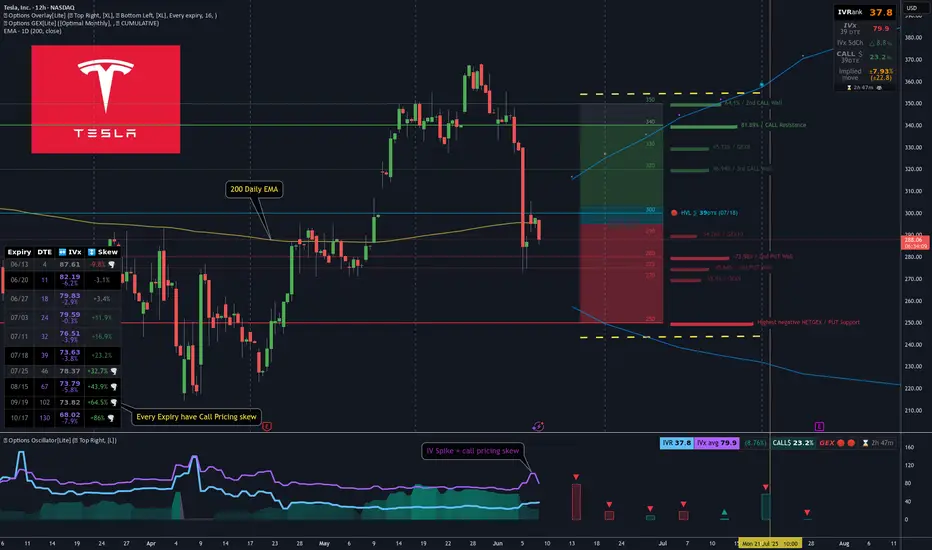
In the span of 30 hours, TSLA fell -22% (see red line below), while SPX barely reacted. Why? Because both realized and implied volatility dropped — remember VIX is around 17/18.
This sharp TSLA drop already seemed overdone, which helped fuel the +5% bounce on Friday.Most TSLA options positions are near-term and still show negative sentiment — but further expirations grow increasingly bullish.
🔍 If you use options GEX matrix , you’ll see the bearish hedging flow gradually turns more neutral-to-bullish.
Most cumulative support/resistance zones lie between 250–340, with spot currently just under the chop zone.
🧠 TSLA Trade Idea
It’s been a while since I posted a neutral Iron Condor, but TSLA might be an exception.
Despite last week’s IV spike, call pricing skew still dominates across expirations — as seen in our Options Overlay indicator.This tells me the market doesn’t fear TSLA crashing below 200. So, I’m aiming to capture premium on the July 18th expiry without day trading.
I’m thinking of something simple, well-manageable in either direction.To refine leg placement, I use visual GEX zones.
🐻🔴 Downside:
Strong put support at 250
Gradual support layers up to 280
🐂 🟢 Upside:
Target area: 340–350 for the July 18 expiry.
📅 Closing the Trade:I'll consider closing or adjusting at 21 DTE or when 50% max profit is hit — per TastyTrade’s studies.
🔁 Rolling Plan:IF short delta on one side drops below ~14 and price pulls away, I’ll roll the untested side to collect more credit.
🧑🏫 I’ll likely post trade management live in Discord for educational purposes.
~~~~~~~~~~~~~~~~~~~~~~~~~~~~~~~~~~~
🦋 Bonus Idea: TSLA Broken Wing Butterfly
If you think TSLA has more downside, a Put Broken Wing Butterfly — like the one shown in my previous YT video — is also a great way to structure this trade using the same GEX levels.
There’s no single way to use Gamma Exposure — it’s the most actionable hedging signal we have. Combine it with your knowledge of strategies and you can trade almost any scenario.
One thing’s for sure — this market moves faster than ever.A single day of internal conflict wiped -22% off TSLA…The next morning, the market already moved on, so as always:
Trade Safe Out There!
06/02 Weekly GEX Analysis - 6000 Looks EasyThe biggest event last week was undoubtedly the court ruling involving Trump. The market responded with optimism, and on Thursday premarket, SPX surged toward the 6000 level — only to get instantly rejected. That strong rejection suggests this is a firm resistance zone.
From the GEX expiry matrix, it's clear that the market is hedging upward for this week, but downward for next week. To me, this indicates that while the near-term GEX sentiment remains slightly bullish, the market may be preparing for a pullback or retest in the medium term.
This week, SPX has already entered a GEX zone surrounded by positive strikes — up to around the 6000 level. That makes 6000 an “easy target” for bulls, and we’ll likely see profit-taking here, just like we did last Thursday premarket.
⚠️ However, if we look more closely at the weekly net open interest:
...we can see a strong bullish net OI build-up starting to emerge around the 6100 level — a price zone that currently feels distant and even unreachable. But if the 6000 resistance breaks, we could see a fast gamma-driven squeeze up to 6050 and possibly 6100 before the next wave of profit-taking kicks in.
As is often the case during bullish moves, the market seems blind to the bigger picture — no one’s looking down, only up. The mood is greedy, and momentum favors the bulls... for now.
Never underestimate FOMO — but also never underestimate Trump. He’s unlikely to accept the court’s decision on tariffs quietly. Any new negative headline could shake the market, no matter where price is sitting…

[05/27] Weekly GEX Outlook for SPX⚠️ Unbalanced GEX & Institutional Hedging – A Closer Look
I haven’t seen such an asymmetric GEX setup in quite a while — and it’s definitely not a pretty one 😬. The current profile suggests a highly skewed positioning in the market:
📍 Massive upside expectation:
It feels like the market is almost exclusively preparing for a move toward 6000.
🛑 Limited downside protection:
Below the current level, there's very little hedging in place — especially unusual with Friday’s expiry approaching.
🔻 Current Key Zone: 5925-5930
The largest put open interest is sitting right around 5925, which is also close to spot.
Below that? Things get murky. The GEX profile becomes fragmented and mixed, with no clear put support until much lower.
Interestingly, most of the current downside hedging is clustered around the 5900–5925 range, which includes ITM puts — not OTM, as you’d typically expect from retail.
🧠 Institutional Footprint vs. Retail
This hedging pattern — closer to ATM rather than deep OTM — suggests institutional players are managing downside risk with precision.
In contrast, retail traders don’t seem to be actively hedging the downside with OTM puts, which is a notable shift from typical behavior in high-IV weeks like this.
🔼 What to Watch: The 5930 Breakout
If SPX can break and hold above 5930, it enters a clear, call-dominated zone.
From there, the path to 6000 looks much cleaner, with lighter resistance and the potential for a gamma-driven push 📈.
The details show the same picture when examining more details:
SPX conclusion
😬 In short: we’re at a tipping point.
Below 5900, hedging is tactical and institutional.
Above 5900, the path is open to 6000 — but only if bulls can take control at 5930!

NVDA GEX Earnings Outlook by OptionsNVDA reports earnings this Wednesday, and it’s a big deal. A major move could impact both the indexes and broader tech sector.
The OTM 16 delta curve essentially overlaps with both the GEX profile and the expected probability zone — signaling strong confluence.
📈 Rising IV with falling call skew: Volatility is rising into earnings, while the call skew is dropping — a sign of growing interest in downside hedging/speculation.
🔷 Key inflection zone (129): Above 129, the market is unlikely to surprise. Below it, however, a domino effect could trigger increased volatility and put-side flows.
Implied move into earnings is 6.62%, reflecting binary risk expectations from the options market.
Strong gamma squeeze territory exists between 140–145, with significant call wall buildup around 140.
The nearest expiry shows a positive net GEX — supporting short-term mean-reversion or hedging flow stability above 129, at least until the earnings print.
🔴 Downside risk scenario:
In the event of a downward move, the market is most heavily hedged around the 125 level, which aligns with the deepest put support.
💡 Wheeling Opportunity Idea
ONLY IF you want to own NVDA long-term around the $130 level (even if it drops short/mid-term), this might be a great time to start the wheeling strategy.
Because earnings inflate volatility, you can sell a near-term cash-secured put (CSP) for solid premium — even on a 53DTE (July) option.
Based on current GEX levels, we’re seeing:
-Support (squeeze zone) around $125
-Call resistance around $140
-A potential upside squeeze extending to $145-$150
These align roughly with ~20 delta OTM options, so the premium is attractive.
How would I personally start this:
Sell a CSP for May 30 with the intention to get assigned if NVDA drops.
If I do get assigned, I’m happy to own shares.
Then, I sell a 60DTE covered call right after to collect another round of premium.
If I’m not assigned, I sell a new 45–60DTE put the following week — still benefiting from the relatively high IV.
👉 Remember: High IV = synthetic time value. With this two-step method, you can harvest premium twice in quick succession.
I used the same technique with NASDAQ:INTC , and it’s been performing well.
💥 ONLY IF you want to own NVDA long-term around the $130 level (even if it drops short/mid-term)!

[𝟬𝟱/𝟭𝟮] 𝗪𝗲𝗲𝗸𝗹𝘆 𝗦𝗣𝗫 𝗚𝗘𝗫 𝗣𝗹𝗮𝘆𝗯𝗼𝗼𝗸🔍 IF/THEN QUICK GAMMA PLAYBOOK
IF > 5825 THEN path to 5900 → stall/profit-taking likely
IF > 5900 THEN path to first 5950, then 6000 → gamma squeeze extension zone
IF < 5825 THEN path to 5700 → test of transition zone support
Chop Zone: — re-entry = short-term balance/testing zone
IF < 5700 THEN path to 5500 → gamma flush / dealer unwind risk
🧭 𝗘𝗫𝗧𝗘𝗡𝗗𝗘𝗗 𝗭𝗢𝗡𝗘 𝗠𝗔𝗣/b]
✅ Gamma Flip Level
5700 → This is the confirmed Gamma Flip level = High Volatility Zone = HVL. We are comfortably above it, confirming positive gamma environment.
🧱 Major Call Walls / Resistance to upside from here
5900 → Significant call resistance zone (highlighted across GEX, profile, and /matrix command). 5825–5900 = Current rally zone → expected stall at 5900 (Profit-taking zone)5950 → Next mid-large positive gamma wall to the upside, mid-station between mounts. Dealers short gamma, adding fuel to breakout.6000 → Positive Gamma squeeze continuation target. Gamma squeeze intensifies → likely extends to 6000.🟦 Transition / Chop Zone
5700–5825 → Previous chop range. Retrace could test this before renewed upside.Currently outside and breaking up from this zone, indicating trend initiation.
Balance zone from prior structure.
Expect fade setups if price dips back in.
Needs catalyst or strong sell flow to re-enter meaningfully.
🛡️ Major Put Supports to the downside
5700 → = HVL, also aligned with pTrans and Put support.Dealer unwind risk, downside opens.5500 → Key level if the 5700 zone fails — “total denial zone” of current FOMO.
-----------------------------
This week’s SPX setup remains decisively bullish from a gamma perspective. The GEX profile shows strong positive gamma, with institutional and dealer hedging flows firmly positioned to support continued upside—especially into Friday’s OPEX. The environment is ideal for a controlled melt-up: volatility is softening, implied volatility is trending lower, and there’s no sign of panic in the options market.
Put pricing skew is also declining, which suggests reduced fear and a shift toward more aggressive call buying—another sign of bullish sentiment. Dealer positioning implies that any upward momentum is likely to be chased and hedged into, reinforcing the trend.
However, traders should stay alert: if SPX slips back below 5825, we may see a pause or retracement back into the 5700–5825 transition zone. Only a decisive break below 5700 would flip the gamma regime back to negative and open the door to real downside volatility.

05/05 SPX Weekly Playbook - GEX Zone Outlook🔮 What-If Scenarios for This Week – Based on GEX Structure until Firday
Last week’s market momentum pushed the S&P 500 up by almost 3%, effectively erasing the price gap left behind on Liberation Day. The index also strung together nine straight days of gains—something we haven’t seen since late 2004.
Meanwhile, implied volatility dropped significantly, with the VIX touching its lowest level since the holiday, falling to around 22.5.
Several factors seem to have fueled this bullish tone, including a more measured approach from Trump on trade policies and strong quarterly results from major tech names like Microsoft and Meta.
Still, the nature of the buying raises questions—was this a thoughtful rotation, or just a broad sweep of optimism?
~~~~~~~~~~~~~~~~~~~~~~~~~~~~~~~~~~~~~~~~~~
🔄 Chop Zone: 5650 – 5670 (wide transition zone)
🔹 Gamma Flip: 5615
🔺 Key Call Wall: 5725 (5800 potential shift)
🔻 Key Put Wall: 5500 (5400 major support below)
🔼 Upside Path
IF > 5670 → transition cleared →
➡️ 5700 stall / reaction
IF > 5725 → call wall breached →
➡️ Path to 5750 / 5775 → stall at 5800 (largest net call OI)
IF > 5800 → gamma resistance breaks down →
➡️ 5825/5850 zone opens up
🔽 Downside Path
IF < 5615 → gamma flip triggered →
➡️ 5500 = battle zone (massive put wall + high negative GEX)
IF < 5500 → negative gamma squeeze likely →
➡️ Stall zone: 5450 → flush to 5400
IF < 5400 → high-volatility regime →
➡️ Possible acceleration to 5375 / 5340 depending on IV spike
⚖️ Neutral Setup
IF 5650–5670 holds → dealer hedging = balanced →
➡️ Ideal for non-directional spreads / theta plays
➡️ Wait for breakout confirmation above 5670 or below 5615
~~~~~~~~~~~~~~~~~~~~~~~~~~~~~~~~~~~~~~~~
🔍 Final Thoughts
We’ve seen a sharp rally since the Trump trade war scare, with barely any meaningful pullback. The market appears to be looking for one—as a breath. Based on current GEX positioning, there’s significantly more downside hedging than upside, especially in the mid-term May expirations.
That doesn’t necessarily mean we crash—but it does mean that moves lower can accelerate faster, while upward breakouts may require more energy or time. In this environment, consider:
Bearish or neutral spreads (put debit spreads, call credit spreads)
Volatility-based strategies
Avoiding naked upside trades unless we see a strong reclaim of 5725+
Stay safe and adapt—GEX doesn’t tell direction, but it does tell where the fire might start, beacuse of reflexting to hedging activity.

04/28 Weekly GEX AnalysisDETAILED IMAGE:
Here’s what the charts and indicators are showing right now until Friday.
We are approaching a key breakout zone.
🐂 🟢 IF the market breaks above the white bearish daily trendline, the next bullish target could be between 5515–5680.
🟦 ⚖️ The chop area is between 5435–5515.
Expect more back-and-forth moves here if the breakout fails.
🐻🔴 Watch out: if the price drops below 5435 or 5425, there’s little support left.
This could trigger a sharp sell-off ("Bearish Armageddon" scenario).
GEX profiles remain positive 🟢 across all near expirations — for now — suggesting that underlying support still exists, but we need to monitor any changes closely.
IVRank is still relatively high (30.9), meaning options are priced with a decent amount of implied volatility.
🟢Short-term sentiment is currently bullish, with some speculative activity picking up.
This suggests that traders are expecting less volatility over the next month compared to what we saw in the past week.
However, if we look at institutional positions focused on longer-term expirations (especially beyond 30 days on SPX/AM maturities), the picture remains bearish 🔴 or at least highly volatile.
These players are still strongly hedging against downside risks.
This confirms the broader point:
Even though price action managed to recover to pre-tariff-announcement levels — with very low trading volume — we’re not out of the woods yet.
Until we can break and hold above the key resistance bearish trend with HIGH BUY VOLUME (aka. momentum), we shouldn't expect a strong, stable GEX profile across all expirations like we had in the past.

[04/22] 𝟬𝗗𝗧𝗘 𝗦𝗣𝗫 𝗚𝗘𝗫 𝗥𝗲𝘃𝗶𝗲𝘄Contextual Thinking:
Yesterday’s sharp drop was fully bought back — for now. We're currently at a call resistance level, so the down move may continue today.
Gameplay:
Below 5205, I lean towards being cautious or outright bearish. A hypothetical selloff could intensify below 5170 (Gamma Flip level).
I'm definitely not targeting below 5100, but based on the current options pricing, the market seems to be pricing in 5100 — yesterday’s low — as the most pessimistic scenario.
Caution:
Given the significant intraday swings over the past 24 hours (both up and down), the market is likely to close somewhere between the high and low of the day due to ongoing uncertainty. This is typical in such volatile conditions, and I see this as the most probable outcome.
So unless strong buying pressure or good news emerges, I expect the market to close between 5100 and 5205.
However, if we break above 5205, we could witness a positive gamma squeeze , with 5250 being the first upside target.

GEX Analysis & Options “Game Plan”🔶 Short- and longer-term perspective in a high IV, negative GEX environment
🔶 KEY LEVELS & RANGES
Spot: 221
Gamma Flip / Transition: around 250 (the turquoise zone on the chart)
– This zone typically marks a “power shift.” If price decisively breaks above 250 and holds, market makers’ gamma positioning could flip from neutral/negative to positive.
Put Support: 200
– A large negative gamma position has accumulated here, making 200 a strong support level. If it breaks, the downside may accelerate.
Call Resistance: 400
– A major long-term “call wall” where a significant amount of OTM calls are concentrated. It’s more relevant to LEAPS; currently far from spot, so not a realistic short-term target.
Call Resistance #2: 300
– A medium-term bullish objective, still above the 200-day MA. You’d need to be strongly bullish to aim for ~300 by May (e.g., going for a 16-delta OTM call).
Short-Term / Intermediate GEX Levels:
– There are gamma clusters around 220–230 and 250–260 . These areas often see higher volatility, possible bounces, or stalls (chop) due to hedging flows.
🔶 WHATEVER SCENARIO – SHORT TERM (0–30 DAYS)
A) Upside Continuation / Rebound
– If TSLA closes above 225–230 , the next target is 240–250 (transition / gamma flip).
– If it breaks above 250 and holds (e.g., successful retest), market makers may shift to “long gamma,” fueling a quicker move to 260–270 .
– Resistance: 250, 300, with an extreme LEAPS-level at 400.
B) Downside Move / Bearish Break
– If price dips below ~220 and sustains, the next targets are 210–200 (major put wall / negative gamma).
– If 200 fails, negative gamma may magnify the sell-off. It’s an extreme scenario but still on the table given high IV and macro/geopolitical risks.
– Support: 210, 200 — likely stronger buying interest near 200, possibly a short-term bounce.
– The options chain suggests near-term hedging via puts for this scenario.
C) Chop / Sideways
– If TSLA stays in 210–230 , market makers (short options) might benefit from high IV/time decay.
– Negative GEX, however, can trigger sudden moves in either direction; caution is advised.
🔶 LONGER-TERM FOCUS (6–12 MONTHS, LEAPS)
NET GEX = -61.97M (negative territory) suggests longer-dated positioning is also put-heavy or carries notable negative gamma.
HVL / pTrans = 250 is a key pivot; cTrans+ = 400 is distant call resistance. Between these levels, there’s a mix of put/call dominance.
If Tesla undergoes a fresh growth phase (AI, robotaxi, energy storage, etc.) and clears 250/300 , 400 could become the next significant call wall — but that’s more of a multi-month horizon.
🔶 STRATEGY IDEAS (High IV Environment)
1. Short-Term Bearish
– If you’re bearish and expecting TSLA to test 220–210, consider a bear put spread or net credit put butterfly (lower debit) to leverage high IV.
– Targeting 200, but keep in mind negative gamma may accelerate downside movement.
2. Medium-Term “Contra” Bullish (bounce to 250)
– If GEX suggests a bounce off 210–220, consider a bull call spread (e.g., 220/240) or a net debit call butterfly (220/240/250).
– Be mindful of sudden swings, as we remain in negative gamma territory.
3. Longer-Term Bullish (>3–6 months)
– A call butterfly with upper strikes around 300–350 offers capped debit and higher potential payoff if a bigger rally materializes.
– A diagonal spread (selling nearer-dated calls, buying further-out calls) exploits elevated front-end IV.
4. Neutral / Range-Bound
– If TSLA stays in 200–250 , you could use Iron Condors (e.g., 200/260) to benefit from time decay and any IV collapse.
– Exercise caution: negative gamma can generate abrupt, directional moves, making a neutral stance riskier than usual.
🔶 ADDITIONAL NOTES & “BIG PICTURE”
High IV & Negative GEX: TSLA has a track record of large swings. Negative GEX can intensify sell-offs, while forced hedging might trigger rapid rebounds.
Preferred Structures: With expensive premiums, spreads (vertical, diagonal) and butterfly configurations generally fare better than plain long options (less vulnerable to time decay).
Potential Catalysts: AI announcements, Autopilot breakthroughs, new product lines, and macro changes can swiftly alter market dynamics. Keep tracking GEX updates and news flow; TSLA tends to respond dramatically to fresh developments.
🔶 Bottom line: From 221 spot, watch 210–200 on the downside and 240–250 on the upside short term. Medium-term bullish target = 300 , while 400 remains a far LEAPS scenario. High IV + negative gamma = fast, potentially volatile moves — so risk management and spread-based approaches are crucial.

04/07 GEX + Historic VIX Highs: Extreme Volatility with OptionsWow, where to begin? We’ve just come through a week that even the most thorough analysts found surprising.
Last Friday’s brutal sell-off triggered such a massive margin call rally that even the hedge funds were forced to exit gold—which is usually considered a safe haven—on Friday.
The VIX is at a historic high — no joke. We last saw levels like this during the 2008 crisis and the COVID panic in 2020.
📌 High IV = High Theta
When implied volatility (IV) is high, theta (the time decay of options) is also high. This means that maintaining long put protection becomes extremely expensive. From a broker’s hedging perspective, if they are short expensive put options, they can gradually buy back their futures positions over time (all else being equal). As IV rises, this buyback becomes increasingly attractive for them.
Let’s look at our weekly SPY analysis using GEX Profile (Gamma Exposure) indicator first:
It’s definitely not a cheerful chart!
* Below 520: We have strikes dominated by puts. The largest negative GEX “profit-taking zone” sits at 490. If price reaches that level and the support fails (the previous major bottom from April 2024), we could move even further down into a very wide negative squeeze zone, possibly as far as 445.
* HVL zone: 520–546: A choppy area around the gamma flip.
* Above 546: This would signal a +10-15% rally, putting us in a positive gamma zone. However, such a scenario currently seems unlikely—at least based on the gamma levels we see right now.
I won’t sugarcoat it: we’re at levels now where the market could easily move 10% in either direction. So, in my view, forget about conservative option strategies with flat delta exposure.
🤔 What Can We Do?
Important: This analysis reflects my personal opinion only. It’s primarily for those looking to speculate in this highly uncertain environment. If you’re holding put options strictly as a hedge, then this may not be directly relevant to you. In these conditions, the number one rule is to survive—hedges are meant to protect assets or guard against margin calls, not to make profit.
Currently, IV (implied volatility) and VIX are at historic highs. For them to stay this elevated, we’d need new negative headlines and further major market drops. While that could certainly happen, statistically it becomes less and less likely as time goes on.
Buying Put Options …. no way?
First off, there are plenty of challenges if you plan to buy put options right now—most of all their cost. Put options are nearly twice as expensive as calls in many cases.
Does this mean I recommend selling puts or put spreads? I’m not saying you shouldn’t, but be aware: this isn’t for the faint-hearted or for beginners (the risk is high!). It might be worth exploring butterfly or vertical debit spread strategies, as our goal remains the same as always: to maximize the risk–reward ratio.
🐂 If You’re Bullish
This might sound like a ninja move, but one possibility is to buy call butterfly spreads. Yes, the market could still drop—that’s absolutely possible. But statistically, it’s becoming less likely that we’ll see another huge leg down without some form of rebound.
- Slight Move Up: In the event of a mild rise, call spreads and call butterfly strategies can significantly outperform a simple long call. The short legs in a spread/fly offset high theta costs and mitigate the negative effects of falling IV.
- Even with a +10% Move: A long call is often still not the best choice in this environment—even if the option goes deep in the money.
Where Call Spread/Butterfly Can Fail
If stocks rally 15–20% or more and IV also increases (which would be unprecedented in just a few days).
If the market crashes and VIX spikes above 100 (IV would skyrocket, raising the cost of all options further).
Cheap Bullish Calendar Spread
In a situation like this, even a cheap calendar spread can be a good play — the risk is relatively low, especially if managed well and the breakeven range is wide. Of course, if implied volatility drops, the spread could narrow, but that would likely come with a market rally, which theta can help capitalize on.
🐻 If You’re Bearish
I strongly advise against buying single-leg puts, even on a 0DTE (zero-days-to-expiration) basis. If you’re convinced the market will keep dropping, I’d only consider debit spreads, aiming for a solid risk–reward ratio (in my case, I look for at least 1:2 risk-to-reward).
⚖️ If You Want to Stay Neutral / Omni bullish
If you prefer not to pick a direction, you could try to capitalize on historically high IV with a May-expiration Iron Condor. This is the classic TastyTrade approach, with the caveat that you must monitor GEX levels and IV daily and adjust the far side as needed.
Risk Management: If the spot price threatens one of your short strikes, you probably shouldn’t wait around in this volatile environment. It’s usually better to close the position and take a small loss than to hope for a reversal—hoping can become very expensive!
Conclusion
The market is extremely volatile, and expensive options mean traditional strategies may not work as well as they usually do. Stay cautious, manage risk meticulously, and don’t be afraid to close out losing trades quickly. As always, surviving to trade another day is the most important rule.

03/24 SPX Weekly GEX Outlook, Options FlowYou can see that every expiry has shifted into a stronger bullish stance heading into Friday, with GEX exposure moving upward across the board—though total net GEX is still in negative territory, while net DEX (delta exposure) is positive. This combination points toward a likely near-term rebound this week, which makes sense after testing the 5600 range last week….
Here’s a more detailed breakdown of the key zones and likely moves this week:
Bullish Target:
The current uptrend could reach 5750 on its first attempt (already reached in Monday, thx bullsh :) ). If a positive gamma squeeze emerges at that level, we might see an extension to 5800 or even 5850 as a final profit-taking zone for bulls this week.
HVL (Gamma Slip Zone):
Placed at 5680, this threshold currently supports a low-volatility environment. A drop below 5680, however, could reignite fear and fuel bearish momentum.
Put Floors & Net OI:
The largest net negative open interest (OI) cluster is at 5650, with the next key level near 5600. At 5600, net DEX reads fully positive, suggesting strong buying support if the market tests that lower boundary.

Gamma Exposure Analysis SPY & VXX SPY Resistance at 570. The 570 level in SPY likely corresponds to a high gamma concentration for 0DTE (zero days to expiration) options. At this strike, market makers short gamma (i.e., net sellers of options) at this level would dynamically delta-hedge by selling SPY as the price approaches 570, creating selling pressure and resistance. Next resistance level 575.
For VXX , the 48 level likely represents a put-dominated gamma zone: If market makers are net long puts, they would buy VXX as prices decline toward 48 to hedge against further downside, creating support. Next support level 46.50

Bitcoin daily analysis based on IBIT Gamma ExposureIf IBIT surpasses the 48.00 level (which serves as a pivot), Bitcoin could rally toward the key 0DTE level at 50.50 (daily target)

Gamma Exposure on SPXToday marks the first day in a long time where we can observe some green, bullish levels on gamma exposure. The daily GexView indicator displays thin green lines, which represent the gamma exposure of zero-days-to-expire contracts. The thick lines, on the other hand, represent the total gamma exposure across all expiration contracts. This is a promising first step, especially if these lines persist over the next few days and continue to develop further.

[03/03] SPY GEX Analysis (Until Friday Expiration)Overall Sentiment:
Currently, there’s a positive GEX sentiment, suggesting an optimistic start to the week following Friday’s bounce. However, the key Call resistance appears at 600, and it may not break on the first attempt. If optimism remains strong, there’s a chance SPY 0.09%↑ could still push above that zone after some initial back-and-forth.
🟢Upside Levels:
600–605 Zone: This is a major resistance area. Should SPY move decisively through 600/605, the next potential target could be 610.
610: This is currently the largest positive GEX zone for the week. Current option pricing suggests only about a 9% chance of closing at or above 610 by Friday, so it might require a particularly strong move to break through.
🔵 Transition Zone: Roughly 592–599. The gamma flip level is near 592, and staying above that keeps the market in a positive gamma range for now.
🔴 Downside Risk:
If 592 Fails (or HVL climbing up during the week, and after that HVL fails…): A drop could accelerate toward 585, which may act as the first take-profit zone for bears. Below that, 580 could be in play if selling intensifies.
Lower Support: 575 is the last strong support mentioned, but current option probabilities suggest about an 88% chance of finishing above that level, making a move below 575 less likely—though still possible given the higher put skew.
🟣Volatility & Skew:
IVR (Implied Volatility Rank) is quite high on SPY, with a notable put pricing skew (around 173.1%).
This heightened put skew indicates the market is pricing in faster, more volatile downward moves compared to upside.

02/26 Special GEX Outlook: NVDA Earnings, GEX LevelsNVDA Earnings Announcement 🔥
NVIDIA reports earnings today, after market close, and this release could create significant movement. Let’s dive right into the charts and see what the technicals are telling us!
With earnings so close, I typically look only at the nearest expiration, which in this case is 02/28 (Friday).
The implied move (IV) is around 10%, or approximately 12 points in either direction. That’s what the market has priced in for this binary event.
Key Observations
The price is hovering around the Transition Zone and very close to the HVL (High Volume Level) around 130–132.
This suggests the market maker is trying to remain delta-neutral leading into earnings. Once the report hits, expect potential volatility on Wall Street! 🚀
GEX Levels for Friday
🔴 Bearish Scenario
The bottom of the Transition Zone is at 126.
If price drops below 126, the next major put support is at 120 and extends to 115 (a negative gamma squeeze zone).
In other words, a breach of 126 could lead to a quick slide down to 120.
🟢Bullish Scenario
Major call resistance stands at 150, with a secondary call wall at 145.
Above 133 (top of the Transition Zone), calls dominate, meaning the path to 145–150 could open up if we break above the HVL.
Longer-Term Perspective 📊
We’re still in an overall uptrend, but history shows that even with positive surprises on 2 out of the last 4 earnings calls, the market had already priced in those expectations—often leading to a sell-the-news reaction.
I do not recommend trading right before the earnings with a binary mindset. It’s like walking into a casino and putting all your chips on red or black—it’s pure gamble! 🎰
Call pricing skew has been on a downward trend since DeepSeek (likely referencing a volatility event), indicating that call butterflies might not be as attractive on NVDA now as they were in the past few weeks.
Fundamental Analysis 💡
NVIDIA is a hype stock, much like TSLA was a few years back. Its current price has factored in a lot of the future potential.
Based on FastGraphs and other valuation tools, NVDA 1.44%↑ seems overpriced relative to its underlying performance.
A correction might bring it closer to fair value (the “green zone”), like it did in October 2022.
Until then, I’m not considering it for a 5+ year long-term investment—no matter what the short-term price action is.
Conclusion & Post-Earnings Strategy 👉
We simply don’t know which direction NVDA will move after earnings.
Typically, implied volatility (IV) expands before earnings (~90% of the time) and collapses for the nearest expiration immediately afterward.
Even IV on farther-dated expirations can continue to drift lower for a week or two post-earnings.
My Plan
Since I haven’t opened a time spread trade, I’m focusing on post-earnings setups.
If NVDA makes a huge move (breaking out of the 120–150 range), I’ll likely wait at least one more day before placing any new position to let open interest (OI) restructure.
April expirations will be more interesting for me after the dust settles.

[02/10] SPX – GEX Until the First Weekly ExpirationThe SPX opened with a huge gap-down in both the futures and CFD markets. After the previous two Fridays, there was a massive gap-down in the premarket each time. Everyone was expecting the same scenario again, but it seems the market quickly recovered from the put support at the 6000 level, and we are now steadily moving toward the positive GEX range.
Although we are still in the transition zone (where it’s easy to switch between positive and negative GEX territory), we may soon reach the HVL level at 6060, which, if I had to guess, might be adjusted during today’s premarket update.
The GEX levels align with the technical foundations:
🟢 6090–6100 to the upside is a bullish take-profit zone, and our purely positive GEX range is fairly narrow. If buying pressure is strong, above 6100 we could see a very strong positive gamma squeeze upward.
🔴 To the downside, “armageddon” could begin if the put support around 6010–6000, which held the sell-off this morning, fails to hold. The next target in a negative gamma squeeze could be 5950, followed by 5900.
The transition range is quite wide, and the market is expecting a volatile week (though I believe that from now on it’ll expect volatility every day for the next four years...).
The transition zone is sure to narrow by Friday. It’s worth paying attention to the premarket update around 6:45 AM, about three hours before the market opens!
If the red zone extends very deep afterward (for example, if it’s red below the HVL level all the way to the put support at around 5950), it indicates a significant downside risk compared to any potential rally—which I don’t think will change unless we get a breakout above 6100.
🔶 So, be cautious with those bullish horns—below 6100, we can’t talk about a confirmed breakout to the upside.

[02/03] SPX Weekly GEX OutlookSPX shifted into a strong sideways trend after recent market whipsaws, but premarket today saw a sharp sell-off.
Now, let’s break down the GEX levels set for Friday’s weekly expiration (first weekly expiry). These are already reflected in today’s GEX data—check them on your indicator!
COMMENT: This week, we’ve started updating our seamless GEX & options indicators before the market opens . This has been a long-standing request from users—especially 0DTE traders, who will likely benefit the most.
Key GEX Levels for SPX
📍 Highest Positive Call Wall (Call Resistance): 6075
Acted as resistance last Friday, as it often does initially.
📍 Sideways Zone: 6000-6070 (Transition Zone with GAMMA flip)
Wide Transition Zone → Expect high volatility or slow drifting within this range.
Easy flow between positive and negative GEX profiles, meaning potential sharp moves in either direction.
📍 Put Support (Sum 4DTE): 5900
Very deep support—market is clearly pricing in fear of a potential future drop.
📌Below 6000, there are only negative NetGEX strikes down to 5900, which signals a lack of strong support until that level.
What This Means for the Week
📊 SPX opened (gapped down) in negative GEX territory—if buyers don’t reclaim this zone, we are in for a highly volatile week, potentially with a spiking VIX.
🚫 No reason for bullish optimism unless we break above 6070—until then, expect uncertainty and potential downside pressure.
PS: FINAL GEX ZONE COLORING SHEET

[02/03] TSLA GEX Outlook for February expiration📌 Key Levels & GEX Insights
Gamma Flip Zone: ~400 (until Febr expiration)
Tight Transition Zone, Wide Clear Movement Range
Above 420 Call Resistance : Every strike has positive Net GEX, meaning a return to this range would likely support further balanced upside or sideways movement.
Below 375 : The next PUT support is at 350, so a break below this level could open the door for a deeper drop.
There are 3 weeks until expiration. IV and IVR remain high even after earnings.
Despite today’s selloff, the high call pricing skew is still attractive if we want to collect credit.
In this case, a call butterfly or broken-wing call butterfly could be worth considering—but strictly based on GEX levels.
PS: FINAL GEX ZONE COLORING SHEET
