#GLMR/USDT#GLMR
The price is moving within a descending channel on the 1-hour frame, adhering well to it, and is heading for a strong breakout and retest.
We have a bounce from the lower boundary of the descending channel. This support is at 0.0593.
We have a downtrend on the RSI indicator that is about to be broken and retested, supporting the upside.
There is a major support area in green at 0.0600, which represents a strong basis for the upside.
Don't forget a simple thing: ease and capital.
When you reach the first target, save some money and then change your stop-loss order to an entry order.
For inquiries, please leave a comment.
We have a trend to hold above the 100 Moving Average.
Entry price: 0.0634
First target: 0.0641
Second target: 0.0654
Third target: 0.0670
Don't forget a simple thing: ease and capital.
When you reach the first target, save some money and then change your stop-loss order to an entry order.
For inquiries, please leave a comment.
Thank you.
GLMRUSD

#GLMR/USDT - Buyers Are Here!#GLMR
The price is moving within a descending channel on the 1-hour frame, adhering well to it, and is heading for a strong breakout and retest.
We have a bounce from the lower boundary of the descending channel, this support at 0.0600.
We have a downtrend on the RSI indicator that is about to be broken and retested, supporting the upside.
There is a major support area in green at 0.0592, which represents a strong basis for the upside.
Don't forget a simple thing: ease and capital.
When you reach the first target, save some money and then change your stop-loss order to an entry order.
For inquiries, please leave a comment.
We have a trend to hold above the 100 Moving Average.
Entry price: 0.0615
First target: 0.0623
Second target: 0.0634
Third target: 0.0650
Don't forget a simple thing: ease and capital.
When you reach your first target, save some money and then change your stop-loss order to an entry order.
For inquiries, please leave a comment.
Thank you.

#GLMR/USDT#GLMR
The price is moving within a descending channel on the 1-hour frame, adhering well to it, and is heading towards a strong breakout and retest.
We are experiencing a rebound from the lower boundary of the descending channel. This support is at 0.0790.
We are experiencing a downtrend on the RSI indicator, which is about to break and retest, supporting the upward trend.
We are heading towards stability above the 100 Moving Average.
Entry price: 0.0800
First target: 0.0822
Second target: 0.0850
Third target: 0.0880

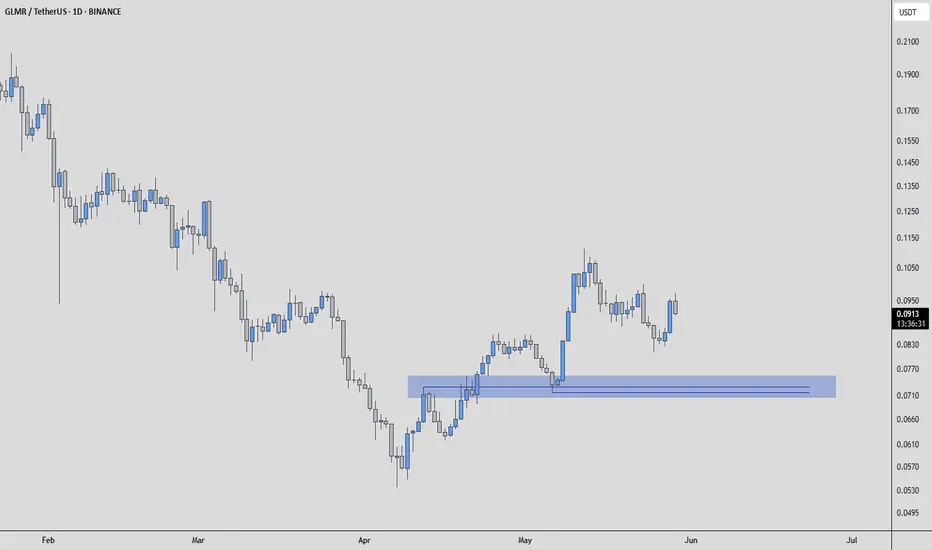
GLMRUSDT - Buyers Are Here!Observing GLMRUSDT, one identifies a notable blue box on the chart. This area, in the estimation of a discerning investor, appears to function as a significant support level.
The principle here is straightforward: when an asset's price descends to a particular zone and consistently finds buying interest, preventing further decline, that zone establishes itself as a support. This blue box suggests a concentration of demand, where those who value the asset are prepared to acquire it.
While technical patterns are not the sole determinant of value, they can illuminate where market participants are accumulating positions. A sustained defense of this blue box, particularly if accompanied by a decrease in selling pressure or an uptick in buying volume, would reinforce its significance.
Conversely, a decisive breach of such a support level would necessitate a re-evaluation, as it would indicate a shift in the balance between supply and demand. However, for the present, this blue box stands as a point of interest for those seeking to understand the potential floor for GLMRUSDT's price action.
📌I keep my charts clean and simple because I believe clarity leads to better decisions.
📌My approach is built on years of experience and a solid track record. I don’t claim to know it all but I’m confident in my ability to spot high-probability setups.
📌If you would like to learn how to use the heatmap, cumulative volume delta and volume footprint techniques that I use below to determine very accurate demand regions, you can send me a private message. I help anyone who wants it completely free of charge.
🔑I have a long list of my proven technique below:
🎯 ZENUSDT.P: Patience & Profitability | %230 Reaction from the Sniper Entry
🐶 DOGEUSDT.P: Next Move
🎨 RENDERUSDT.P: Opportunity of the Month
💎 ETHUSDT.P: Where to Retrace
🟢 BNBUSDT.P: Potential Surge
📊 BTC Dominance: Reaction Zone
🌊 WAVESUSDT.P: Demand Zone Potential
🟣 UNIUSDT.P: Long-Term Trade
🔵 XRPUSDT.P: Entry Zones
🔗 LINKUSDT.P: Follow The River
📈 BTCUSDT.P: Two Key Demand Zones
🟩 POLUSDT: Bullish Momentum
🌟 PENDLEUSDT.P: Where Opportunity Meets Precision
🔥 BTCUSDT.P: Liquidation of Highly Leveraged Longs
🌊 SOLUSDT.P: SOL's Dip - Your Opportunity
🐸 1000PEPEUSDT.P: Prime Bounce Zone Unlocked
🚀 ETHUSDT.P: Set to Explode - Don't Miss This Game Changer
🤖 IQUSDT: Smart Plan
⚡️ PONDUSDT: A Trade Not Taken Is Better Than a Losing One
💼 STMXUSDT: 2 Buying Areas
🐢 TURBOUSDT: Buy Zones and Buyer Presence
🌍 ICPUSDT.P: Massive Upside Potential | Check the Trade Update For Seeing Results
🟠 IDEXUSDT: Spot Buy Area | %26 Profit if You Trade with MSB
📌 USUALUSDT: Buyers Are Active + %70 Profit in Total
🌟 FORTHUSDT: Sniper Entry +%26 Reaction
🐳 QKCUSDT: Sniper Entry +%57 Reaction
📊 BTC.D: Retest of Key Area Highly Likely
📊 XNOUSDT %80 Reaction with a Simple Blue Box!
📊 BELUSDT Amazing %120 Reaction!
📊 Simple Red Box, Extraordinary Results
📊 TIAUSDT | Still No Buyers—Maintaining a Bearish Outlook
📊 OGNUSDT | One of Today’s Highest Volume Gainers – +32.44%
I stopped adding to the list because it's kinda tiring to add 5-10 charts in every move but you can check my profile and see that it goes on..
#GLMR/USDT#GLMR
The price is moving within a descending channel on the 1-hour frame, adhering well to it, and is heading for a strong breakout and retest.
We are seeing a bounce from the lower boundary of the descending channel, which is support at 0.0814.
We have a downtrend on the RSI indicator that is about to be broken and retested, supporting the upward trend.
We are looking for stability above the 100 Moving Average.
Entry price: 0.0860
First target: 0.0884
Second target: 0.0914
Third target: 0.0941

#GLMR/USDT#GLMR
The price is moving within a descending channel on the 1-hour frame, adhering well to it, and is heading for a strong breakout and retest.
We are seeing a bounce from the lower boundary of the descending channel, which is support at 0.0865.
We have a downtrend on the RSI indicator that is about to be broken and retested, supporting the upward trend.
We are looking for stability above the 100 Moving Average.
Entry price: 0.0891
First target: 0.0905
Second target: 0.0935
Third target: 0.0974

#GLMR/USDT#GLMR
The price is moving in a descending channel on the 1-hour frame and is adhering to it well and is heading to break it strongly upwards and retest it
We have a bounce from the lower limit of the descending channel, this support is at a price of 0.1240
We have a downtrend on the RSI indicator that is about to break and retest, which supports the rise
We have a trend to stabilize above the moving average 100
Entry price 0.1280
First target 0.1360
Second target 0.1428
Third target 0.1500

#GLMR/USDT#GLMR
The price is moving in a descending channel on the 1-hour frame and is adhering to it well and is heading to break it strongly upwards and retest it
We have a bounce from the lower limit of the descending channel, this support is at a price of 0.1130
We have a downtrend on the RSI indicator that is about to break and retest, which supports the rise
We have a trend to stabilize above the moving average 100
Entry price 0.1152
First target 0.1180
Second target 0.1212
Third target 0.1244

#GLMR/USDT#GLMR
The price is moving in a descending channel on the 1-hour frame and is adhering to it well and is heading to break it strongly upwards and retest it
We have a bounce from the lower limit of the descending channel, this support is at a price of 0.0963
We have a downtrend on the RSI indicator that is about to break and retest, which supports the rise
We have a trend to stabilize above the moving average 100
Entry price 0.0977
First target 0.0990
Second target 0.1008
Third target 0.1030

#GLMR/USDT#GLMR
The price is moving within a descending channel on the 1-hour frame and is expected to continue upward.
We have a trend to stabilize above the 100 moving average once again.
We have a downtrend on the RSI indicator that supports the upward move with a breakout.
We have a support area at the lower limit of the channel at 0.0888.
Entry price: 0.0893
First target: 0.0910
Second target: 0.0921
Third target: 0.0937

GLMR/USDT: Riding the Bull, Waiting for the Dip!🐂📉 I'm analyzing GLMR paired with USDT. 📈 While it's been in a strong bullish trend 💪, it's currently trading at a premium and looks overextended. 😬 Looking at the recent price swing, it's clear we haven't seen a significant pullback. I'm seeking a buy opportunity 💰, but not at these current levels.. I'm waiting for a retracement down to the Fibonacci 61.8% level (equilibrium) 🧘, and then looking for a bullish break in structure (BoS) after the pullback to signal a good entry point. 🎯 Everything is explained in the video. 🎬 This isn't financial advice! ⚠️
GLMR/USDT: Riding the Bull, Waiting for the Dip

#GLMR/USDT#GLMR
The price is moving within a descending channel on the 1-hour frame and is expected to continue upward.
We have a trend to stabilize above the 100 moving average once again.
We have a downtrend on the RSI indicator that supports the upward move with a breakout.
We have a support area at the lower boundary of the channel at 0.0690.
Entry price: 0.0713
First target: 0.0730
Second target: 0.0750
Third target: 0.0774

#GLMR/USDT Ready to take off upwards#GLMR
The price is moving in a descending channel on the 1-hour frame and is adhering to it well and is heading to break it strongly upwards
We have a bounce from the lower limit of the descending channel, this support is at a price of 0.1515
We have a downtrend on the RSI indicator that is about to be broken, which supports the rise
We have a trend to stabilize above the moving average 100
Entry price 0.1587
First target 0.1703
Second target 0.1856
Third target 0.2024

GLMRUSDT 1WGLMR ~ 1W
#GLMR So far it still maintains this support block,. If you still have Conviction on this coin,. Buy from here with a minimum target of 20%+

#GLMR/USDT Ready to go higher#GLMR
The price is moving in a descending channel on the 1-hour frame and sticking to it well
We have a bounce from the lower limit of the descending channel, this support is at 0.2370
We have a downtrend on the RSI indicator that is about to be broken, which supports the rise
We have a trend to stabilize above the moving average 100
Entry price 0.2595
First target 0.2800
Second target 0.3040
Third target 0.3300

#GLMR/USDT#GLMR
The price is moving in a descending channel on the 4-hour frame and is expected to continue upwards
We have a trend to stabilize above the moving average 100 again
We have a descending trend on the RSI indicator that supports the rise by breaking it upwards
We have a support area at the lower limit of the channel at a price of 0.2150
Entry price 0.2314
First target 0.2532
Second target 0.2859
Third target 0.3224

#GLMR/USDT#GLMR
The price is moving in a descending channel on the 4-hour frame and is sticking to it well
We have a bounce from the lower limit of the descending channel and we are now touching this support at 0.1560
We have an upward trend on the RSI indicator that is about to be broken, which supports the rise
We have a trend to stabilize above the 100 moving average
Entry price 0.1633
First target 0.1870
Second target 00.2084
Third target 0.2380

Moonbeam ($GLMR) MR is moving toward its coveted $2 per coin. There is everything for this: a market maker, Binance and Coinbase on board, no extra passengers. We have already started this great movement, hope you are in the rocket!
Best regards, Horban Brothers.

#GLM/USDT#GLM
The price has broken the descending channel on the 1-day frame upwards and is expected to continue.
We have a trend to stabilize above the 100 moving average again.
We have an upward trend on the RSI indicator that supports the rise by breaking it upwards.
We have a support area at the lower limit of the channel at a price of 0.2400.
Entry price 0.3000.
First target 0.3746.
Second target 0.4413.
Third target 0.5090.

GLMRUSDTGLMR ~ 1W
#GLMR If you have Conviction on this Coin,. Maybe you need to consider purchasing here. At least for the short term target of 20%++

GLMR Chart Analysis in Daily TimeframeHello everyone, I’m Cryptorphic.
For the past seven years, I’ve been sharing insightful charts and analysis.
Follow me for:
~ Unbiased analyses on trending altcoins.
~ Identifying altcoins with 10x-50x potential.
~ Futures trade setups.
~ Daily updates on Bitcoin and Ethereum.
~ High time frame (HTF) market bottom and top calls.
~ Short-term market movements.
~ Charts supported by critical fundamentals.
Now, let’s dive into this chart analysis:
For the last 4 months, SEED_DONKEYDAN_MARKET_CAP:GLMR has been in a bearish trend, dropping from $0.7469 to $0.1701 (-77%). The price has reached close to the all-time low level at $0.1603.
GLMR is likely to hold this support and rebound, breaking the resistance trendline and confirming a bullish reversal.
It is interesting to see how the RSI is creating a bullish divergence pattern. If it stays strong, the price will most likely rally from the current market price of $0.1978.
Key Observations:
- Important support: $0.1603 to $0.1804.
- Primary Resistance: $0.228.
- Mid-Resistance: $0.3445.
- Higher Resistance: $0.7469.
- RSI: Bullish Divergence.
- Invalidation Point: A breakdown and close below the support level.
DYOR, NFA.
Please hit the like button to support my content and share your thoughts in the comment section. Feel free to request any chart analysis you’d like to see!
Thank you!
#PEACE

#GLMR/USDT#GLMR
The price is moving within a bearish channel pattern on the 12-hour frame, which is a strong retracement pattern
We have a bounce from a major support area in the color EUR at 0.1800
We have a tendency to stabilize above the Moving Average 100
We have a downtrend on the RSI indicator that supports the rise and gives greater momentum and the price is based on it
Entry price is 0.2000
The first target is 0.2531
The second target is 0.3056
The third goal is 0.3591

#GLM/USDT#GLM
The price is moving in a 12-hour bearish channel, is very committed to it, and has just broken through it
We have a green support area at .5000 that is expected to be bounced from due to its strength
We have a trend to hold above the Moving Average 100, which is strong support for the rise
We have very strong oversold resistance on the RSI indicator to support the rise with a strong downtrend
Entry price: 5600
First target 6248
The second target is 0.6690
The third goal 0.7283
