#GLMR/USDT#GLMR
The price is moving within a descending channel on the 1-hour frame, adhering well to it, and is heading for a strong breakout and retest.
We have a bounce from the lower boundary of the descending channel. This support is at 0.0593.
We have a downtrend on the RSI indicator that is about to be broken and retested, supporting the upside.
There is a major support area in green at 0.0600, which represents a strong basis for the upside.
Don't forget a simple thing: ease and capital.
When you reach the first target, save some money and then change your stop-loss order to an entry order.
For inquiries, please leave a comment.
We have a trend to hold above the 100 Moving Average.
Entry price: 0.0634
First target: 0.0641
Second target: 0.0654
Third target: 0.0670
Don't forget a simple thing: ease and capital.
When you reach the first target, save some money and then change your stop-loss order to an entry order.
For inquiries, please leave a comment.
Thank you.
GLMRUSDT

#GLMR/USDT - Buyers Are Here!#GLMR
The price is moving within a descending channel on the 1-hour frame, adhering well to it, and is heading for a strong breakout and retest.
We have a bounce from the lower boundary of the descending channel, this support at 0.0600.
We have a downtrend on the RSI indicator that is about to be broken and retested, supporting the upside.
There is a major support area in green at 0.0592, which represents a strong basis for the upside.
Don't forget a simple thing: ease and capital.
When you reach the first target, save some money and then change your stop-loss order to an entry order.
For inquiries, please leave a comment.
We have a trend to hold above the 100 Moving Average.
Entry price: 0.0615
First target: 0.0623
Second target: 0.0634
Third target: 0.0650
Don't forget a simple thing: ease and capital.
When you reach your first target, save some money and then change your stop-loss order to an entry order.
For inquiries, please leave a comment.
Thank you.

#GLMR/USDT#GLMR
The price is moving within a descending channel on the 1-hour frame, adhering well to it, and is heading towards a strong breakout and retest.
We are experiencing a rebound from the lower boundary of the descending channel. This support is at 0.0790.
We are experiencing a downtrend on the RSI indicator, which is about to break and retest, supporting the upward trend.
We are heading towards stability above the 100 Moving Average.
Entry price: 0.0800
First target: 0.0822
Second target: 0.0850
Third target: 0.0880

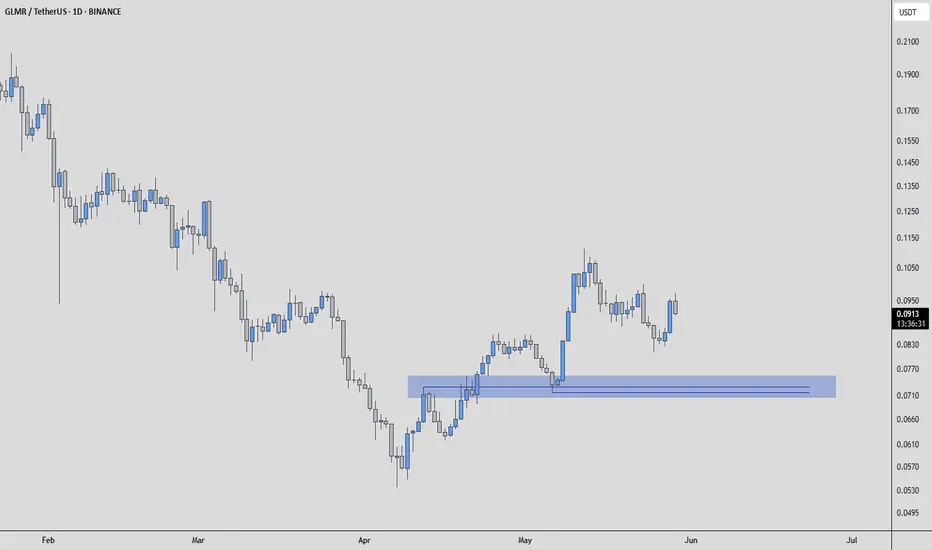
GLMRUSDT - Buyers Are Here!Observing GLMRUSDT, one identifies a notable blue box on the chart. This area, in the estimation of a discerning investor, appears to function as a significant support level.
The principle here is straightforward: when an asset's price descends to a particular zone and consistently finds buying interest, preventing further decline, that zone establishes itself as a support. This blue box suggests a concentration of demand, where those who value the asset are prepared to acquire it.
While technical patterns are not the sole determinant of value, they can illuminate where market participants are accumulating positions. A sustained defense of this blue box, particularly if accompanied by a decrease in selling pressure or an uptick in buying volume, would reinforce its significance.
Conversely, a decisive breach of such a support level would necessitate a re-evaluation, as it would indicate a shift in the balance between supply and demand. However, for the present, this blue box stands as a point of interest for those seeking to understand the potential floor for GLMRUSDT's price action.
📌I keep my charts clean and simple because I believe clarity leads to better decisions.
📌My approach is built on years of experience and a solid track record. I don’t claim to know it all but I’m confident in my ability to spot high-probability setups.
📌If you would like to learn how to use the heatmap, cumulative volume delta and volume footprint techniques that I use below to determine very accurate demand regions, you can send me a private message. I help anyone who wants it completely free of charge.
🔑I have a long list of my proven technique below:
🎯 ZENUSDT.P: Patience & Profitability | %230 Reaction from the Sniper Entry
🐶 DOGEUSDT.P: Next Move
🎨 RENDERUSDT.P: Opportunity of the Month
💎 ETHUSDT.P: Where to Retrace
🟢 BNBUSDT.P: Potential Surge
📊 BTC Dominance: Reaction Zone
🌊 WAVESUSDT.P: Demand Zone Potential
🟣 UNIUSDT.P: Long-Term Trade
🔵 XRPUSDT.P: Entry Zones
🔗 LINKUSDT.P: Follow The River
📈 BTCUSDT.P: Two Key Demand Zones
🟩 POLUSDT: Bullish Momentum
🌟 PENDLEUSDT.P: Where Opportunity Meets Precision
🔥 BTCUSDT.P: Liquidation of Highly Leveraged Longs
🌊 SOLUSDT.P: SOL's Dip - Your Opportunity
🐸 1000PEPEUSDT.P: Prime Bounce Zone Unlocked
🚀 ETHUSDT.P: Set to Explode - Don't Miss This Game Changer
🤖 IQUSDT: Smart Plan
⚡️ PONDUSDT: A Trade Not Taken Is Better Than a Losing One
💼 STMXUSDT: 2 Buying Areas
🐢 TURBOUSDT: Buy Zones and Buyer Presence
🌍 ICPUSDT.P: Massive Upside Potential | Check the Trade Update For Seeing Results
🟠 IDEXUSDT: Spot Buy Area | %26 Profit if You Trade with MSB
📌 USUALUSDT: Buyers Are Active + %70 Profit in Total
🌟 FORTHUSDT: Sniper Entry +%26 Reaction
🐳 QKCUSDT: Sniper Entry +%57 Reaction
📊 BTC.D: Retest of Key Area Highly Likely
📊 XNOUSDT %80 Reaction with a Simple Blue Box!
📊 BELUSDT Amazing %120 Reaction!
📊 Simple Red Box, Extraordinary Results
📊 TIAUSDT | Still No Buyers—Maintaining a Bearish Outlook
📊 OGNUSDT | One of Today’s Highest Volume Gainers – +32.44%
I stopped adding to the list because it's kinda tiring to add 5-10 charts in every move but you can check my profile and see that it goes on..
GLMR Short wait for good entryLike & Follow me for more details
GLMR Short,
BTC will break upward trend soon.
Will reach 103k

#GLMR/USDT#GLMR
The price is moving within a descending channel on the 1-hour frame, adhering well to it, and is heading for a strong breakout and retest.
We are seeing a bounce from the lower boundary of the descending channel, which is support at 0.0814.
We have a downtrend on the RSI indicator that is about to be broken and retested, supporting the upward trend.
We are looking for stability above the 100 Moving Average.
Entry price: 0.0860
First target: 0.0884
Second target: 0.0914
Third target: 0.0941

#GLMR/USDT#GLMR
The price is moving within a descending channel on the 1-hour frame, adhering well to it, and is heading for a strong breakout and retest.
We are seeing a bounce from the lower boundary of the descending channel, which is support at 0.0865.
We have a downtrend on the RSI indicator that is about to be broken and retested, supporting the upward trend.
We are looking for stability above the 100 Moving Average.
Entry price: 0.0891
First target: 0.0905
Second target: 0.0935
Third target: 0.0974

#GLMR/USDT#GLMR
The price is moving in a descending channel on the 1-hour frame and is adhering to it well and is heading to break it strongly upwards and retest it
We have a bounce from the lower limit of the descending channel, this support is at a price of 0.1240
We have a downtrend on the RSI indicator that is about to break and retest, which supports the rise
We have a trend to stabilize above the moving average 100
Entry price 0.1280
First target 0.1360
Second target 0.1428
Third target 0.1500

#GLMR/USDT#GLMR
The price is moving in a descending channel on the 1-hour frame and is adhering to it well and is heading to break it strongly upwards and retest it
We have a bounce from the lower limit of the descending channel, this support is at a price of 0.1130
We have a downtrend on the RSI indicator that is about to break and retest, which supports the rise
We have a trend to stabilize above the moving average 100
Entry price 0.1152
First target 0.1180
Second target 0.1212
Third target 0.1244

#GLMR/USDT#GLMR
The price is moving in a descending channel on the 1-hour frame and is adhering to it well and is heading to break it strongly upwards and retest it
We have a bounce from the lower limit of the descending channel, this support is at a price of 0.0963
We have a downtrend on the RSI indicator that is about to break and retest, which supports the rise
We have a trend to stabilize above the moving average 100
Entry price 0.0977
First target 0.0990
Second target 0.1008
Third target 0.1030

#GLMR/USDT#GLMR
The price is moving within a descending channel on the 1-hour frame and is expected to continue upward.
We have a trend to stabilize above the 100 moving average once again.
We have a downtrend on the RSI indicator that supports the upward move with a breakout.
We have a support area at the lower limit of the channel at 0.0888.
Entry price: 0.0893
First target: 0.0910
Second target: 0.0921
Third target: 0.0937

GLMR/USDT: Riding the Bull, Waiting for the Dip!🐂📉 I'm analyzing GLMR paired with USDT. 📈 While it's been in a strong bullish trend 💪, it's currently trading at a premium and looks overextended. 😬 Looking at the recent price swing, it's clear we haven't seen a significant pullback. I'm seeking a buy opportunity 💰, but not at these current levels.. I'm waiting for a retracement down to the Fibonacci 61.8% level (equilibrium) 🧘, and then looking for a bullish break in structure (BoS) after the pullback to signal a good entry point. 🎯 Everything is explained in the video. 🎬 This isn't financial advice! ⚠️
GLMR/USDT: Riding the Bull, Waiting for the Dip

GLMR Explosion or Final Trap? Yello Paradisers — are you truly ready for one of the cleanest, most deceptive setups we’ve seen on GLMR in weeks? If you’ve been following our latest insights, you already know — this is not the moment to get distracted. A decisive move is on the horizon… but the trap is also well set. The only question is: will you be the one who catches it or gets caught?
💎#GLMRUSDT has just completed a clear 5 wave rising wedge, a classic structure that often signals the end of a move and it has now pushed directly into a key resistance zone. This level has rejected price multiple times in the past (as previously marked), and unsurprisingly, price has stalled here once again.
💎The support at $0.095 is now critical. If this level holds, this current pause could easily evolve into a bullish consolidation before the next impulsive leg upward.But just below, we’re eyeing the demand zone near $0.085. If the $0.095 support breaks and price dips into this zone, we’ll be watching for signs of aggressive buying. A fast rebound here could present a golden long entry, but only if we see clear strength returning immediately after the retest.
💎To the upside, our next moderate resistance lies at $0.1313, and beyond that, the real game begins in the major supply zone between $0.145 – $0.155. That’s where smart money will likely begin distributing their positions, and you should be ready to follow.
💎However, if price breaks below $0.0709, the entire bullish structure gets invalidated. That becomes our flip level — if breached, we will turn bearish and prepare for lower lows.
Discipline, patience, robust strategies, and trading tactics are the only ways you can make it long-term in this market.
MyCryptoParadise
iFeel the success🌴

#GLMR/USDT#GLMR
The price is moving within a descending channel on the 1-hour frame and is expected to continue upward.
We have a trend to stabilize above the 100 moving average once again.
We have a downtrend on the RSI indicator that supports the upward move with a breakout.
We have a support area at the lower boundary of the channel at 0.0690.
Entry price: 0.0713
First target: 0.0730
Second target: 0.0750
Third target: 0.0774

Moonbeam: Your Altcoin ChoiceAnother setup with classic bottom action behavior.
Good afternoon my fellow trader, it is easy to see that the down-move here is losing momentum. GLMRUSDT (Moonbeam) broke out of a downtrend in the form of a falling wedge and then continued dropping to hit a new All-Time Low.
This ATL has no bearish volume. The session (day) that produced the ATL ended green with a strong reversal candle. A dragonfly doji.
The main signal here comes out of the fact that the bearish move, the correction, has gone beyond 100% and has no momentum. The market moves in cycles and within these cycles we have waves.
A down-wave is followed by an up-wave. This can be easily seen by looking at several years of action across any Cryptocurrency chart. This can be seen here based on the action before the current situation.
In late 2024 Moonbeam went bullish and moved up. A bullish wave.
This bullish wave is immediately followed by a correction, a bearish wave.
After the end of this bearish wave, is now a period of consolation, the same that happened before November 2024. This new consolidation phase will end up with a price breakout, a new wave of growth.
Up and down, up and down.
Sometimes the up portion of the action is really big. That's the bull market phase.
Every few years, the down portion becomes really strong and that's the bear market.
A bull market follows a bear market. In between bearish and bullish, we get sideways. There is nothing more to chart, to analyze or to predict. After the market turns red, eventually everything changes and turns green.
To me, we are looking at the best possible entry prices, with great timing.
Expect maximum growth in 2-3 months. A correction, and then the bull market bull-run.
Namaste.

#GLMR (SPOT-INVEST) IN( 0.1500- 0.1600) T.(1.2500) SL(0.1468)BINANCE:GLMRUSDT
#GLMR / USDT
Entry( 0.1500- 0.1600)
SL 3D close below 0.1468
T1 0.4800
T2 0.7200
T3 1.0000
T4 1.2500
3 Extra Targets(optional) in chart, if you like to continue in the trade with making stoploss very high.
______________________________________________________________
Golden Advices.
********************
* collect the coin slowly in the entry range.
* Please calculate your losses before the entry.
* Do not enter any trade you find it not suitable for you.
* No FOMO - No Rush , it is a long journey.
Useful Tags.
****************
My total posts
www.tradingview.com
**********************************************************************************************
#Manta #OMNI #DYM #AI #IO #XAI #ACE #NFP #RAD #WLD #ORDI #BLUR #SUI #VOXEL #AEVO #VITE #APE #RDNT #FLUX #NMR #VANRY #TRB #HBAR #DGB #XEC #ERN #ALT #IO #ACA #HIVE #ASTR #ARDR #PIXEL #LTO #AERGO #SCRT #ATA #HOOK #FLOW #KSM #HFT #MINA #DATA #SC #JOE #RDNT #IQ #CFX #BICO #CTSI #KMD #FXS #DEGO #FORTH #AST #PORTAL #CYBER #RIF #ENJ #ZIL #APT #GALA #STEEM #ONE #LINK #NTRN #COTI #RENDER #ICX #IMX #ALICE #PYR #PORTAL #GRT #GMT #IDEX #NEAR #ICP #ETH #QTUM #VET #QNT #API3 #BURGER #MOVR #SKL #BAND #ETHFI #SAND #IOTX #T #GTC #PDA #GMX #REZ #DUSK #BNX #SPELL #POWR #JOE #TIA #TFUEL #HOT #AVAX #WAXP #OGN #AXS #GALA #ONE #SYS #SCRT #DGB #LIT #QI #FIL #GLMR

#GLMR (SPOT) IN ( 0.2100- 0.2700) T.(1.2500) SL(0.2010)BINANCE:GLMRUSDT
#GLMR / USDT
Entry( 0.2100- 0.2700)
SL 1D close below 0.2010
T1 0.4800
T2 0.7200
T3 1.0000
T4 1.2500
3 Extra Targets(optional) in chart, if you like to continue in the trade with making stoploss very high.
______________________________________________________________
Golden Advices.
********************
* collect the coin slowly in the entry range.
* Please calculate your losses before the entry.
* Do not enter any trade you find it not suitable for you.
* No FOMO - No Rush , it is a long journey.
Useful Tags.
****************
My total posts
www.tradingview.com
**********************************************************************************************
#Manta #OMNI #DYM #AI #IO #XAI #ACE #NFP #RAD #WLD #ORDI #BLUR #SUI #VOXEL #AEVO #VITE #APE #RDNT #FLUX #NMR #VANRY #TRB #HBAR #DGB #XEC #ERN #ALT #IO #ACA #HIVE #ASTR #ARDR #PIXEL #LTO #AERGO #SCRT #ATA #HOOK #FLOW #KSM #HFT #MINA #DATA #SC #JOE #RDNT #IQ #CFX #BICO #CTSI #KMD #FXS #DEGO #FORTH #AST #PORTAL #CYBER #RIF #ENJ #ZIL #APT #GALA #STEEM #ONE #LINK #NTRN #COTI #RENDER #ICX #IMX #ALICE #PYR #PORTAL #GRT #GMT #IDEX #NEAR #ICP #ETH #QTUM #VET #QNT #API3 #BURGER #MOVR #SKL #BAND #ETHFI #SAND #IOTX #T #GTC #PDA #GMX #REZ #DUSK #BNX #SPELL #POWR #JOE #TIA #TFUEL #HOT #AVAX #WAXP #OGN #AXS #GALA #ONE #SYS #SCRT #DGB #LIT #QI #FIL #GLMR

#GLMR/USDT Ready to take off upwards#GLMR
The price is moving in a descending channel on the 1-hour frame and is adhering to it well and is heading to break it strongly upwards
We have a bounce from the lower limit of the descending channel, this support is at a price of 0.1515
We have a downtrend on the RSI indicator that is about to be broken, which supports the rise
We have a trend to stabilize above the moving average 100
Entry price 0.1587
First target 0.1703
Second target 0.1856
Third target 0.2024

GLMRUSDT 1WGLMR ~ 1W
#GLMR So far it still maintains this support block,. If you still have Conviction on this coin,. Buy from here with a minimum target of 20%+

Is GLMR Gearing Up for a Bullish Reversal? A Monthly Chart ViewThe monthly chart for GLMR/USDT provides a long-term perspective on its price trend, showcasing a significant evolution in price action over the years. Initially, the chart reveals a sharp decline, followed by a prolonged period of sideways movement, and now a potential attempt to reverse the downtrend.
A clear downward trendline, drawn in white, connects multiple price highs, reflecting consistent selling pressure throughout the observed period. However, a recent breakout above this downtrend line, indicates a possible shift in market sentiment. Breakouts of this nature can signal a reversal of the prevailing downtrend, with a subsequent retest of the trendline often used to confirm the breakout's validity.
The chart also highlights a price target, represented by a large green rectangle, pointing to an ambitious upward goal of 53.4477 USDT. Despite the current price of GLMR being 0.2285 USDT, this target underscores the potential for a significant recovery if bullish momentum builds.
Key observations suggest that price volatility, initially marked by a steep decline, has tapered off over time into smaller fluctuations. While the breakout and retest signal a potential bullish trend, the risk remains that the price could fail to hold above the trendline and resume its downward trajectory.
This analysis spans several years, starting in 2022 and extending to January 2025, emphasizing that such movements could require a considerable amount of time to unfold. Each candlestick represents a month of trading, providing a broad and slow-reacting view of market dynamics that is less sensitive to short-term fluctuations.
In conclusion, the breakout and retest point towards a promising shift in GLMR’s long-term trend. However, investors should remain cautious and consider the possibility of rejection at the retest level while keeping in mind the extended timeframe for the target projection.
Moonbeam is an EVM-compatible and substrate-based blockchain, which operates as a Polkadot parachain. Glimmer (GLMR) is the utility and governance token of the network, users can participate in governance, paying transaction fees, earning rewards through providing liquidity, and staking.
Disclaimer: This is not a financial advise. This analysis is purely for informational purposes and should not be considered as investment advice. Trading involves risk, and you should consult with a financial professional before making any decisions.

#GLMR/USDT Ready to go higher#GLMR
The price is moving in a descending channel on the 1-hour frame and sticking to it well
We have a bounce from the lower limit of the descending channel, this support is at 0.2370
We have a downtrend on the RSI indicator that is about to be broken, which supports the rise
We have a trend to stabilize above the moving average 100
Entry price 0.2595
First target 0.2800
Second target 0.3040
Third target 0.3300

#GLMR/USDT#GLMR
The price is moving in a descending channel on the 4-hour frame and is expected to continue upwards
We have a trend to stabilize above the moving average 100 again
We have a descending trend on the RSI indicator that supports the rise by breaking it upwards
We have a support area at the lower limit of the channel at a price of 0.2150
Entry price 0.2314
First target 0.2532
Second target 0.2859
Third target 0.3224

#GLMR/USDT#GLMR
The price is moving in a descending channel on the 4-hour frame and is sticking to it well
We have a bounce from the lower limit of the descending channel and we are now touching this support at 0.1560
We have an upward trend on the RSI indicator that is about to be broken, which supports the rise
We have a trend to stabilize above the 100 moving average
Entry price 0.1633
First target 0.1870
Second target 00.2084
Third target 0.2380
