GameStop 2nd massive wave of GME known as meme stock coming !?! After breaking the downward trend line and closing way above it. It is to be expected the GME start a massive rally similar to the one it made earlier and make new highs. Key levels are mentioned in the chart.
PS. such stocks shouldn't be invested without proper risk management. Don't forget to put stop losses near resistance area.
GME

GameStop, an extensive attempt at hacking the Code (link below)Everything you need to know is written directly inside the chart :)
Tadingview /chart/Y8nobi0m/ to navigate it fully

Possible GME Price Targets It looks like we COULD see some price movement this coming week with GME and AMC considering AMC is expected* to report earnings on 11/08/2021 (Monday) after market close. If not maybe GME earnings could make the move in a few more weeks.
Possible GME scenarios
1) Resistance at $234. If we break upwards past $234, I imagine we will AT LEAST see the GAP fill from 287-$297.
2) Support at $190-$208. If we fall below $190 without immediate turn around, we should sell down to the $140 region and lower ($7) before reversing back up to make new highs.
3) Consolidation between $200-$230 until GME earnings where any positive or negative news of growth or about NFT could move the stock big.
Let me know your thoughts.
Note: I am LONG GME and AMC, I believe it is only a matter of time to see new highs with both stocks even if we test 52 week lows before then. Trading is risky, none of what I am saying should be taken seriously, for it is not a recommendation just posting my TA on the stock.

TA on GME. Why not? LolCan you TA something like this?
I can't help but think maybe you can.
There is little interference here.
It's speculation / emotion at it's rawest, and if the Short bubble pops, huge uncontrolled moves can occur....


$GME Q4 may get crazyCould see some GME fireworks in Q4. Trading above ATH anchored VWAP (163.65) and appears to be breaking out of triangle. Needs confirmation, but worth having on watch. Break above $225 resistance zone and $300+ isn't out of the question with MEME strength in this name. Alarms set !

$AMC is so primed for another squeezeFellow apes unite because we are back!
Nice long consolidation, just what was needed, now for the MOASS
All you need to do is HLOD, the simplest thing to do, law of parsimony. Can you do it?

LRC Looks prime to test previous ATH ($2.51)Good afternoon traders!
Just a little bit of fibonacci levels here, LRC is currently presenting a potential bull flag following the breakout of the falling wedge. Stop loss is set just a few percent below the 0 level, with my average entry at 1.073.
A solid entry point seems to be a close on the 15m above this current fib level, with adequate volume and momentum. Looking to see Loopring push up to it's previous ATH being $2.51 with the GameStop NFT marketplace news expected to drop shortly. I currently don't have any targets if/when we break ATH, I want to see how it plays out.
Good luck traders!

Loopring Bull Signal - Massive RSI SpikeLoopring Bull Signal - Massive RSI Spike seen on the 15 minute chart at the beginning of each leg of the ongoing long term bull run. With heavy positive public exposure with the ongoing GME situation, Loopring will be getting massive buying pressure as GME continues to loom in the background. With an announcement of partnership rumored soon, this is likely a conservative estimate.

GME Triangle Formation Almost Complete (Potential 60% Gains)What we see here is the triangle formation that has been in the works since Jan 2021 finally coming to its end. The purple line here is the bottom of the triangle and can be considered to be the 'lowest' price point of the stock. I expect the downturn in price to continue till around Mid-October where it will either shoot back up to the top of the triangle then break past it OR continue beneath the purple line to end the formation. I expect it to go up based on other technical + fundamental analysis - and expect the price to play out very closely to the green arrows provided here. I've closed out my positions in GME months ago but will be looking to get back in if/when the price hits $170 again with a potential outlook of ~60% gains.

GME is going to Banana Planet - $1700Looks like we're seeing a shift here with the buying pressure starting to come in, We need momentum to continue if we expect us to finally break out of this Wedge/Triangle though.
I've been grabbing leaps and shares every chance I get, The longer these institutions prolong this the more violent the breakout will be. RSI, MACD & STOCH are in great positions IMO, RSI came down and is starting to break back up above signaling a trend change (As long momentum continues) and then we have a nice tight MACD cross up starting here along with the STOCH showing a shift as well.
Above 190$ we will see 210-220 quick, then from there I expect retail to wake up again hopefully forces Hedgies to start covering they're sold calls......Rinse and Repeat
Good Luck To My Apes, And I Pray For You Shills/Boomers short on this thing.
We've already won, It's just a matter of how long you will wait for your movie like ending.

LRC entryGood entry point if you're looking to get in/long.
Nov 5th is supposedly the date for the news drop on the GameStop nft exchange built on loopring.

All set for another leg up? Can it hit $700-$800?GME is in NFT and will be in Metaverse where they will have virtual shops where people can buy games and play virtually. If that happens then get ready to see 700-800 range.

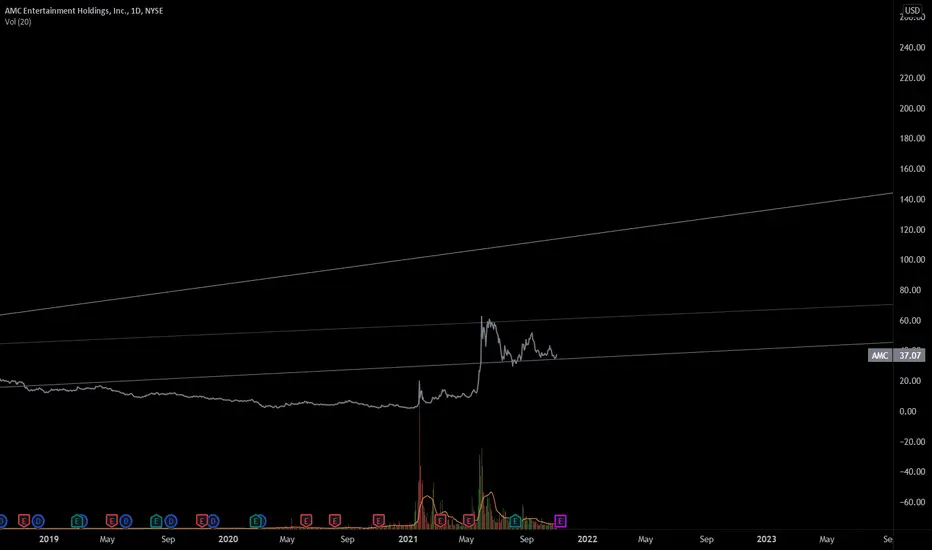
Will it find itself in metaverse? $100 s00n?Imagine AMC in metaverse where AMC has a virtual theatre and you watch a movie there with AMC token or some NFT. If that is the future of AMC then get in and ride the future. I believe that is what is next for AMC. Its a brand and best in its space.
GME TO THE MOON!!Gamestop is breaking out of the triangle!! Price target of $700+ will come quickly!! APES TOGETHER STRONK WE WILL HOLD AND WIN!! SHITADEL AND ROBBIN DA HOOD GOT NOTHING ON APENATION!!


Gme what now?Up or down, coming soon.
I am not sure what to type so I am just typing this sentence to make up for the words needed when publishing.

GME GameStop Price TargetGME Gamestop bounced from support and now looks like it`s heading for the resistance.
My price target is $226
I`m looking forward to read your opinion about it.

GME Launch Mapped!!Money Makers!
GME has been trading above the diagonal support shown nicely for a long time. This stock is looking to move up higher after the accumulation phase is over. I marked out all the key resistance areas with the possible percent gains. If the current support is broken, the next major support is right below $40.
Love it or hate it, hit that thumbs up and share your thoughts!
Don't trade with what you're not willing to lose. Safe Trading Calculate Your Risk/Reward & Collect!
This is not financial advice.
Simplicity Wins

HOOD Blast!!Money Makers!
Keep an eye on HOOD. There's a lot of ppl that are naturally watching this stock due to previous complications during the hype of a few other stocks we should all know about I think this stock is getting ready to move higher with a massive sell-off to support yesterday. It has a few areas that it needs to overcome before it's a clear path to previous ATH. If this previous ATL is broken, I'm not sure how low it will go but I would look for a retest of s/r before thinking of shorting. Time will tell. It's all about Market structure, Area of value, and Entry Trigger.
Love it or hate it, hit that thumbs up and share your thoughts!
Don't trade with what you're not willing to lose. Safe Trading Calculate Your Risk/Reward & Collect!
This is not financial advice.
Simplicity Wins

GME: how high will it go?It looks like GME is moving towards a strong supporting line in a channel and a wedge. It has rebounced on this line before. If it does, how far will it go? No matter what, it looks like, there is a lot of upside.
I like to look at charts because I believe there is magic behind the numbers, when you can read the history, psychology and trends in the charts. I hope I can inspire and entertain, but I am not a financial advisor. Please do your own research.

GME elliot waveTesting/tracking elliot wave theory. Please do not trade off idea without S/L. Not financial advice.
We're either finishing C wave to 22.22 or moving on up to new 5th wave to 769.
