XRP: is there still a chance to BUY? Read the description!Ripple(XRP) is sill waiting for x100 PUMP but in this idea we are going to talk about technical analysis for 4h timeframe and additional chance to open the trade!
If you miss a chance to take a LONG, you need to wait for the better opportunity. There are pullbacks, false breakouts, liquidity collections or test of massive support zone.
At the moment the support is $0,69-0,71 value zone. There are global trendline and $0,7265 key level. These 3 instruments can stop price at this levels. Additionl whales indicator is a Volume. Volume should grow significantly after such massive liquidations.
The second scenario is false breakout of the local trendline. After this it have to be volume growth. This will be second chance to open a trade with good risk to reward (RR).
Friends, press the "like" button, write comments and share with your friends - it will be the best THANK YOU.
P.S. Personally, I open an entry if the price shows it according to my strategy.
Always do your analysis before making a trade.
GMT

GMT/USDT 1H STEPN Two possible modesAccording to the symmetrical triangle pattern, if you wash any of the top or bottom lines, see the continuation of the analysis.

STNDUSDTThere is good news on this coin, they will launch their stablecoin, in addition to the cap market for this coin is very little and there is a chance of it going up to more than $1 in the medium term

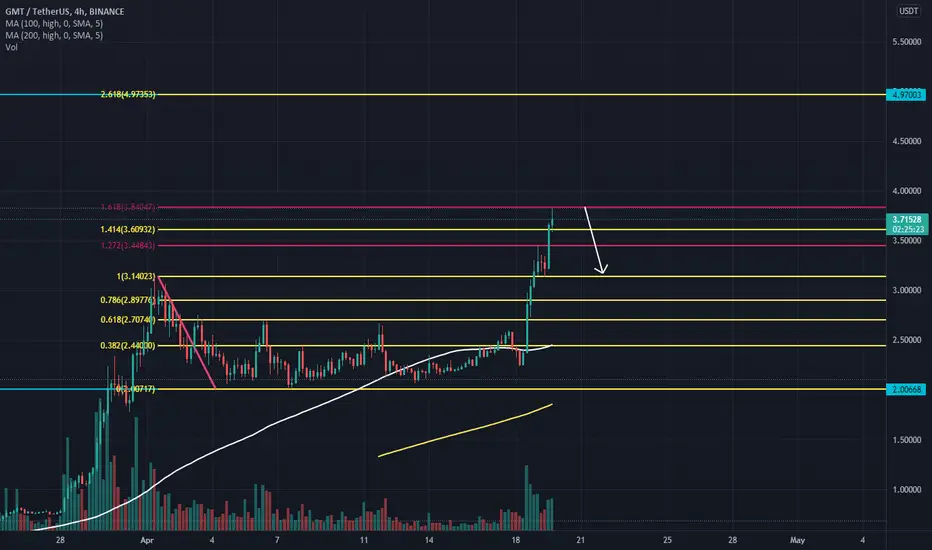
GMT takes a breath after large price increaseHello everyone, let's look at the GMT chart to USDT on the 4h interval. As you can see, the price moves above the local growth trend line designated with a blue line.
Let's start with the designation of the support line and as you can see the first support in the near future is $ 3.41, if the support will be broken, the next it is $ 3.14 at 2,93 $ and 2,71 $.
Now let's move from the resistance line, as you can see, the first resistance is 3.83 $ = 1.618Fib Retracement from which the price has just bounced if you manage to break it, the next resistance can be determined in the area of 4.96 $.
Looking at the Chop indicator, we see that in the 4-hour interval, most energy has been exhausted. It is possible that we will have to wait for the next move until energy is collected.

We may witness a correction in the GMT currency towards the 3.15We may see a drop in the GMT currency towards the area of 3.15 Dollar
After reaching 1.61 Fibonacci areas,
GMTUSDT 🏹see and watch :)
The price is moving in an upward channel and will probably move towards the specified goals ...
Note that the risk of buying is currently very high ...

GMT Breakout Opportunity; we Wait GMT recently broke 3$ and made a 50% move from yesterday. As of this writing, GMT is consolidating in a falling wedge pattern(usually bullish), and sitting at the 0.236 Fib level. It's possible that GMT will break 3.45 and reach up to 4.0 levels. Will be updating this post as time passes by.

GMT gem can make a new ATH ?GMT buy setup for hold mode
YOU CAN BUY on green lines
targets: red lines
comment your idea

DOGE: how to open a trade with a WHALE? Volume+TA!
Dogecoin (DOGE) is not going to lose its popularity. Each asset has its own behavior, which depends on the traders who trade it. What does not work at the cryptocurrency market, works at FOREX or stock market, and vice versa.
The peculiarity of DOGE is a large number of retail traders , who trade it. Retail traders place stop-losses as described in the book, not in practice. This is what the big players (WHALES) use to open their trades.
In the last idea we marked the support zones. The price rebounded by 12% from the first zone of $0.132-0.137.
How to open a deal with the WHALE using volume and technical analysis(TA)?
1. mark a key level. In our case it was the level of $0.133
2. wait for volume growth when the price test this level
This is easier than it may seem, but the liquidity collection/false breakout strategy is very simple. If you want to know more about it write in the comments!
The price is now squeezing under the trend line. This is a bullish signal, but local manipulation is also possible.
Key levels and targets:
1. $0,145
2. $0,158
Friends, press the "like" button, write comments and share with your friends - it will be the best THANK YOU.
P.S. Personally, I open an entry if the price shows it according to my strategy.
Always do your analysis before making a trade.

Next Axie Infinity? GMT StepnIs the next big thing in crypto? Rewards for walking/running?
Seems like it's taking off and hardly anyone knows about it. Makes sense though, walk to earn GMT > walk to earn Nothing.

gmt 1h symmetrical triangle pattern (Target: 3.8)Hi folks
this is my very first idea post
gmt 1h chart shows a symmetrical triangle pattern with a possible target of 3.8
i hope it comes true
Note: this is just my unprofessional ideas i like to share, this is not an investment advice, please do your own research before making investment to anything.

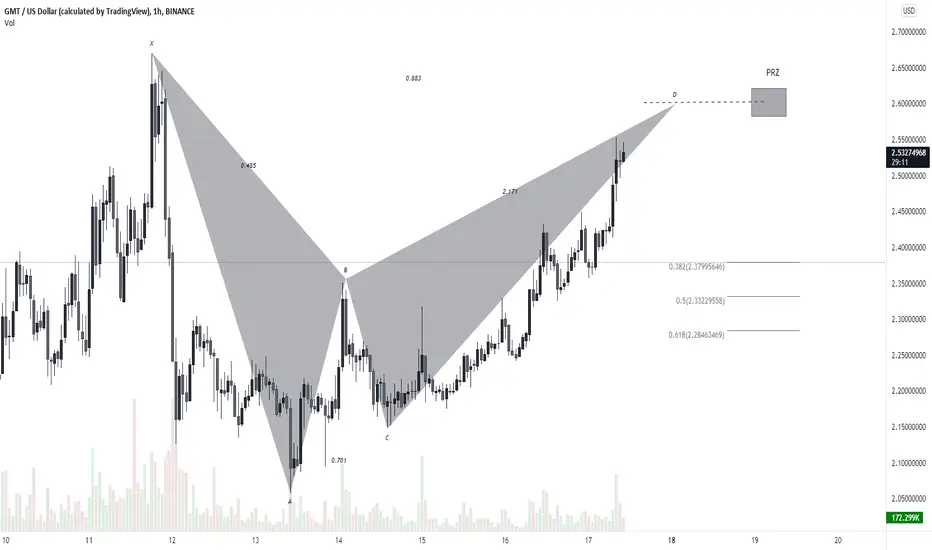
GMT/USDTGiven the chart, which has hit the 1.28 Fibonacci level, it is likely that we will correct the $ 2.8 range. If the correction is not made, the chart could rise to the 1.68 Fibonacci level, which is the $ 3.8 range.

GMT-4HA highly anticipated new coin, I don't really know what's the hype but here is a quick TA with few information.
A clear breakout from the downtrend, currently sitting on the weekly pivot point.
I don't recommend long positions since it had no correcive movement in 1 month, but if you wanna give it a shot,
possible targets are on the chart. Make sure you use a tight stoploss.
NFA, DYOR.

GMTUSD targeting $10.00GMTUSD has developed a Parabolic Growth Channel on the 4H time-frame, similar to the long-term one of Bitcoin. In the past two candles, it appears to be staging a break-out from its All Time High. The last time it broke above an ATH following a consolidation, was in March 28 and initiated a rally. The RSI bounced well on its Buy Zone, so a break above the Resistance can send it to the next Fibonacci extension level of 4.0 ($3.90).
Based on the Parabolic Channel's top and the Fibonacci Time Zones, if every phase is double in duration, then the current one could top a little above the 5.0 Fib extension at $10.00 around May 04.
--------------------------------------------------------------------------------------------------------
Please like, subscribe and share your ideas and charts with the community!
--------------------------------------------------------------------------------------------------------

GMT 1H BUYBuying GMT around 2.35, this is where the VWAP sits and our Blue trendline.
There is a Bull Flag and accumulation.
There is also an upward channel on GMT / BTC and GMT /ETH.

STEPN - GMT Approaching the Big Resistance Now 👟''STEPN IS A WEB 3 LIFESTYLE APP www.stepn.com WITH SOCIAL-FI AND GAME-FI ELEMENTS
👟PLAYERS CAN MAKE HANDSOME EARNINGS BY WALKING, JOGGING, OR RUNNING OUTDOORS''👟
👟Great project, fantastic idea, Perfect execution of the Whitepaper, a strong-young team
but our chart says: More than 80% chances for a rejection
👟We didn't have the chance to invest here until it came in the Top-100 (now at #58 place in marketcap).
👟We see great potential here and we hold an NFT, which is a great utility; but we have to follow the chart. Time to be aware.
One Love,
the FXPROFESSOR

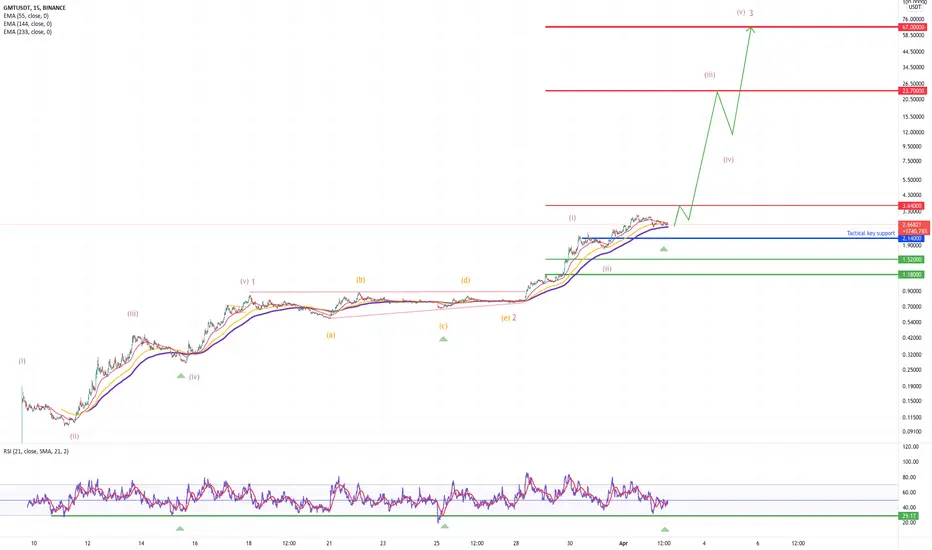
GMT/USDT: Massive Bull Run Loaded => 23,70 & 67,00 ExpectedGMT/USDT: Massive Bull Run Loaded => 23,70 & 67,00 Expected
Previous analysis :
17/03/2022 :
30/03/2022 :
context :
The GMT token surged to the upside reaching the expected target at 3,00 last week. This strong impulsion cycle is not finished as long as 2,14 stay support in order to develop a wave (iii) 3 on going
Yesterday the buying level to add in dips has been seen and RSI is back on significant key support to buy strong :)
Key Elements:
- EMA support 2,60
- Key fibo level = 2,14 and 23,70
- Impulsion Elliot wave target at 67,00 wave 3 target (log scale)
- 2,14 key Ratio + overlap
- Intermediate resistance (fibo) at 3,64
Tactical view 1 to 3 Weeks
Above 2,14 buy any dips (Now) to play 3,64 upside acceleration level to play the wave 3 with 23,70 as first target before 67
Keep going my friends - it is now or never for us !
GMT: READY TO GO FOR A NEW ATH!!Hello everyone, if you like the idea, do not forget to support with a like and follow.
Welcome to this GMT/USDT TRADE setup. GMT looks good here.
GMT is breaking out from the bullish pennant in a 4hr time frame and is currently coming for a retest. After this successful retest, it is ready to pump more than 200%. The last time when it breaks a similar kind of structure it pumps hard and I'm expecting the same this time also. So buy some now and add more in the dip.
Entry range:- $2.36-$2.46
Target:- 250%
SL:- $1.98
If you like this idea then do support it with like and follow.
Also, share your views in the comment section.
Thank You!

GMT/USDT TRADE SETUP! READY TO PUMP 160%!Hi guys, This is CryptoMojo, One of the most active trading view authors and fastest-growing communities.
Do consider following me for the latest updates and Long /Short calls on almost every exchange.
I post short mid and long-term trade setups too.
Let’s get to the chart!
I have tried my best to bring the best possible outcome in this chart, Do not consider it as financial advice.
LONG #GMTUSDT
ENTRY: CMP and add more up to $0.79
SELL- 75%
STOP LOSS: $0.74
Leverage - 5x
This chart is likely to help you in making better trade decisions, if it did do consider upvoting this chart.
Would also love to know your charts and views in the comment section.
Thank you

GMT/USDThi.
Keep an eye on this currency, because although it has made a profit of over 200%, it is still on the rise.

Gmt/usdt analystic this is bullHey brothers this is gmt long bull. O yes this is not short . Lets go buyy gmt/USDT.

GMT BULL FLAGBINANCE:GMTUSD
GMT looks to be forming a potential bull pennant
dont know much about this project just some interesting price action compared to the rest of the crypto market
thoughts?
