GMT/USDT Breakout Alert! Major Downtrend Broken🔻 End of a Long-Term Downtrend?
GMT has been in a strong downtrend since late 2024. A clearly defined descending trendline has acted as strong resistance—until now. The price has bounced from the major support zone between $0.0364 and $0.0425, which has held multiple times since March 2025.
🚀 Breakout Confirmation in Progress:
The chart shows a potential breakout from the descending trendline (yellow). A confirmed breakout with volume would indicate the start of a bullish reversal pattern.
🎯 Key Resistance / Profit Targets:
$0.0474 – Initial minor resistance
$0.0555 – First bullish confirmation
$0.0665 to $0.0744 – Medium-term target
$0.0977 to $0.1302 – Strong upside potential
$0.2108 to $0.2471 – Full bullish target zone if momentum continues
📌 Additional Notes:
The highlighted yellow area is a demand zone signaling potential accumulation.
This setup aligns with classic breakout-reversal formations.
Excellent risk/reward due to proximity to strong support.
#GMTUSDT #GMT #CryptoBreakout #AltcoinSeason #CryptoReversal
#TechnicalAnalysis #BreakoutCrypto #TradingSignals #CryptoTA
#BinanceTrading
GMTUSDT

GMTUSDT 1D AnalysisGMT ~ 1D Analysis
#GMT Buy back gradually from here if you still have confidence in this coin with a short term target of at least 15%+ from here.

GMTUSDT 1D AnalysisGMT ~ 1D Analysis
#GMT Buy gradually from here if you still have confidence in this coin with a short term target of at least 10%++ from here.

GMT New Update (The bullish wave is continuing) 12HThis analysis is an update of the analysis you see in the "Related publications" section
The previous setup is canceled due to the risk of being left behind.
The wave structure has been reanalyzed. It appears that GMT is in a large corrective pattern, likely a diametric, and wave F has completed. Wave F was a symmetrical structure that has now ended.
As long as the POI zone holds, the price can move toward the targets. The targets are marked on the chart. This movement is considered wave G of a higher degree.
A daily candle closing below the invalidation level will invalidate this view.
For risk management, please don't forget stop loss and capital management
When we reach the first target, save some profit and then change the stop to entry
Comment if you have any questions
Thank You

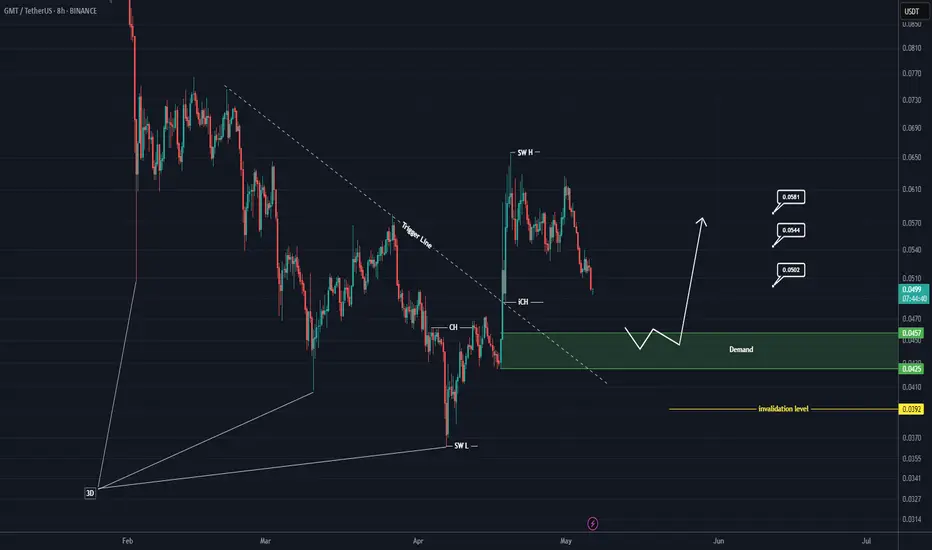
GMT Rebuy Setup (8H)Given the broken 3D pattern at the bottom and the trendline break, our demand zone is considered highly valuable. Therefore, we will look to enter a buy position within the green zone, which has been the origin of a strong move.
The price is currently in a support zone, but we will only enter a position if it reaches the green zone marked on the chart.
A daily candle closing below the invalidation level will invalidate this analysis.
For risk management, please don't forget stop loss and capital management
When we reach the first target, save some profit and then change the stop to entry
Comment if you have any questions
Thank You
GMT Daily Analysis | Bearish Continuation Toward Key Support👀 Welcome to my Trading View Analysis and Trading Channel Here , we share the latest market analysis, trading signals, and key insights together .
Ready for smarter trades ? ⭐️
🧠 Technical Analysis of GMT Coin – Daily Timeframe
This analysis reviews the recent price behavior of GMT coin on the daily chart. Based on the current market structure, there are multiple technical signals suggesting the continuation of the downtrend and a possible entry into a consolidation phase.
1. 🚀 Sharp Uptrend Followed by a Correction Phase
Initially, GMT experienced a sharp bullish rally, accompanied by a noticeable surge in trading volume, pushing the price to higher levels. However, after the rally peaked, the price entered a corrective phase that still appears to be ongoing.
2. ❌ Breakdown of the Key $0.058 Support Level
One of the most critical developments during the correction was the breakdown of the $0.058 support zone. This level had previously acted as a strong support area. Its failure signals growing selling pressure and increases the likelihood of the downtrend continuing.
3. 📉 Bearish Reaction to the 3 SMA Indicator
During its downward movement, the price encountered the 3 SMA indicator (a combination of three Simple Moving Averages). The key observations are:
All recent candlesticks have closed below the SMA lines
This is considered a strong bearish confirmation in technical analysis
It also highlights the dominance of sellers at this stage of the market
4. 🛡 Major Support Area at $0.043
Given the ongoing bearish pressure, the $0.043 support level has become a critical area to watch. Historically, this level has successfully prevented further declines and may act as a strong support once again.
If the price reaches this zone, it may:
Show a supportive reaction (respect the level)
Enter a short-term consolidation range
Or potentially initiate a new bullish wave, depending on candlestick formations and trading volume around that level
✅ Final Summary:
The overall trend remains bearish for now
The break of $0.058 and candlestick closures below the 3 SMA confirm ongoing selling pressure
The $0.043 level is a critical support zone that could trigger a potential reversal or consolidation
🗞 Recent GMT Weekly Highlights
Here are the key developments from the past week in the GMT ecosystem:
1️⃣ 🔥 Buyback & Burn of 600M GMT Tokens
GMT DAO announced a massive buyback of 600 million tokens worth around $100M. After a community vote, these tokens may be burned — a move expected to reduce supply and potentially support price growth.
2️⃣ 👟 Adidas Partnership & NFT Sneakers
The STEPN project partnered with Adidas to launch 1,200 limited edition physical sneakers tied to NFTs. This collaboration aims to boost brand visibility and attract new users.
3️⃣ 🎁 Massive Community Airdrop
An additional 600 million GMT tokens will be distributed via airdrop to increase community engagement and encourage participation in DAO governance.
I love you all so much . 👀
don't forget about capital management and risk management .
Be careful with your positions . 🥇

GMTUSDT – Trendline Breakout, and Potential for Continuation!GMT has finally shown signs of strength after a prolonged downtrend. The pair has broken out of its descending trendline, a key structure that had been capping price action for weeks. This breakout is more than just a technical event — it signals a potential shift in market sentiment 🧠.
One of the most important developments is the break above the previous lower high, which confirms a short-term bullish market structure. With this structure change, bulls have gained the upper hand — at least for now 🐂.
Currently, we are seeing what looks like a re-accumulation phase just above the breakout zone. This consolidation is healthy and typical after a strong impulse move. If GMT manages to hold above this area, we could be looking at the early stages of a bullish continuation, targeting the strong resistance zone around 0.074 🔥.
However, it’s also important to be prepared for a possible pullback. If that happens, the demand zone between 0.0487 and 0.0533 will be crucial. A retest of this zone could act as a springboard for the next upward move. 📈
🔍 Key Technical Highlights:
📉 Demand Zone: 0.0487 – 0.0533
📈 Next Target: 0.074 (Strong Resistance Area)
Final Thoughts:
Momentum is building, but confirmation is key. Watching how price reacts in the coming sessions — especially around the consolidation and demand zones — will be crucial for spotting the next big move. If bulls maintain control, we could see GMT pushing toward new short-term highs in the coming days. Patience and proper risk management are your best friends here.

GMTUSDT Analysis: Resistance and StrategyIn GMTUSDT, the red boxes represent key resistance zones . However, caution is essential as the price is currently in a strong bullish trend .
Key Highlights:
Red Boxes as Resistance: These zones are significant but require lower time frame confirmations for short entries.
Bullish Momentum: The price shows strength, aligning with my general long position target of 102k$ .
Hedge Strategy: I will consider these levels for hedge shorts while maintaining a broader long bias.
Confirmation Indicators:
Before trading these zones, I recommend using tools such as CDV, liquidity heatmaps, volume profiles, and volume footprints for confirmation.
Learn My Techniques: Interested in mastering these advanced tools to refine your trading? DM me, and I'll teach you step by step!
Support and Motivate: If this analysis helps, please boost and comment. Your engagement drives me to share more!
If you think this analysis helps you, please don't forget to boost and comment on this. These motivate me to share more insights with you!
I keep my charts clean and simple because I believe clarity leads to better decisions.
My approach is built on years of experience and a solid track record. I don’t claim to know it all, but I’m confident in my ability to spot high-probability setups.
If you would like to learn how to use the heatmap, cumulative volume delta and volume footprint techniques that I use below to determine very accurate demand regions, you can send me a private message. I help anyone who wants it completely free of charge.
My Previous Analysis (the list is long but I think it's kinda good : )
🎯 ZENUSDT.P: Patience & Profitability | %230 Reaction from the Sniper Entry
🐶 DOGEUSDT.P: Next Move
🎨 RENDERUSDT.P: Opportunity of the Month
💎 ETHUSDT.P: Where to Retrace
🟢 BNBUSDT.P: Potential Surge
📊 BTC Dominance: Reaction Zone
🌊 WAVESUSDT.P: Demand Zone Potential
🟣 UNIUSDT.P: Long-Term Trade
🔵 XRPUSDT.P: Entry Zones
🔗 LINKUSDT.P: Follow The River
📈 BTCUSDT.P: Two Key Demand Zones
🟩 POLUSDT: Bullish Momentum
🌟 PENDLEUSDT.P: Where Opportunity Meets Precision
🔥 BTCUSDT.P: Liquidation of Highly Leveraged Longs
🌊 SOLUSDT.P: SOL's Dip - Your Opportunity
🐸 1000PEPEUSDT.P: Prime Bounce Zone Unlocked
🚀 ETHUSDT.P: Set to Explode - Don't Miss This Game Changer
🤖 IQUSDT: Smart Plan
⚡️ PONDUSDT: A Trade Not Taken Is Better Than a Losing One
💼 STMXUSDT: 2 Buying Areas
🐢 TURBOUSDT: Buy Zones and Buyer Presence
🌍 ICPUSDT.P: Massive Upside Potential | Check the Trade Update For Seeing Results
🟠 IDEXUSDT: Spot Buy Area | %26 Profit if You Trade with MSB
📌 USUALUSDT: Buyers Are Active + %70 Profit in Total
🌟 FORTHUSDT: Sniper Entry +%26 Reaction
🐳 QKCUSDT: Sniper Entry +%57 Reaction
📊 BTC.D: Retest of Key Area Highly Likely
I stopped adding to the list because it's kinda tiring to add 5-10 charts in every move but you can check my profile and see that it goes on..

GMTUSDT - Sorry but Still Not Looking GoodCheck out our latest GMTUSDT analysis which is on %80 profit right now.
GMTUSDT is currently facing some challenges, and it’s not looking particularly favorable in the short term. The red boxes are acting as significant resistance zones, where the price has struggled to break through in the past. As we know, these levels are likely to continue attracting selling pressure, so we need to be cautious here.
From a strategic standpoint, I’m still maintaining a bearish outlook until proven otherwise. The price hasn’t shown any significant bullish momentum yet, and these red zones could prove to be difficult for buyers to break through. If you’re considering shorting, look for confirmations on lower timeframes around these red boxes. A clear rejection or failed break above these levels could present a strong shorting opportunity.
That said, if the price does manage to break above the red zones with volume and confirms these levels as support, I’ll be open to considering long positions. However, I won’t rush into any trades without seeing a confirmed change in momentum.
Remember, patience and smart trading with confirmation are key to avoiding unnecessary risks. Keep an eye on these red boxes, but don’t jump the gun—let the market show its intention before acting. We’re here to follow a well-defined strategy, not chase every move. If the price pushes above these levels and holds, it could be time to look for a possible long entry, but until then, staying cautious and following the flow is the way to go.
Always use proper risk management, and don’t forget to trade with the plan you’ve set, using the confirmations that matter most.
📌I keep my charts clean and simple because I believe clarity leads to better decisions.
📌My approach is built on years of experience and a solid track record. I don’t claim to know it all but I’m confident in my ability to spot high-probability setups.
📌If you would like to learn how to use the heatmap, cumulative volume delta and volume footprint techniques that I use below to determine very accurate demand regions, you can send me a private message. I help anyone who wants it completely free of charge.
🔑I have a long list of my proven technique below:
🎯 ZENUSDT.P: Patience & Profitability | %230 Reaction from the Sniper Entry
🐶 DOGEUSDT.P: Next Move
🎨 RENDERUSDT.P: Opportunity of the Month
💎 ETHUSDT.P: Where to Retrace
🟢 BNBUSDT.P: Potential Surge
📊 BTC Dominance: Reaction Zone
🌊 WAVESUSDT.P: Demand Zone Potential
🟣 UNIUSDT.P: Long-Term Trade
🔵 XRPUSDT.P: Entry Zones
🔗 LINKUSDT.P: Follow The River
📈 BTCUSDT.P: Two Key Demand Zones
🟩 POLUSDT: Bullish Momentum
🌟 PENDLEUSDT.P: Where Opportunity Meets Precision
🔥 BTCUSDT.P: Liquidation of Highly Leveraged Longs
🌊 SOLUSDT.P: SOL's Dip - Your Opportunity
🐸 1000PEPEUSDT.P: Prime Bounce Zone Unlocked
🚀 ETHUSDT.P: Set to Explode - Don't Miss This Game Changer
🤖 IQUSDT: Smart Plan
⚡️ PONDUSDT: A Trade Not Taken Is Better Than a Losing One
💼 STMXUSDT: 2 Buying Areas
🐢 TURBOUSDT: Buy Zones and Buyer Presence
🌍 ICPUSDT.P: Massive Upside Potential | Check the Trade Update For Seeing Results
🟠 IDEXUSDT: Spot Buy Area | %26 Profit if You Trade with MSB
📌 USUALUSDT: Buyers Are Active + %70 Profit in Total
🌟 FORTHUSDT: Sniper Entry +%26 Reaction
🐳 QKCUSDT: Sniper Entry +%57 Reaction
📊 BTC.D: Retest of Key Area Highly Likely
📊 XNOUSDT %80 Reaction with a Simple Blue Box!
📊 BELUSDT Amazing %120 Reaction!
I stopped adding to the list because it's kinda tiring to add 5-10 charts in every move but you can check my profile and see that it goes on..

gmtMy personal opinion is to check the channel bottom and those two green lines for buying. In the short term, there is a small resistance in the red lines that can go lower as long as it doesn't break.

GMT Buy/Long Setup (2H) RiskyFirst of all, be aware that this setup is not low-risk. However, the invalidation level is close to the entry zone, and if it gets hit, the setup will be stopped.
There are two liquidity pools on the chart, one above and one below. We anticipate that the upper liquidity pool will be collected first, and then the price will be rejected from the order block above this pool.
From a wave count perspective, we have completed wave A and are now in wave B, which is a diametric pattern. We are currently in the final wave of this diametric, wave G.
After wave B is completed, we expect a bullish wave C.
Manage your risk carefully.
For risk management, please don't forget stop loss and capital management
Comment if you have any questions
Thank You

GMT looks like a rocket (1D)GMT, unlike other altcoins, is in a valuable range.
We have a symmetrical pattern with time-price similarities. Each bearish wave has dropped approximately 80%. Now, the last bearish wave of this symmetrical pattern has also dropped 80%.
The green zone is considered a valuable range for this coin.
The bullish legs of this pattern have usually exceeded 200%.
Since we are in the final bearish wave of this pattern, we should expect a post-pattern move.
This move will be sharper and faster than the previous bullish legs because it is not corrective but post-pattern. If the count is correct, we should see a +200% bullish move from this coin.
A buy opportunity can be considered in the spot market within the green zone.
If a daily candle closes below the invalidation level, this outlook will be invalidated.
For risk management, please don't forget stop loss and capital management
Comment if you have any questions
Thank You

#GMT (SPOT-INVEST) entry ( 0.0850- 0.0910) T.(0.9500) SL(0.0846)BINANCE:GMTUSDT
#GMT/ USDT
Entry ( 0.0850- 0.0910)
SL 3D close below 0.0846
T1 0.3500
T2 0.5400
T3 0.7900
T4 0.9500
3 Extra Targets(optional) in chart, if you like to continue in the trade with making stoploss very high.
______________________________________________________________
Golden Advices.
********************
* collect the coin slowly in the entry range.
* Please calculate your losses before the entry.
* Do not enter any trade you find it not suitable for you.
* No FOMO - No Rush , it is a long journey.
Useful Tags.
****************
My total posts
www.tradingview.com
**********************************************************************************************
#Manta #OMNI #DYM #AI #IO #XAI #ACE #NFP #RAD #WLD #ORDI #BLUR #SUI #VOXEL #AEVO #VITE #APE #RDNT #FLUX #NMR #VANRY #TRB #HBAR #DGB #XEC #ERN #ALT #IO #ACA #HIVE #ASTR #ARDR #PIXEL #LTO #AERGO #SCRT #ATA #HOOK #FLOW #KSM #HFT #MINA #DATA #SC #JOE #RDNT #IQ #CFX #BICO #CTSI #KMD #FXS #DEGO #FORTH #AST #PORTAL #CYBER #RIF #ENJ #ZIL #APT #GALA #STEEM #ONE #LINK #NTRN #COTI #RENDER #ICX #IMX #ALICE #PYR #PORTAL #GRT #GMT #IDEX #NEAR #ICP #ETH #QTUM #VET #QNT #API3 #BURGER #MOVR #SKL #BAND #ETHFI #SAND #IOTX #T #GTC #PDA #GMX #REZ #DUSK #BNX #SPELL #POWR #JOE #TIA

#GMT (SPOT) entry ( 0.1400- 0.1960) T.(0.9500) SL(0.1300)BINANCE:GMTUSDT
#GMT/ USDT
Entry ( 0.1400- 0.1960)
SL 1D close below 0.1300
T1 0.3500
T2 0.5400
T3 0.7900
T4 0.9500
3 Extra Targets(optional) in chart, if you like to continue in the trade with making stoploss very high.
______________________________________________________________
Golden Advices.
********************
* collect the coin slowly in the entry range.
* Please calculate your losses before the entry.
* Do not enter any trade you find it not suitable for you.
* No FOMO - No Rush , it is a long journey.
Useful Tags.
****************
My total posts
www.tradingview.com
1Million Journey
www.tradingview.com
www.tradingview.com
**********************************************************************************************
#Manta #OMNI #DYM #AI #IO #XAI #ACE #NFP #RAD #WLD #ORDI #BLUR #SUI #VOXEL #AEVO #VITE #APE #RDNT #FLUX #NMR #VANRY #TRB #HBAR #DGB #XEC #ERN #ALT #IO #ACA #HIVE #ASTR #ARDR #PIXEL #LTO #AERGO #SCRT #ATA #HOOK #FLOW #KSM #HFT #MINA #DATA #SC #JOE #RDNT #IQ #CFX #BICO #CTSI #KMD #FXS #DEGO #FORTH #AST #PORTAL #CYBER #RIF #ENJ #ZIL #APT #GALA #STEEM #ONE #LINK #NTRN #COTI #RENDER #ICX #IMX #ALICE #PYR #PORTAL #GRT #GMT #IDEX #NEAR #ICP #ETH #QTUM #VET #QNT #API3 #BURGER #MOVR #SKL #BAND #ETHFI #SAND #IOTX #T #GTC #PDA #GMX #REZ #DUSK #BNX #SPELL #POWR #JOE #TIA


GMT buy/long setup (2H)A strong source of movement has been tapped, and the lower liquidity pools have been swept clean. The price has encountered an important demand zone. In the upper part of the chart, there are no strong order blocks visible, and the price has already dropped significantly, giving a prolonged corrective phase. It is susceptible to a bullish move.
The targets are marked on the chart.
A 4-hour candle close below the invalidation level would invalidate this analysis.
For risk management, please don't forget stop loss and capital management
Comment if you have any questions
Thank You

GMTUSDT 1WGMT ~ 1W
#GMT This is the final support for this Coin,. If you still have Conviction on this coin,. Buy in stages, Target 20%++

GMTUSDT: Breakout or Pullback? Long Position Ready to LaunchHey, traders! 🐂
Today, BINANCE:GMTUSDT is in the spotlight. The price is holding at 0.16123 USDT , and the chart is forming an ascending triangle — one of the most popular bullish patterns. Resistance at 0.16425 USDT has been tested multiple times, but bears are still holding the line. Will it break through, or should we expect a pullback?
---
🔑 Key Levels:
Support:
0.16330 USDT – the nearest point for a retest.
0.16000 USDT – the main line of defense for buyers.
Resistance:
0.16425 USDT – the current zone that needs to be breached.
0.16643 USDT – the first target after a breakout.
0.16986 USDT – the final target for the long position.
---
🚩 Trading Strategy:
Entry Point:
- Consider going long after a confident breakout above 0.16425 USDT , confirmed by volume.
Stop-Loss:
- Place your stop below 0.16100 USDT to minimize risks.
Take-Profit Targets:
0.16643 USDT – the first target where partial profits can be taken.
0.16986 USDT – the final target if the momentum continues.
---
📈 Technical Analysis:
The ascending triangle signals growing strength among buyers.
Volume is increasing near the resistance zone, confirming bullish activity.
A retest of 0.16425 USDT before the breakout presents an excellent entry opportunity.
---
💡 What to Expect?
If the 0.16425 USDT level is broken, we have every chance of seeing a strong upward move. However, if bears maintain their resistance, a pullback to support at 0.16000 USDT is likely. What’s your take? Share your ideas — collective wisdom always wins! 🚀

Watch GMT Reach $0.26: More Gain Likely in 2025Hello and greetings to all the crypto enthusiasts, ✌
I aim to provide you with a comprehensive overview of the future price potential for GMT , 📚💡
GMT is a highly promising project that skillfully bridges the gap between emerging technologies and the physical world, offering a distinct competitive advantage. Its launch garnered significant media attention, and it quickly established a strong, engaged community within the digital space, attracting both enthusiasts and institutional interest. 📚🎇
Technically, after several months of price correction and consolidation, GMT is now positioned in a favorable spot for growth. The token shows strong potential for at least 60% upside, reflecting its solid foundation and market readiness. Given the current dynamics, it represents an attractive opportunity for future gains. 📚✨
🧨 Our team's main opinion is: 🧨
GMT, blending tech innovation with the physical world, has built a strong community and, after months of consolidation, is poised for a 60% growth, making it a solid investment opportunity.
Give me some energy !!
✨We invest countless hours researching opportunities and crafting valuable ideas. Your support means the world to us! If you have any questions, feel free to drop them in the comment box.
Cheers, Mad Whale. 🐋

GMTUSDT On The Way To 30 CENTS !!!As you can see, the price is likely forming a cup and handle pattern. If our assumption is correct, we should wait for this pattern to break out to see a price increase.
Give me some energy !!
✨We spend hours finding potential opportunities and writing useful ideas, we would be happy if you support us.
Best regards CobraVanguard.💚
_ _ _ _ __ _ _ _ _ _ _ _ _ _ _ _ _ _ _ _ _ _ _ _ _ _ _ _ _ _ _ _
✅Thank you, and for more ideas, hit ❤️Like❤️ and 🌟Follow🌟!
⚠️Things can change...
The markets are always changing and even with all these signals, the market changes tend to be strong and fast!!

GMT Analysis - What Shall we Expect !!!The price is within an ascending wedge and this can be a bullish signal for GMT. However, we need to wait for this wedge to be broken and then wait for the price to rise. Currently, the price can be bearish because more funds have been injected into Bitcoin to allow Bitcoin to find more stability in the coming days.
Give me some energy !!
✨We spend hours finding potential opportunities and writing useful ideas, we would be happy if you support us.
Best regards CobraVanguard.💚
_ _ _ _ __ _ _ _ _ _ _ _ _ _ _ _ _ _ _ _ _ _ _ _ _ _ _ _ _ _ _ _
✅Thank you, and for more ideas, hit ❤️Like❤️ and 🌟Follow🌟!
⚠️Things can change...
The markets are always changing and even with all these signals, the market changes tend to be strong and fast!!

Stepn GMT price analysisWhile the crypto market continues to stagnate, long-forgotten “hype” projects are trying to “shoot”)
🚀 For example, they decided to give a ray of hope to fans of #Stepn OKX:GMTUSDT sneakers
Although there is a prospect of growth of at least x2 to $0.38-0.40, we don't want to buy this asset.
🆗 Because the pump can end at any second and then again many months of sitting in a drawdown.
‼️ Therefore, we would consider this one-time growth as an opportunity to exit the position at $0.40, and if you are lucky, at $0.60 - it's hard to believe higher.
_____________________
Did you like our analysis? Leave a comment, like, and follow to get more

GMTUSDT (GMT) Updated till 27-12-24GMTUSDT (GMT) Daily timeframe range. PA got long way to go. not much of retail interest for now. 0.1262 defended well and staying above it will be more optimal. recent resistance at 0.1852 a little bit volume can push it toward it again.
