GMT trade ideaHow about this for a trade idea on GMT.
Bounced off the 0.5 line nicely.
Price has been holding well despite bitcoin price going down.
GMT/BTC pair looks good also. 12 hour timeframe green hammer candle. Wicked down to 0.382 fib level and bouncing nicely off the 0.5 level as well.
Could trail your stop loss with the fib levels. or use them as an alternative to my swing low stop.
GMTUSDT

GMT - Target 4.6 then 5.6$STEPN(GMT) is a crypto token using the Solana (SOL) blockchain. Experts say that the massive uptrend in GMT price has been due to the hype surrounding DeFI projects that reward users with tokens for staying active. STEPN rewards users for walking, jogging or running!
Some of the top rivals of GMT are Genets (GENE) and dotmoovs (MOOV). The prices of all these tokens have jumped recently.

STEPN GMT short Price Targets and Stop LossGMT/USDT short
Entry Range: $3.10 - 3.35
Price Target 1: $2.90
Price Target 2: $2.52
Price Target 3: $2.06
Stop Loss: $3.80

GMT: is it a new x100 coin? Stop fooling yourself!Stepn (GMT) is a new game-fi project, which immediately attracted the attention of traders and investors. Its total capitalization is $1.6 billion.
On the chart we see 2 accumulation zones:
1. $0.62-0.85.
2. $2.05-$2.9.
After the first accumulation GMT rose by 264% after the breakdown of the accumulation zone. Now it is in a similar situation. Accumulation has continued for more than 2 weeks. If we use classic technical analysis, we should see a repeat of the 230-250% rise to $10-12. The price can go even higher. We've all seen Solana go up by 10,000%!
But I will share with you an alternative point of view. 2.92-3.30$ is the strongest resistance zone for the price:
1. ATH is an important key level
2. a possible trap for retail traders who will buy on a breakout of second accumulation zone
After a false breakout of second zone, price could pullback under the accumulation zone, liquidating and collecting long traders' stop-lossed. After such massive liquidations, a LONG trade can be opened with better risk to reward (RR).
While I was making this idea, GMT rose by 10%, so let's check our TWO hypothesis.
Friends, press the "like" button, write comments and share with your friends - it will be the best THANK YOU.
P.S. Personally, I open an entry if the price shows it according to my strategy.
Always do your analysis before making a trade.

Look at This!the chart shows everything, just buy on the weakness, what do you think? do you want this crypto??

SELL GMT/USDT TODAY✔now it is better not to move today if you have GMT or if you want to enter in it because after 2 days or less it will be more claire & easier✔
+ If it goes up you can sell at 3.77 because there is a resistance (after confirmation)👀
+If it goes down you can buy at 2.12(after confirmation)😶
BUT IF YOU WANNA MOVE NOW SELL
SO OPEN YOUR WALLETS & GOOD LUCK✔❤ 🤑

GMT, what next?Is this asset retracing or the bulls are strong enough to continue the ride to the north?

GMT brief correction before more gain 📖💡Based on the chart and candles, we can expect brief correction to the downside before more gain for gmtusdt 💡📖
if only
the price breaks our resistance area to the upside, we can see more gain 🚀
Please, feel free to ask your question, write it in the comments below, and I will answer.🐋

GREEN METAVERSE TOKENGMT/USDT the price is now on Support and Buy Zone i see if the price will follow my instruction

$GMT - Looking for the end of this move. For a new coin, this is making surprisingly nice waves.
I have laid out what I think is the initial impulse of this coin. And while I labelled where it could end, I will be looking for a long on the retrace after the move is done. Once it is, we'll be able to fib retrace and pinpoint a LONG entry.
I'm not comfortable shorting a coin with such a short history and which seems this bullish.
SAfe trades.

GMT to 4.45 -3.7 - then 6?Expanding Diagonal Motive Wave.
Wave 5 will always be the longest wave for expanding waves. Point A can retrace @ exactly the size of wave B which is 4.45- 4.5
Entry at point B above sign of strength. Stop loss below.

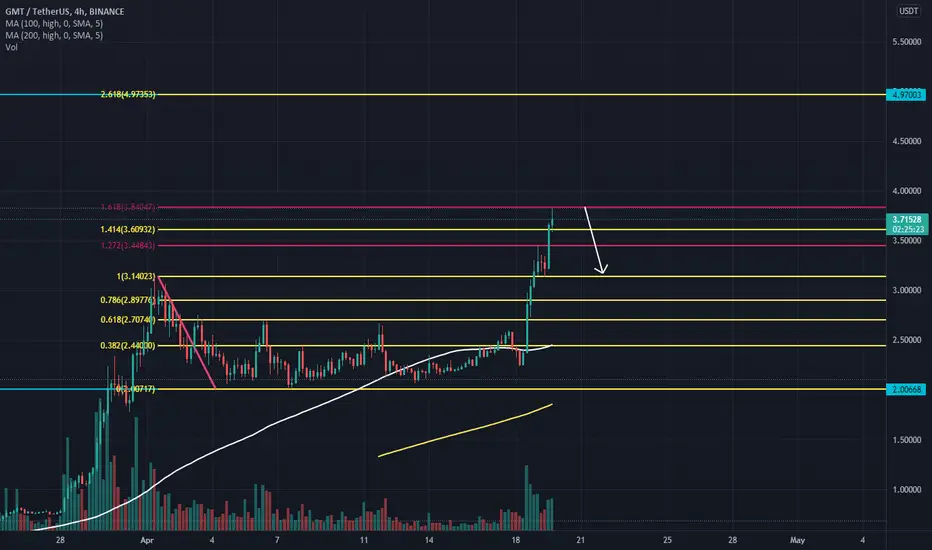
GMT takes a breath after large price increaseHello everyone, let's look at the GMT chart to USDT on the 4h interval. As you can see, the price moves above the local growth trend line designated with a blue line.
Let's start with the designation of the support line and as you can see the first support in the near future is $ 3.41, if the support will be broken, the next it is $ 3.14 at 2,93 $ and 2,71 $.
Now let's move from the resistance line, as you can see, the first resistance is 3.83 $ = 1.618Fib Retracement from which the price has just bounced if you manage to break it, the next resistance can be determined in the area of 4.96 $.
Looking at the Chop indicator, we see that in the 4-hour interval, most energy has been exhausted. It is possible that we will have to wait for the next move until energy is collected.

We may witness a correction in the GMT currency towards the 3.15We may see a drop in the GMT currency towards the area of 3.15 Dollar
After reaching 1.61 Fibonacci areas,
GMTUSDT 🏹see and watch :)
The price is moving in an upward channel and will probably move towards the specified goals ...
Note that the risk of buying is currently very high ...

GMT Breakout Opportunity; we Wait GMT recently broke 3$ and made a 50% move from yesterday. As of this writing, GMT is consolidating in a falling wedge pattern(usually bullish), and sitting at the 0.236 Fib level. It's possible that GMT will break 3.45 and reach up to 4.0 levels. Will be updating this post as time passes by.

GMT >> 2.98 > 4.75These three positions are available for GMT based on Bollinger Bands analysis:
First drop to 3.09
Pullback to 3.19
Fall again to 2.98
And start moving towards 4.75 and the new ATH

GMT gem can make a new ATH ?GMT buy setup for hold mode
YOU CAN BUY on green lines
targets: red lines
comment your idea

GMT brief correction ❌🧨Based on the chart, before more gain the price need brief correction to the downside ❌🧨
again
we can see more gain from our support areas (that are based on the Fibonacci levels) and located on the chart 🚀
Please, feel free to ask your question, write it in the comments below, and I will answer.🐋

gmtusdtgmt need to complete this pattern to go up if not correction id coming
we need more confirmation

GMT/USDTGiven the chart, which has hit the 1.28 Fibonacci level, it is likely that we will correct the $ 2.8 range. If the correction is not made, the chart could rise to the 1.68 Fibonacci level, which is the $ 3.8 range.

GMT/USDTTTM SQUEEZE Says GMT is close to Correction mode , and new Daily candle have only 45 mints left better to wait for 45m new candle will decide the market direction.

GMT-4HA highly anticipated new coin, I don't really know what's the hype but here is a quick TA with few information.
A clear breakout from the downtrend, currently sitting on the weekly pivot point.
I don't recommend long positions since it had no correcive movement in 1 month, but if you wanna give it a shot,
possible targets are on the chart. Make sure you use a tight stoploss.
NFA, DYOR.

STEPN - GMT Approaching the Big Resistance Now 👟''STEPN IS A WEB 3 LIFESTYLE APP www.stepn.com WITH SOCIAL-FI AND GAME-FI ELEMENTS
👟PLAYERS CAN MAKE HANDSOME EARNINGS BY WALKING, JOGGING, OR RUNNING OUTDOORS''👟
👟Great project, fantastic idea, Perfect execution of the Whitepaper, a strong-young team
but our chart says: More than 80% chances for a rejection
👟We didn't have the chance to invest here until it came in the Top-100 (now at #58 place in marketcap).
👟We see great potential here and we hold an NFT, which is a great utility; but we have to follow the chart. Time to be aware.
One Love,
the FXPROFESSOR
